While we’ve touched on EURUSD many times over the past month, it’s been a while since we devoted an entire post to it. As the pair approaches our next upside target, this seems like a good time to review the bigger picture.
In July, EURUSD completed another in a series of breakouts driven more by dollar weakness than euro strength. This one, however, represented a significant change from the pattern in place since Jan 2015.  We’ll take a look at the big picture and the likelihood of reaching and reversing at 1.24.
continued for members…
I’ve been focused for the past month or two on the top of the falling red channel and .618 Fib at 1.2597. Note, however, that 1.24 represents a backtest of the huge H&S Pattern’s neckline (the red dashed line.)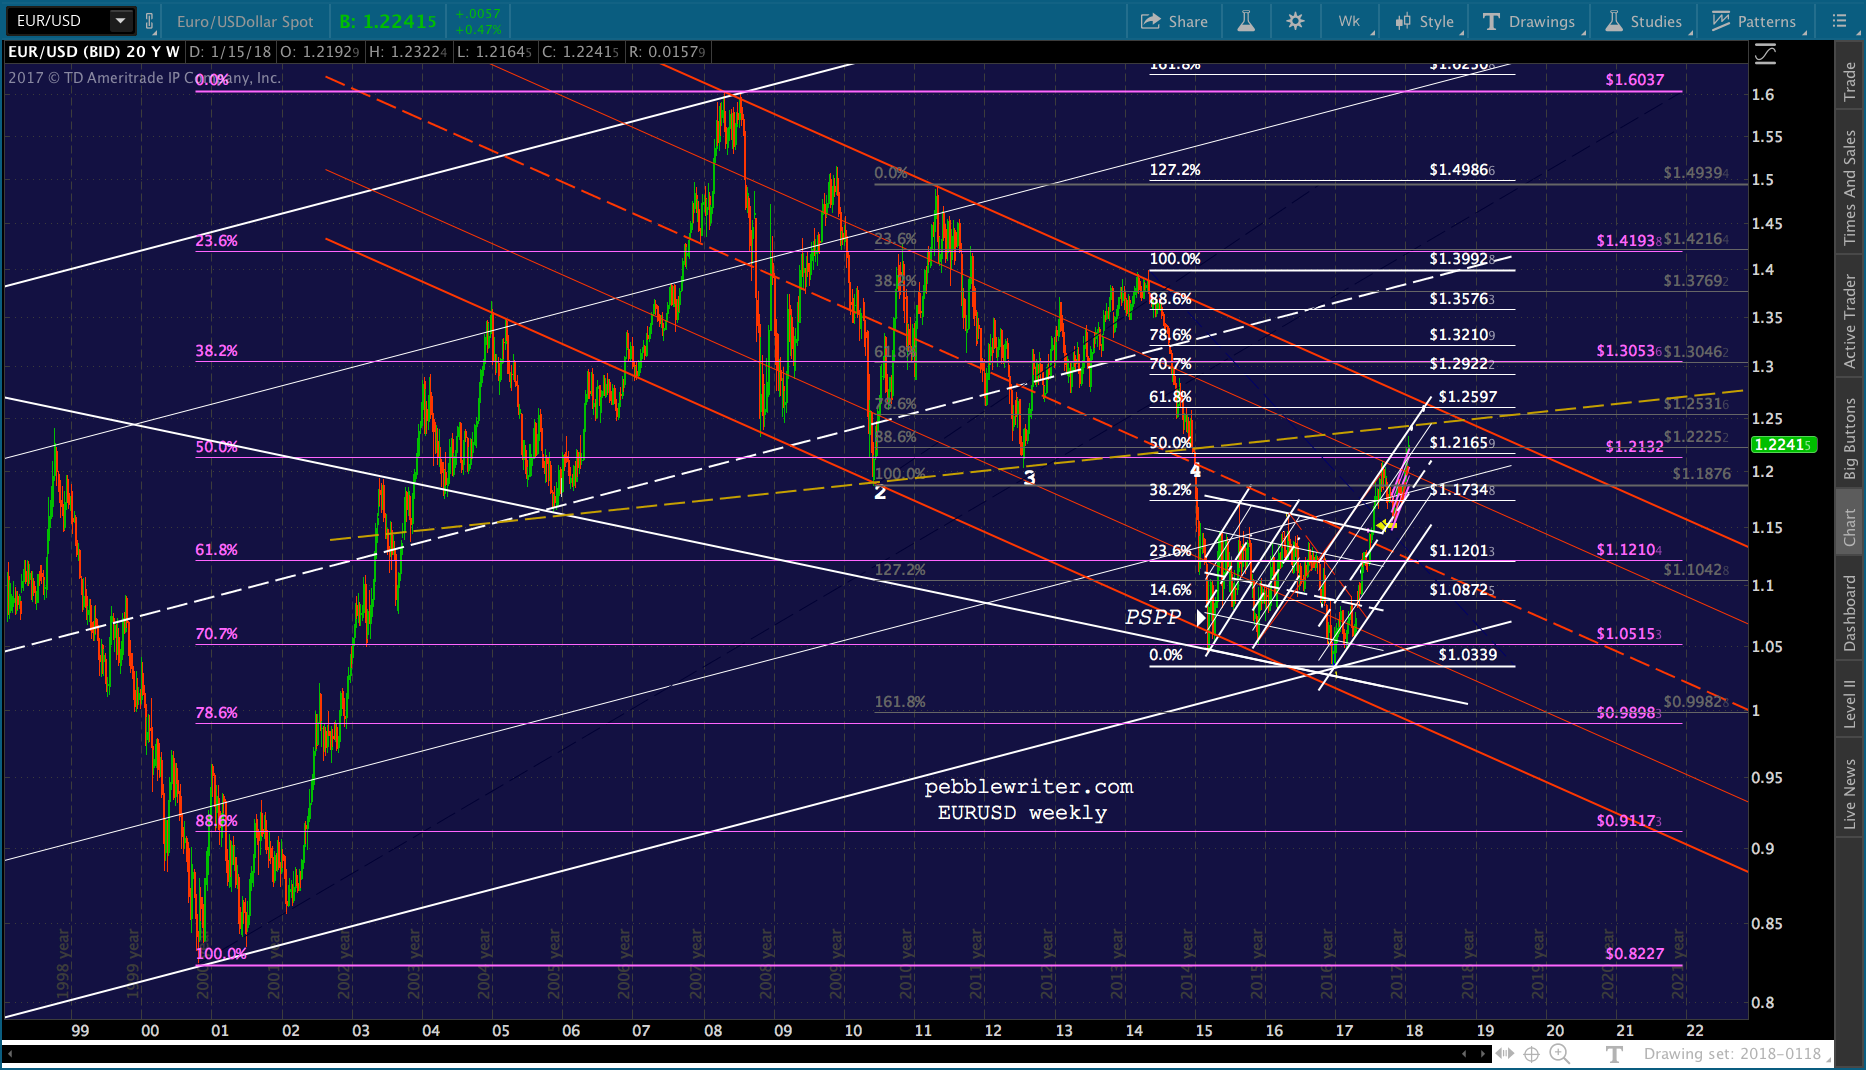 But, I have to admit I cheated a little in drawing that neckline a few years ago. The pattern has two right shoulders. And, I drew the neckline through the bottom of both (points 2 & 3), which means it slightly missed the Nov 2005 lows.
If I had drawn a line between the Nov 2005 and the Jun 2010 lows, it would have missed the Jul 2012 lows by .006. Not a lot, of course. And, I’m sure that was the ECB’s point when they jumped in and propped up the euro on July 24, 2012: stop the H&S from playing out.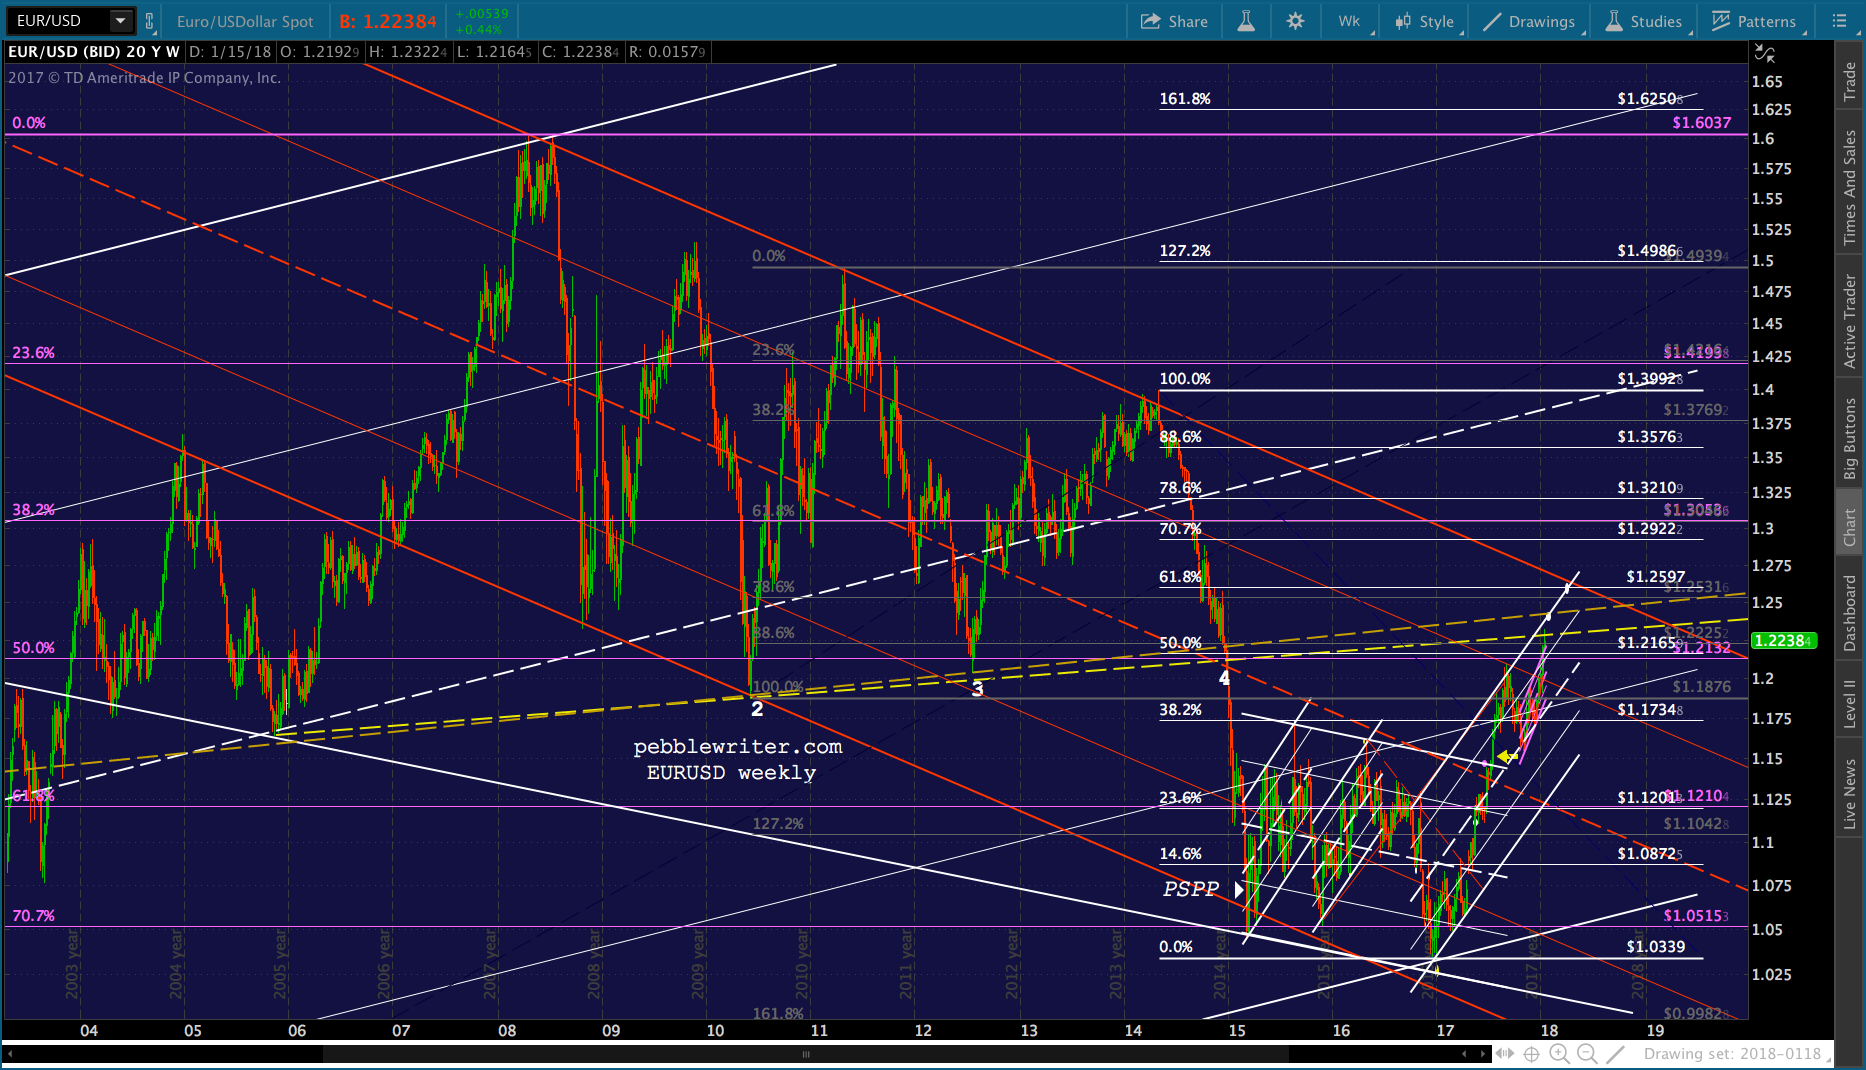 The problem is that the neckline that would have resulted from the two legit lows, shown below in yellow, passed right through the highs of the past few sessions.
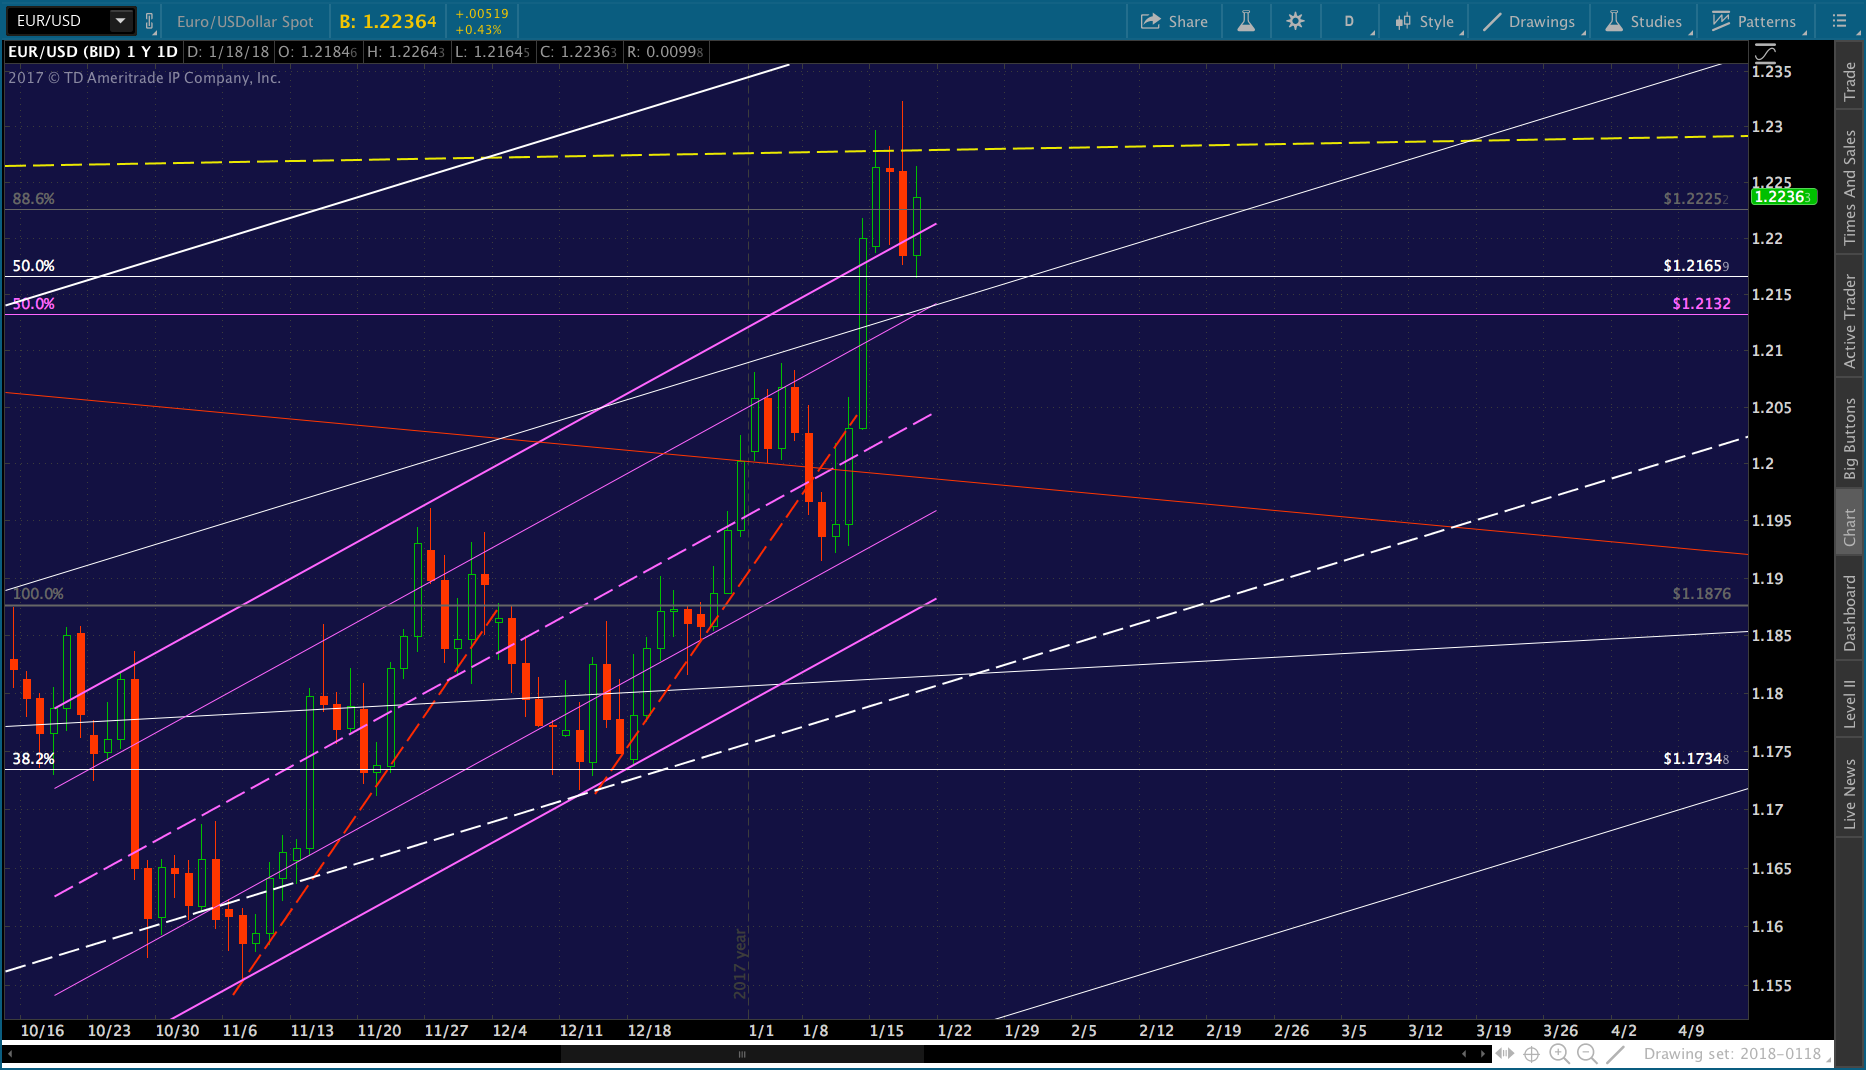 Which one is right? I always prefer to see chart patterns align with Fibs. It strengthens the case for a reversal. With EURUSD currently around 1.23, should we care about the red neckline at 1.24? What about the .618 Fib at 1.2597?
I can fiddle with the smaller, rising white channel and make it fit either scenario, so it’s not much help. The large, falling red channel is a different matter.
Note that it has stopped EURUSD’s advances several times since stocks peaked in 2007. It passes through the white .618 fairly soon. The only caveat, again, is placement.
If I base the channel top on the 2008 and 2011 highs, as it’s currently drawn, the intersection is at most a few months away. If I include the 2014 high, however, the intersection isn’t until well into 2019. And, if we get an overshoot as has often occurred, EURUSD could pop up and tag 1.2597 tomorrow.
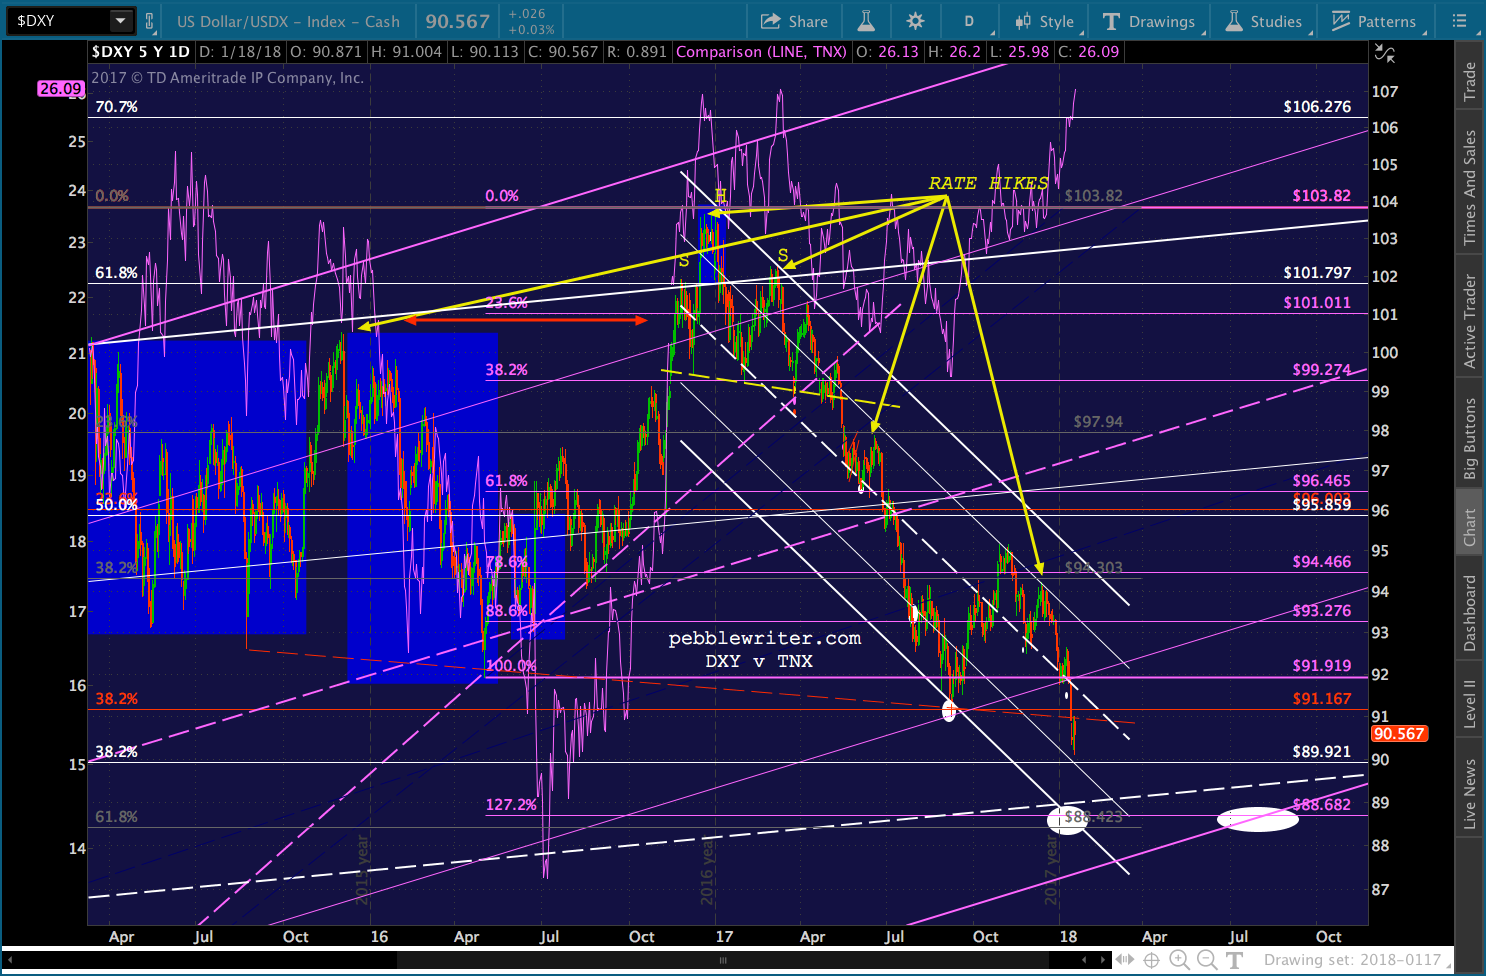
Bottom line, we’re close. For some help, I remain focused on DXY. When it bottoms out, EURUSD should be done rising. In my opinion, DXY should run into strong support between 88.43 and 88.682.