Month: December 2017

  • A Tale of Two Data Points

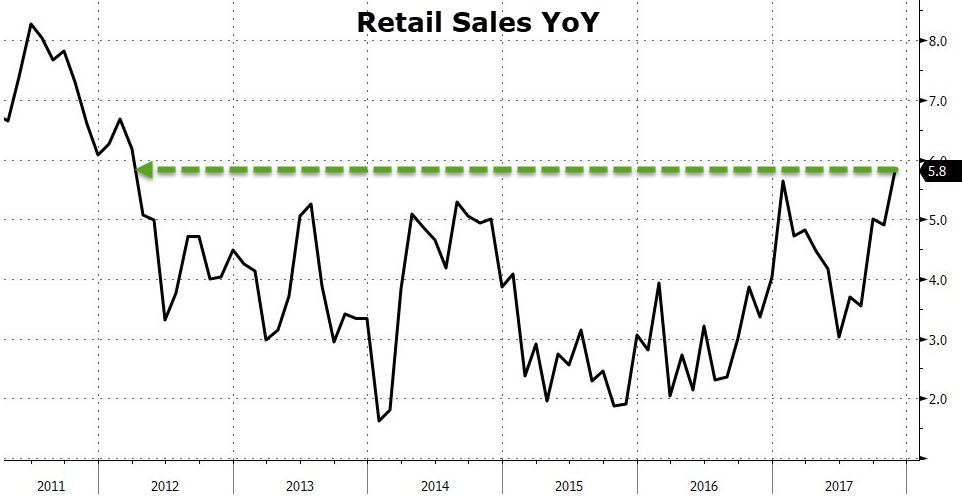
    When it comes to retail, these are the best of times and the worst of times.  Retail sales last month grew at a 5.8% annual rate — the best since March 2012.But, revolving credit (which recently hit new, all-time highs) has been growing at an annual rate of over 10%.  And, delinquencies are on the rise.

    From a retailer’s standpoint, unless you’re Amazon (33% YoY revenue growth in Q3) you’re not loving the data at all.

    And, not even Amazon can be too excited about the lethargic pace of real income “growth.”

    continued for members(more…)

  • FOMC Day: Dec 13, 2017

    It’s that time again — when the FOMC does its level best to convince investors algos that they should be optimistic buy more equities.  Lately, this has meant a not so subtle message that rates are normalizing rising ever so slightly, inflation remains under control disappointing and the future looks strong good enough.

    We touched on the inflation scam in yesterday’s post: PPI Tops 3%.

    The primary culprit: gasoline prices, which BLS officials say increased 15.8%.  Imagine what PPI would have registered if they’d used EIA-fabricated data (+17.4%) or the actual increase over Nov 2016 of +20.3% [see: Again, With the CPI Games?]

    Today, thanks to the miracle of seasonal adjustment, we learn that consumers experienced a mere 7.3% YoY increase in the price of gasoline, yielding a YoY CPI increase of only 2.2% (core came in at 1.7%.)

    This assessment, of course, flies in the face of virtually all the data as well as every consumer’s experience.  But, otherwise, it’s sound as a pound.

    The important takeaways: inflation is not a problem (unless you care about facts) accommodation should continue (because we all know what would happen without it), and rates should gradually increase (even as the curve collapses, because they need a higher perch from which to reduce rates the next time markets collapse.)

    continued for members…
    (more…)

  • PPI Tops 3%

    Producer prices for final demand shot up 3.1% YoY in November, up from 2.8% in October and well above consensus at 2.9%.  It’s the highest rate of change since Jan 2012.

    The primary culprit: gasoline prices, which BLS officials say increased 15.8%.  Imagine what PPI would have registered if they’d used EIA-fabricated data (+17.4%) or the actual increase over Nov 2016 of +20.3% [see: Again, With the CPI Games?]

    While the data certainly offer convenient cover for a rate hike, they present practical problems for central bankers who are worried about disappointing the algorithms which drive equity markets.

    Rising oil and gas prices have been instrumental to rising equity prices.  But, as we’re reminded once again, there is no free lunch.

    continued for members

    Higher inflation supposedly means higher interest rates, so the DXY is marginally higher this morning.  And, at least some of that dollar strength is courtesy of the JPY — which just reached channel resistance.  For those playing the USDJPY, this is a good entry for a short position with tight stops.  The initial target is the SMA200, currently at 111.64, followed by the .618 at 110.14 and channel bottom currently around 109.But, the impact I’m watching most closely is that of RB and CL.  Note that RB has tagged the top of the falling white channel and is reversing.  A test of the neckline is just ahead.

    For anyone who isn’t still short, this should be a good entry point for our lower targets at 1.64, 1.63, 1.60 and 1.52.  But, since we’re looking for DXY and USDJPY to tumble from here, CL/RB might rally in order to prop up stocks going into year end.  As we’ve discussed, the same thing happened last year.  Bottom line, use stops.  It’s unlikely TPTB will sit on their hands if stocks start slipping.

    CL has clearly backed off a TL connecting its recent highs…for now.

    UPDATE:  10:25 AM

    RB just tested the neckline, momentarily breaking the yellow TL shown below.  Stay tuned…

  • More Meltup: Dec 11, 2017

    The past week saw ES retake its broken purple channel, then decisively break down, and, now, rally to test it all over again.  It’ll be interesting to see where it ends up when the music stops.The past few days have been driven primarily by the latest breakdown in VIX and breakout in USDJPY — nothing new.  Yet, for bears, there’s perhaps a light at the end of the tunnel.

    continued for members(more…)

  • Charts I’m Watching: Dec 8, 2017

    The algos are happy.  Brexit is humming along, Congress kicked the budgetary can down the road a whole two weeks, and USDJPY even had the decency to finally break out.  Sure, the gold bugs are getting hosed.  But, what else is new?  As our friends in the Eccles Building would say, “serves them right for doubting the strength and security of the dollar.”

    continued for members(more…)

  • Fighting the Fed

    Still on hospital duty for the next couple of days, so this post will be brief.

    As we discussed yesterday, gold and the USD had reached a crossroads.  One had to win (break out), and the other lose (break down.)  It’s ironic that gold lost this particular battle, as the next CPI data we see will surprise to the upside.  Just another day in the Fun House the Fed built.

    Gold traders and stackers are perfectly justified in crying “foul,” but it’s hardly the first time someone learned the hard way not to fight the Fed.

    continued for members(more…)

  • DXY vs Gold: It’s Time

    There’s an interesting tug of war going on between DXY and GC.  As we forecast last week, GC has dropped down to test its SMA200.  At this point, it is also testing two key trend lines that we’ve been expected would come into play again. At the same time, DXY has finally broken back above its SMA10 — and continues to test its SMA100.  As detailed yesterday, which way it breaks should determine whether USDJPY or CL drives stocks next.

    continued for members(more…)

  • Dollar Doldrums

    Yesterday marked another failed recovery attempt by the US dollar.  It started out strongly, rallying .75 from the previous day’s lows based on the tax bill advancing in the Senate.  But, political turmoil struck again.  The latest twist in the Flynn/Mueller/Trump saga wasn’t exactly dollar-positive.  DXY closed in the red for the third session in a row.

    We shorted DXY way back on Nov 9, when it dropped through its SMA10.  The move was confirmed on Nov 14 when the rising white channel broke down and hopes of a tag on the SMA200 or falling white channel top started looking iffy.

    The bounce at the .618 Fib on Nov 27 gave dollar bulls hope.  But, it has still yet to close above its SMA10, let alone the SMA100.

    A backtest at 95+ is looking less and less likely every day.  And, with another debt limit impasse ahead, the risks are mounting.  If it can’t rally based on the tax bill or the all but certain Fed rate hike, what’s it going to take?

    continued for members(more…)

  • Charts I’m Watching: Dec 4, 2017

    Between the Senate passing its version of the tax bill and the CVS/Aetna deal, futures are up almost 20 points this morning.

    The DXY and USDJPY are getting a nice bump.  And, VIX is, of course, slipping. So, what could go wrong?

    continued for members(more…)

  • Again with the CPI Games?

    They did it again.  The EIA just reported that the average price of regular gasoline for the month of November was 2.474.  This is all well and good, except for the fact that gasoline only sold for 2.474 one day during the month of November – the 1st.

    Why the charade?  Energy is one of the most volatile components of CPI.  The Fed ignores it for many of its economic assessments.  But, for consumers, it’s a very real and unavoidable expense.  It shows up in everything from the cost of heating your home and driving your car to the price of groceries and manufactured goods.

    By using 2.474 as the average price of gasoline, the YoY increase from Nov 2016’s average price of 2.105 was 17.5%.  Had the actual average price been used, instead, the annual increase would have been 20.3%. And, if Nov 2016’s average price hadn’t been artificially inflated by the Nov 1 Colonial Gas Line explosion (the yellow arrow below), the YoY increase would have been even higher.It doesn’t seem like a huge difference, but it matters.  Note, for instance, that Feb 2017’s 32% YoY increase in gasoline correlated with the highest CPI print in recent years: 2.7%.

    In October, when the EIA reported an annual gas price increase of 11.1%, the BLS reported an increase of 10.8%.  Fuel oil and gasoline registered the biggest price increase of any CPI component.  But, by understating the actual price increase, reported CPI was limited to 2%.

    As we’ve discussed many times, central bankers talk a good game when it comes to inflation.  For all their bellyaching about wanting higher inflation, they know full well that the resulting cost of living increases and higher interest rates would simply be unaffordable for a country that can’t even make ends meet with ZIRP (and, a tax cut in the works.)

    So, they continue to walk this fine line.  Between errant calculations and periodic changes in how inflation is measured, they’ve managed to keep the headline number low enough. But, higher oil and gas prices — which keep algos happy and stocks on the rise — can result in rather inconvenient inflation.  They can try to crash oil prices, again.  But, that almost blew up the oil industry.

    And, with the end of the year around the corner, they have to worry about tanking the stock market.  Instead, they’re using falsified data to sell investors on the notion that inflation is non-existent or, to use their favorite term, “transitory.”

    Now, for a few charts and our new price targets for CL and RB.

    continued for members(more…)