Isn’t it great!? The worst ADP jobs data in months.
 Under the premise that bad news decreases the odds of a rate hike (or, dare we hope, spurs more QE?) the eminis are up 15 points (off from a high of +20) before the opening. But, it’s not the kind of pattern you’d want to bet the house on.
continued for members…
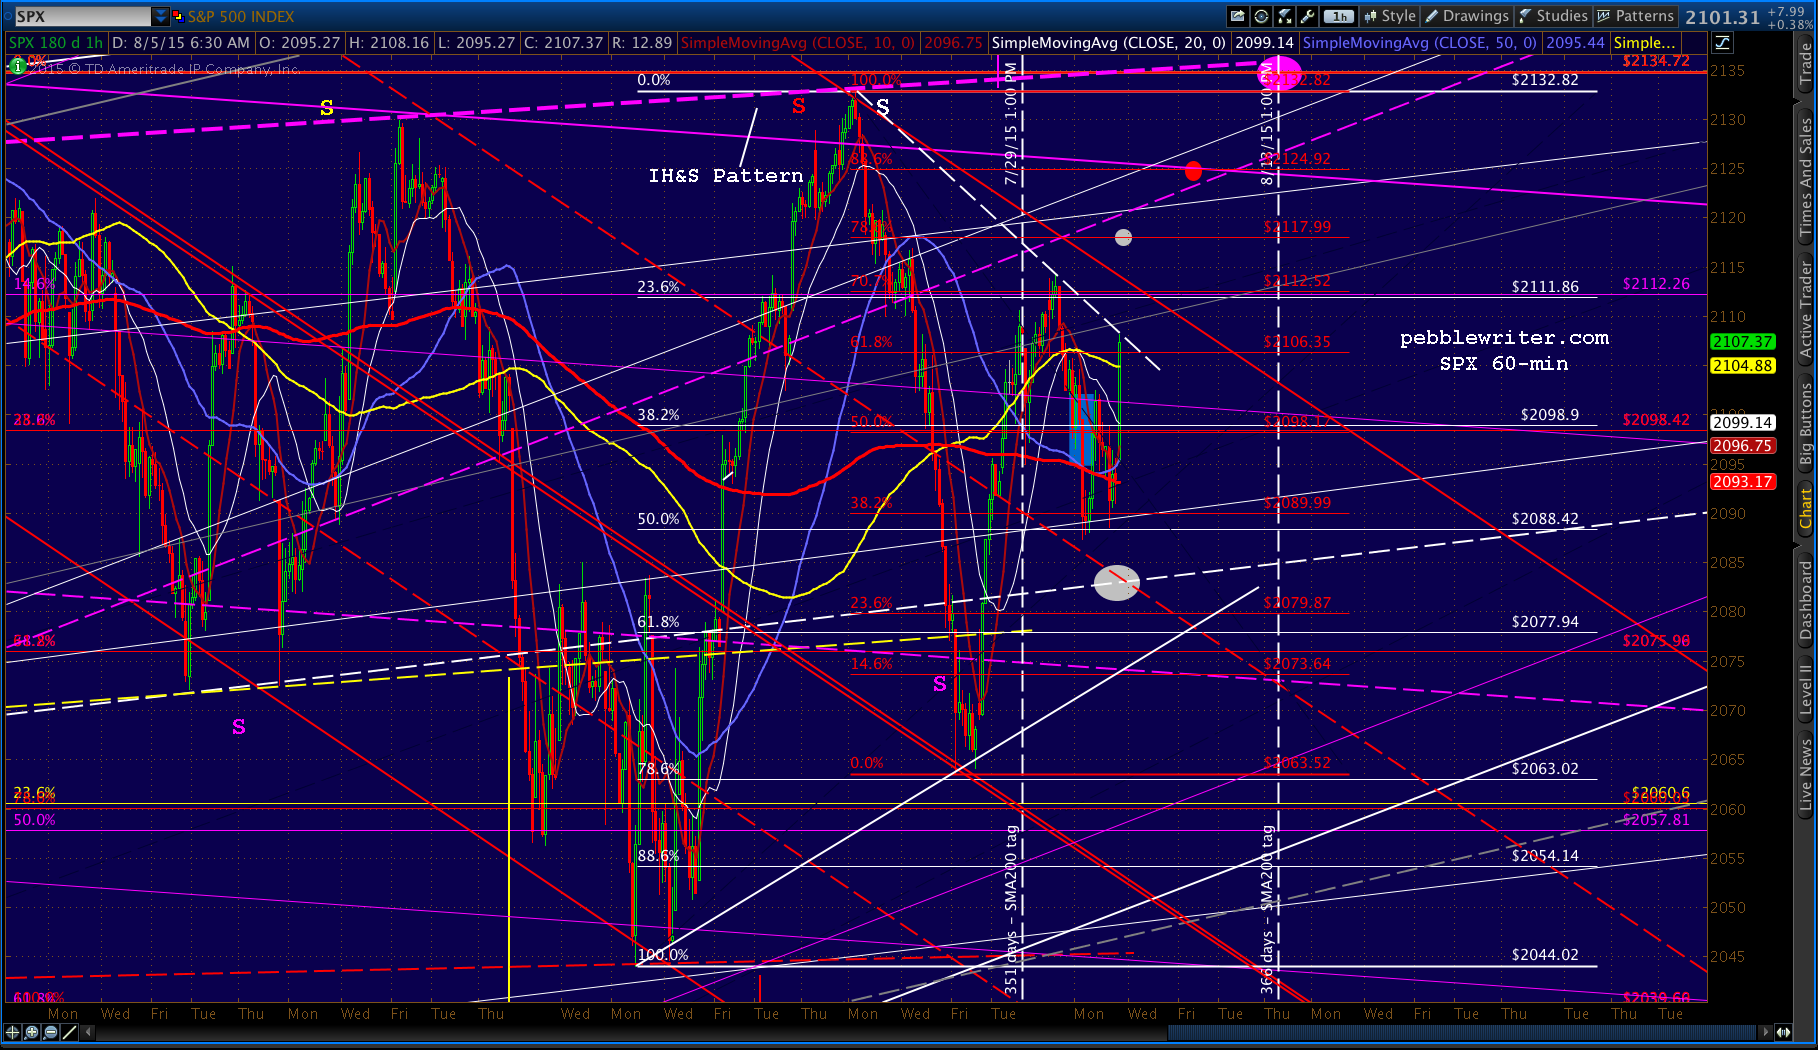
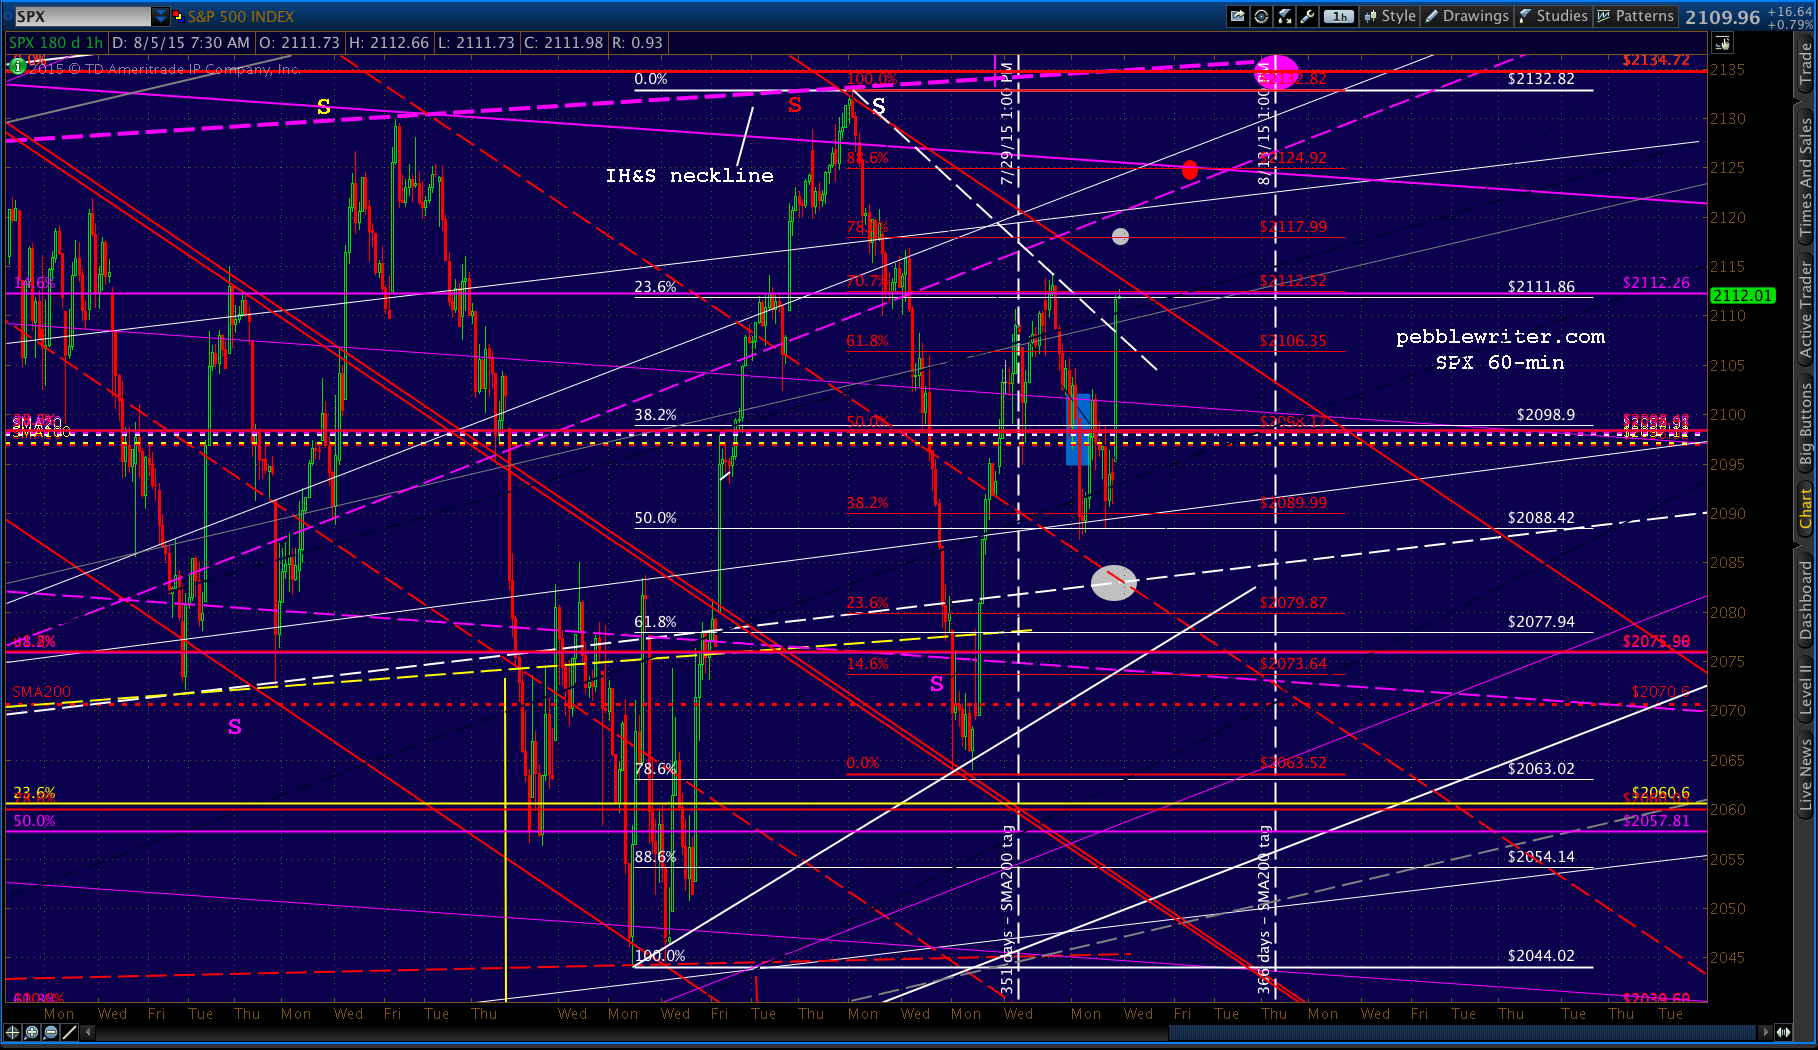
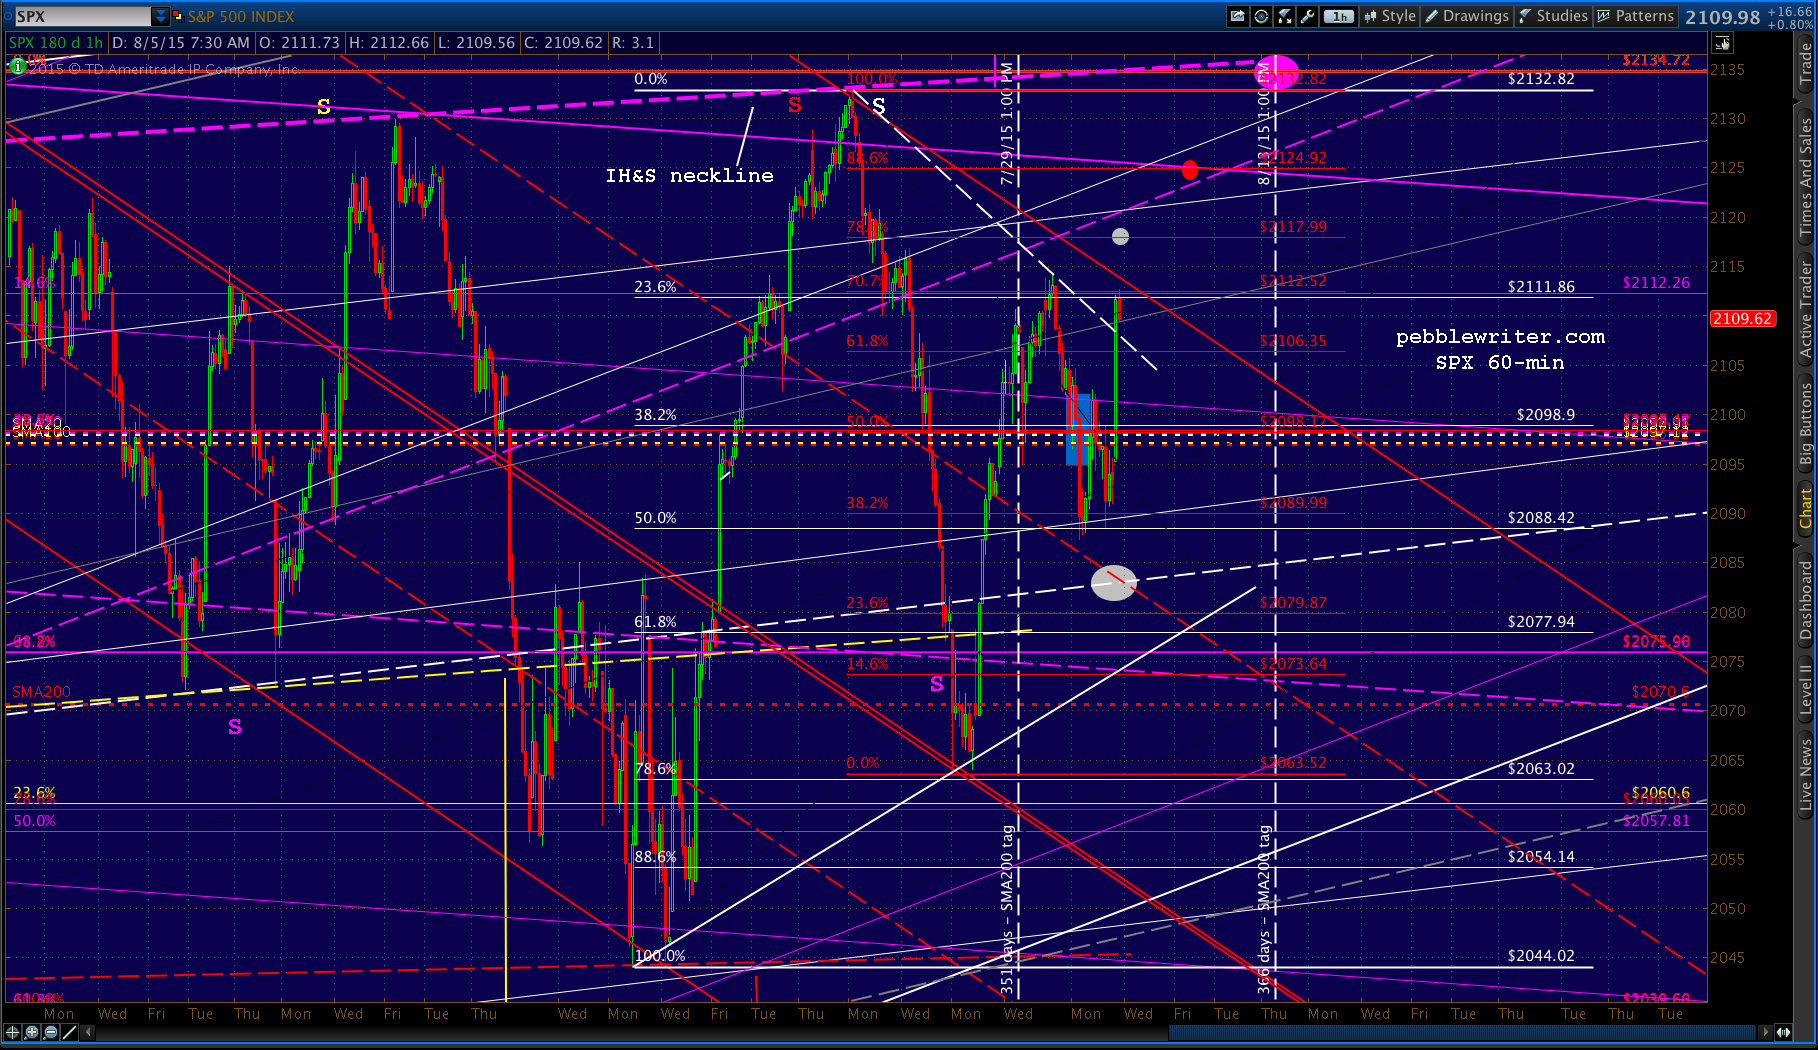
I have a lot of charts to present this morning, so I’ll do a quick dump and then add the commentary. First, that ES chart shows a clear megaphone that fits in with our premise of a climb back to 2138 around Aug 13.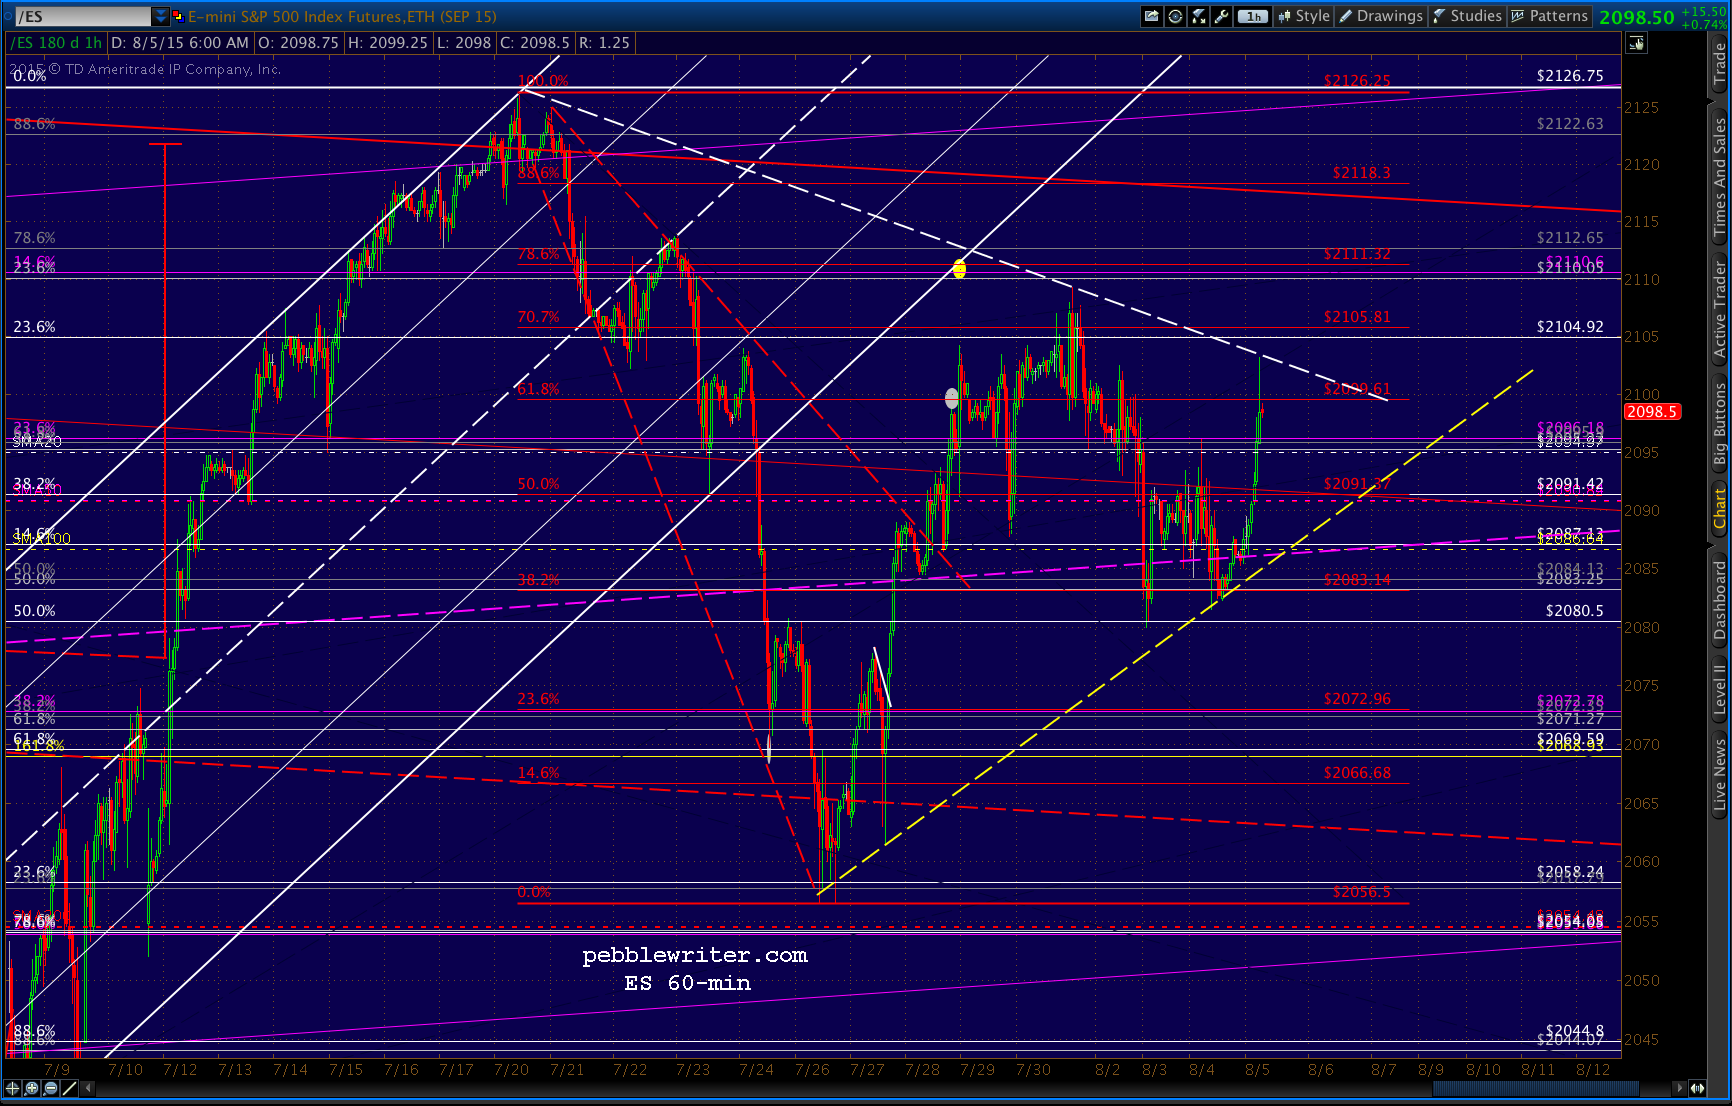 And, the SPX targets we’ve had all week — should bag the .786 at 2117 today (assuming it can break out of the red channel top at 2115ish.) That caveat includes a potential consolidating move just short of the Jul 31 peak at 2114.24 that would mirror yesterday’s stick save just shy of the previous low.
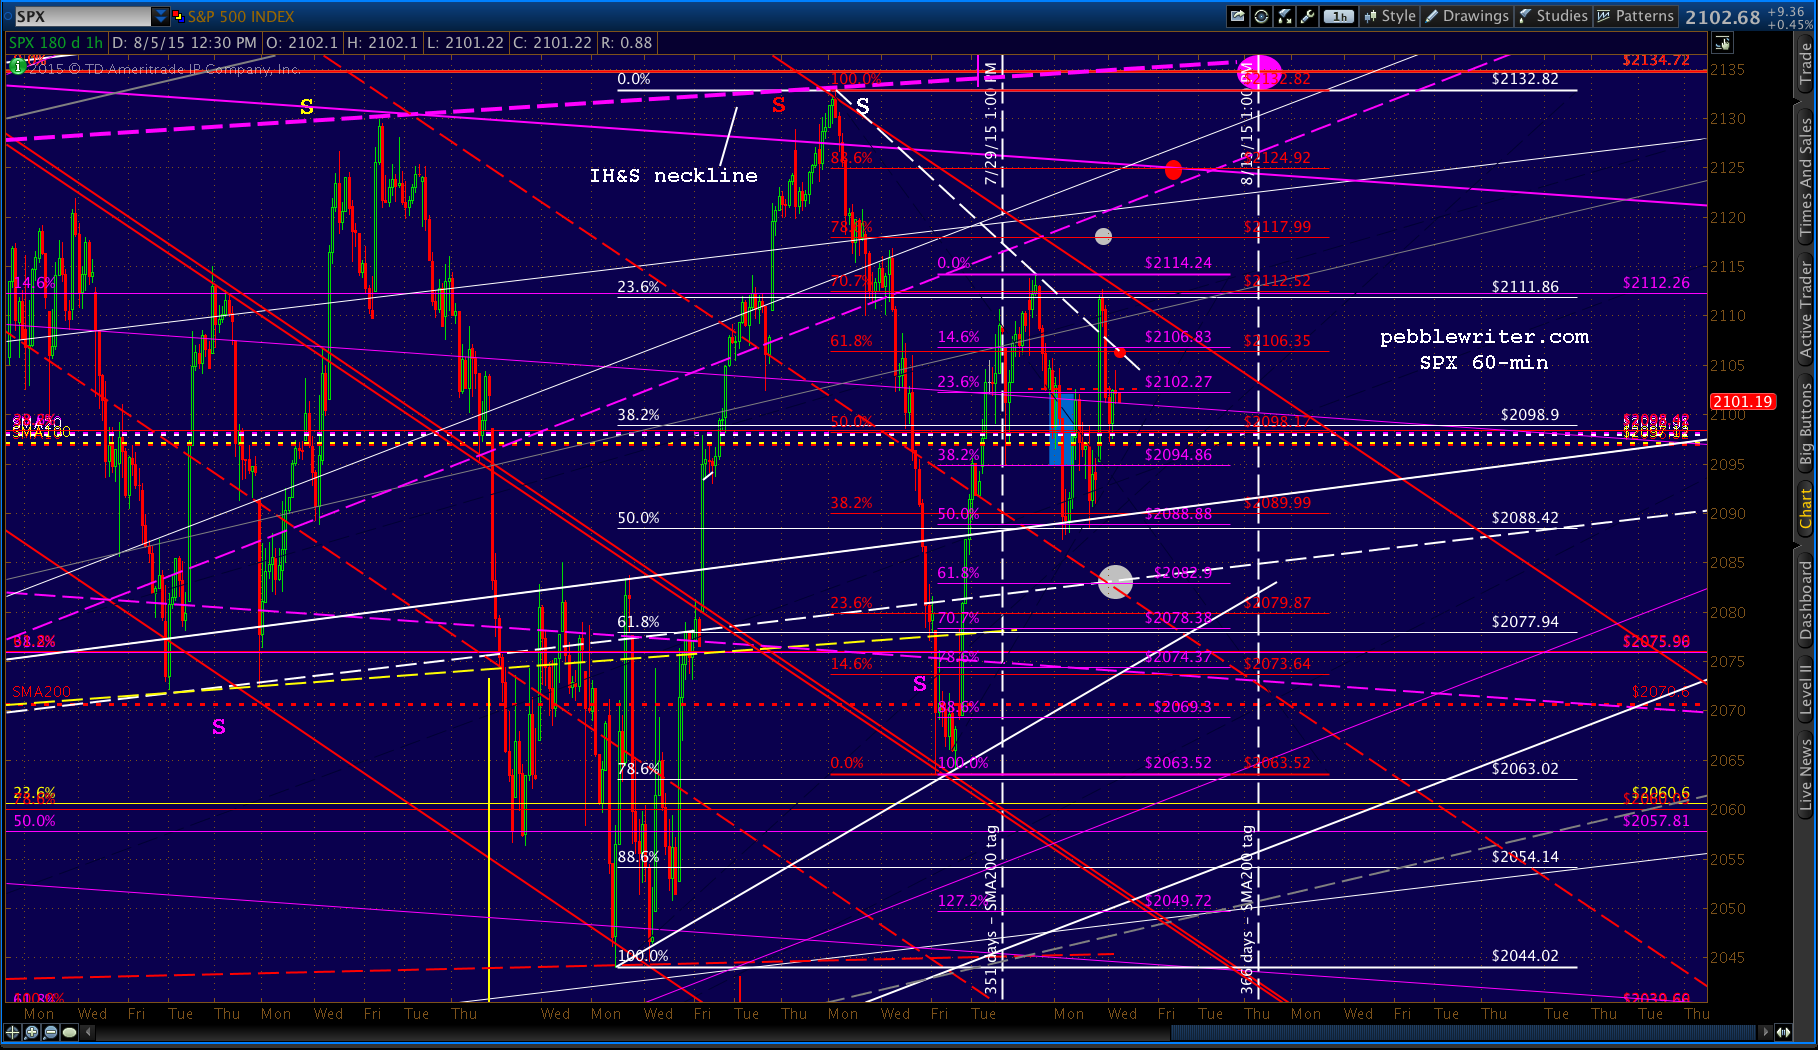
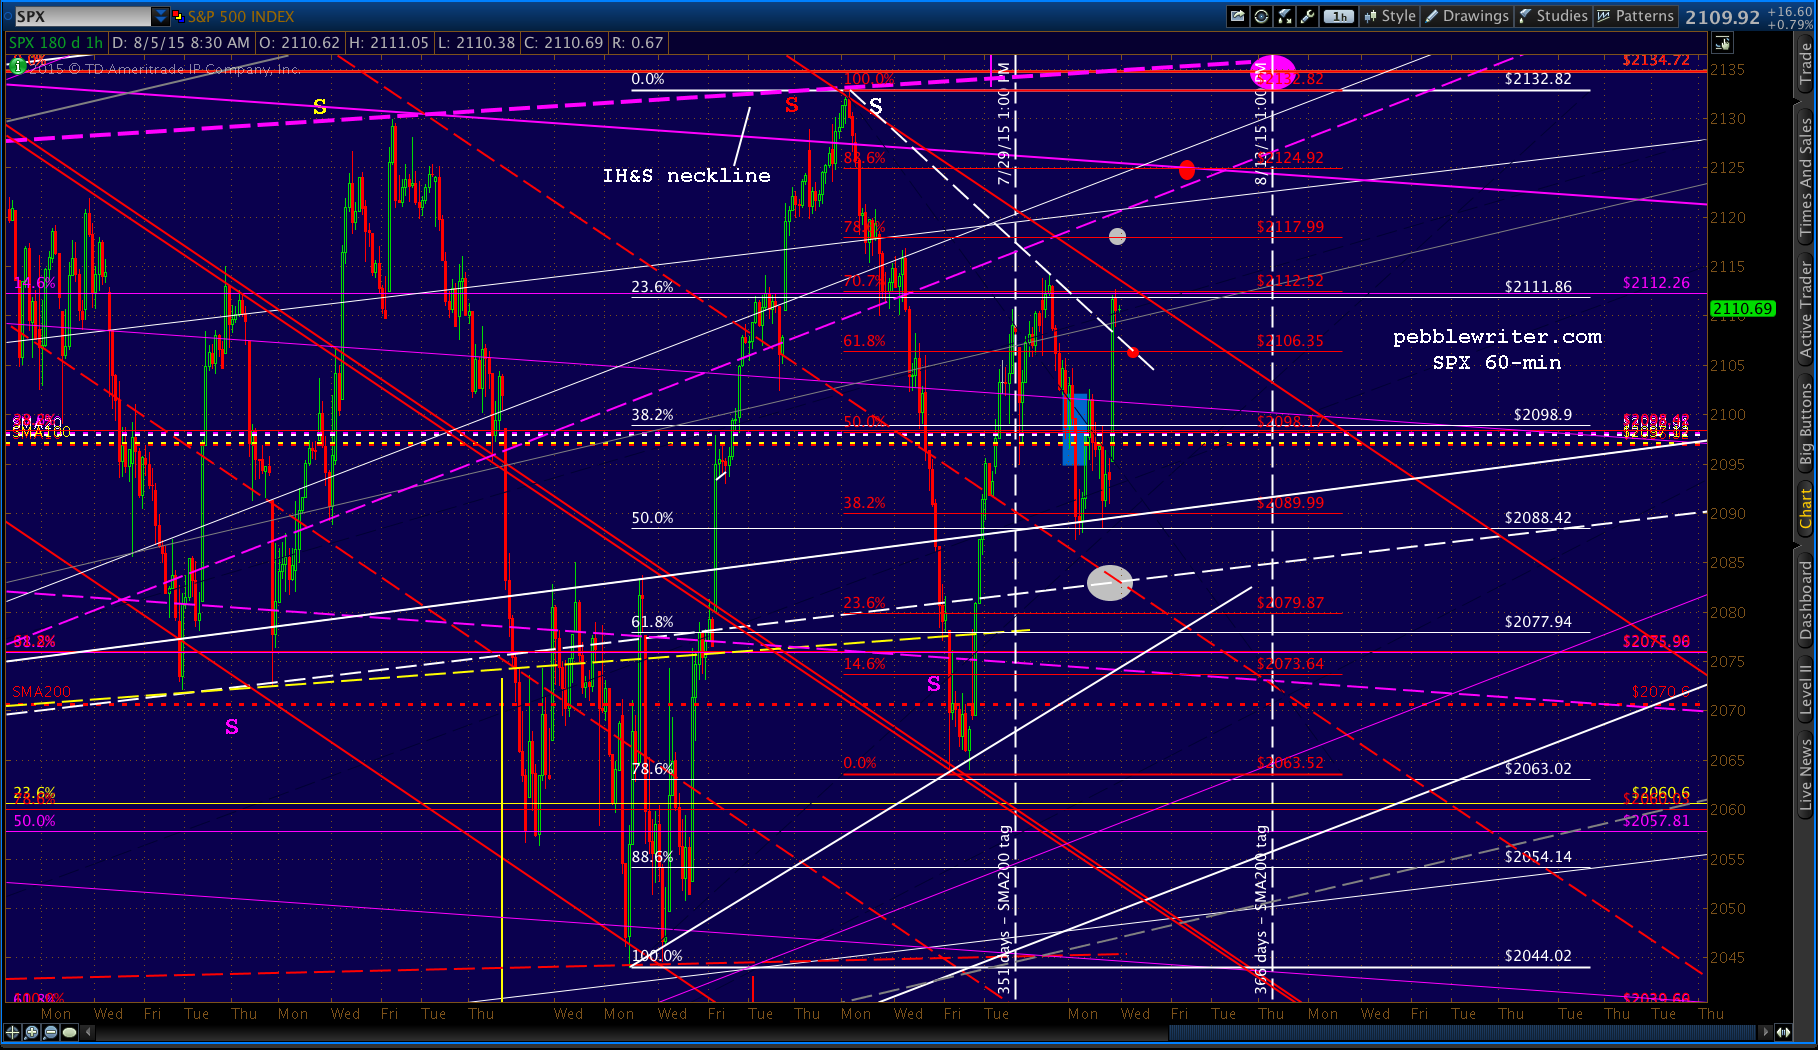
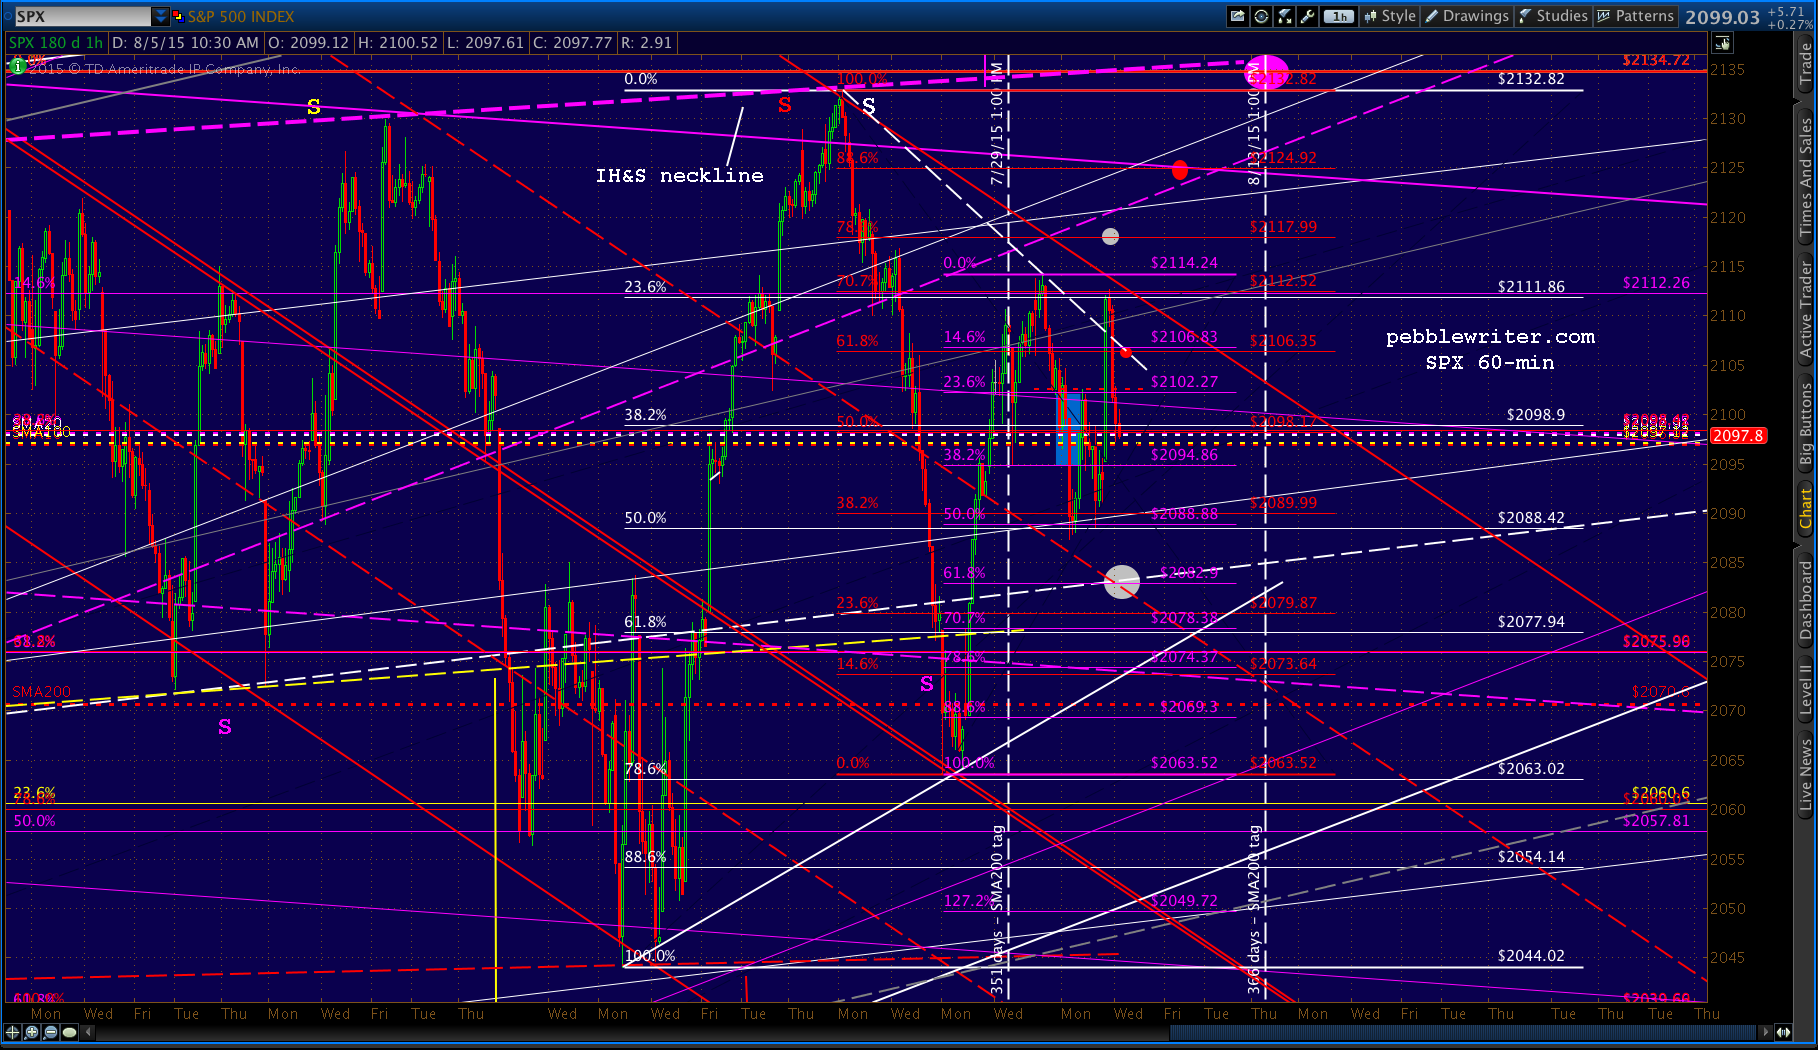
 The 60-min version…
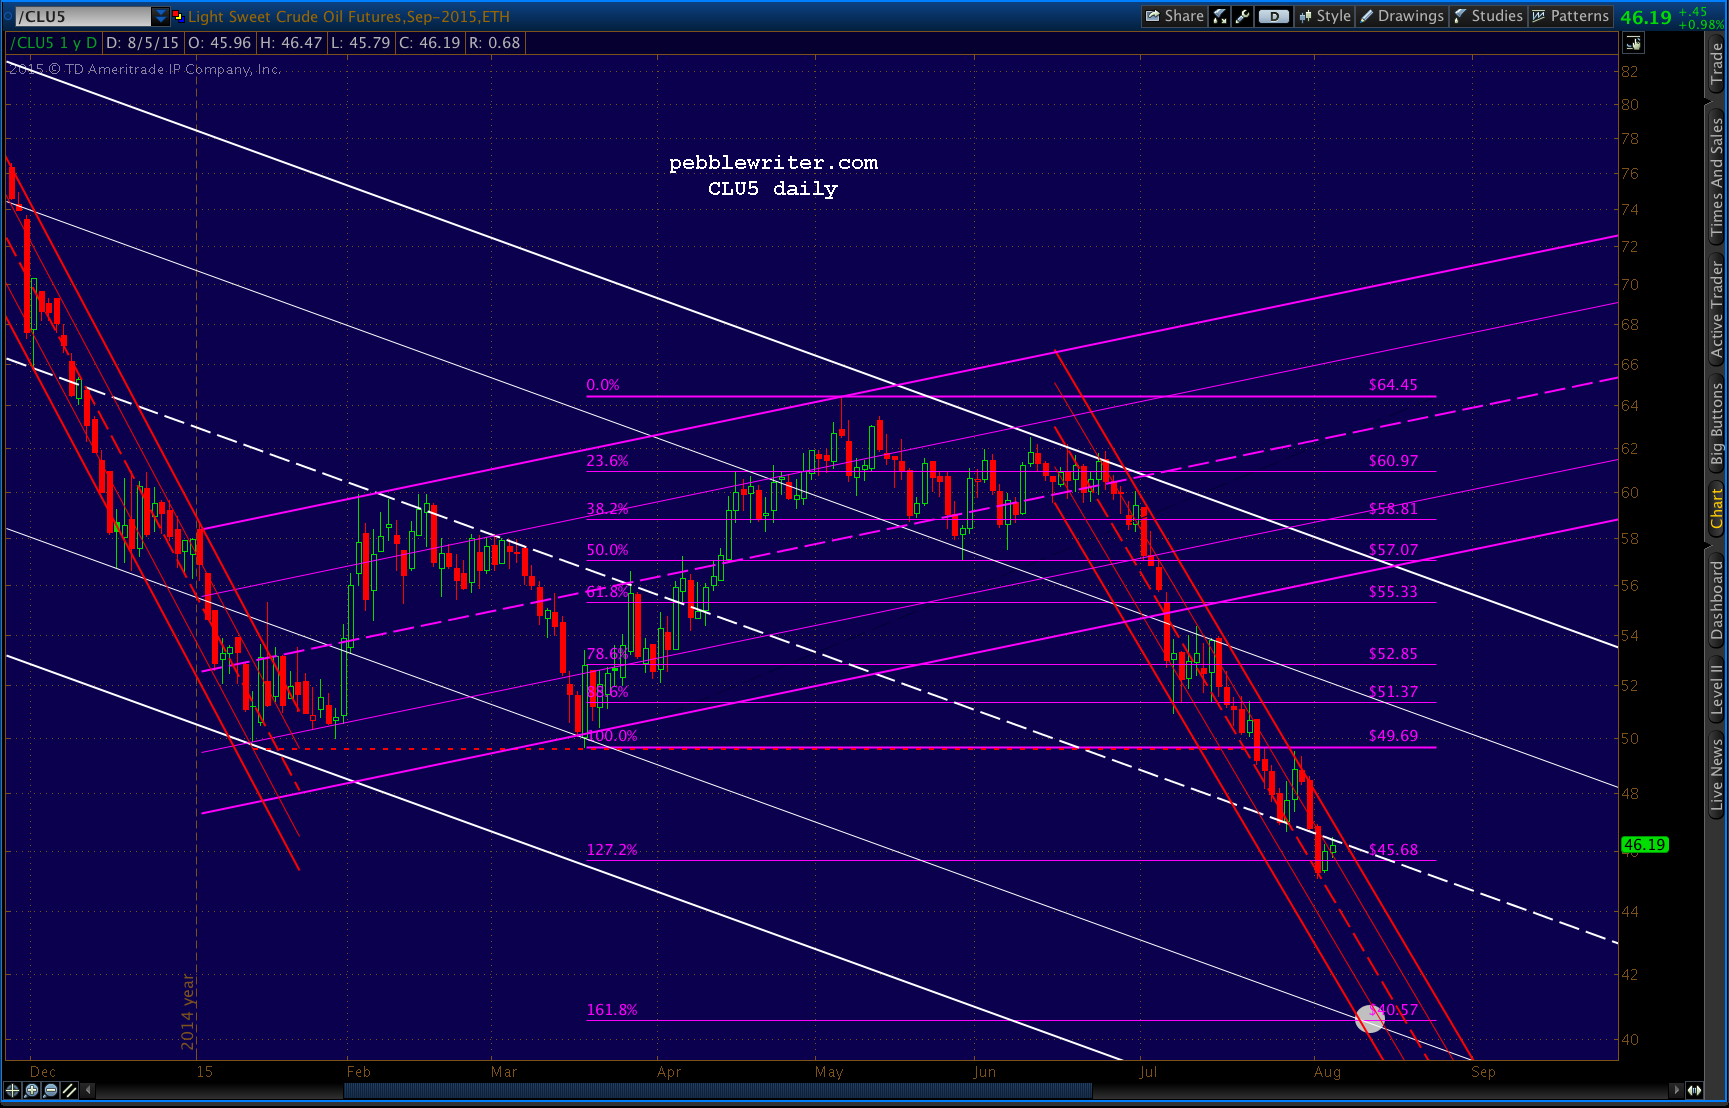
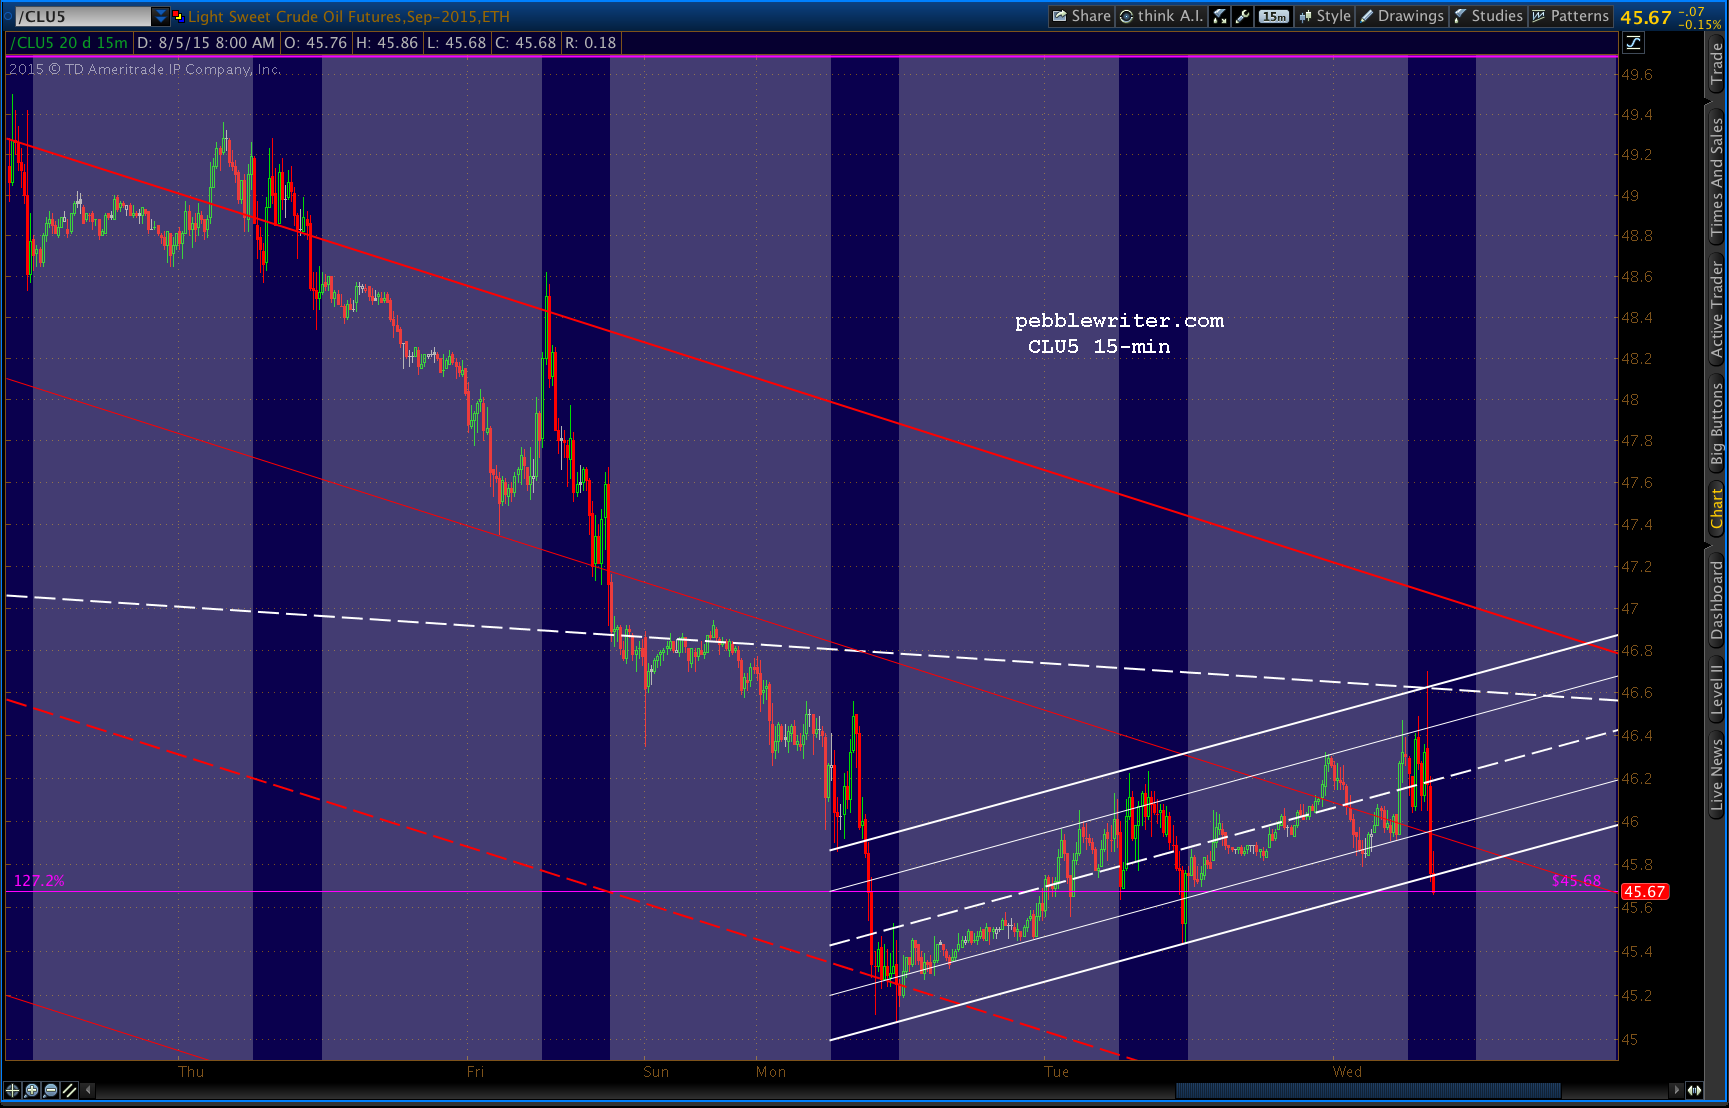
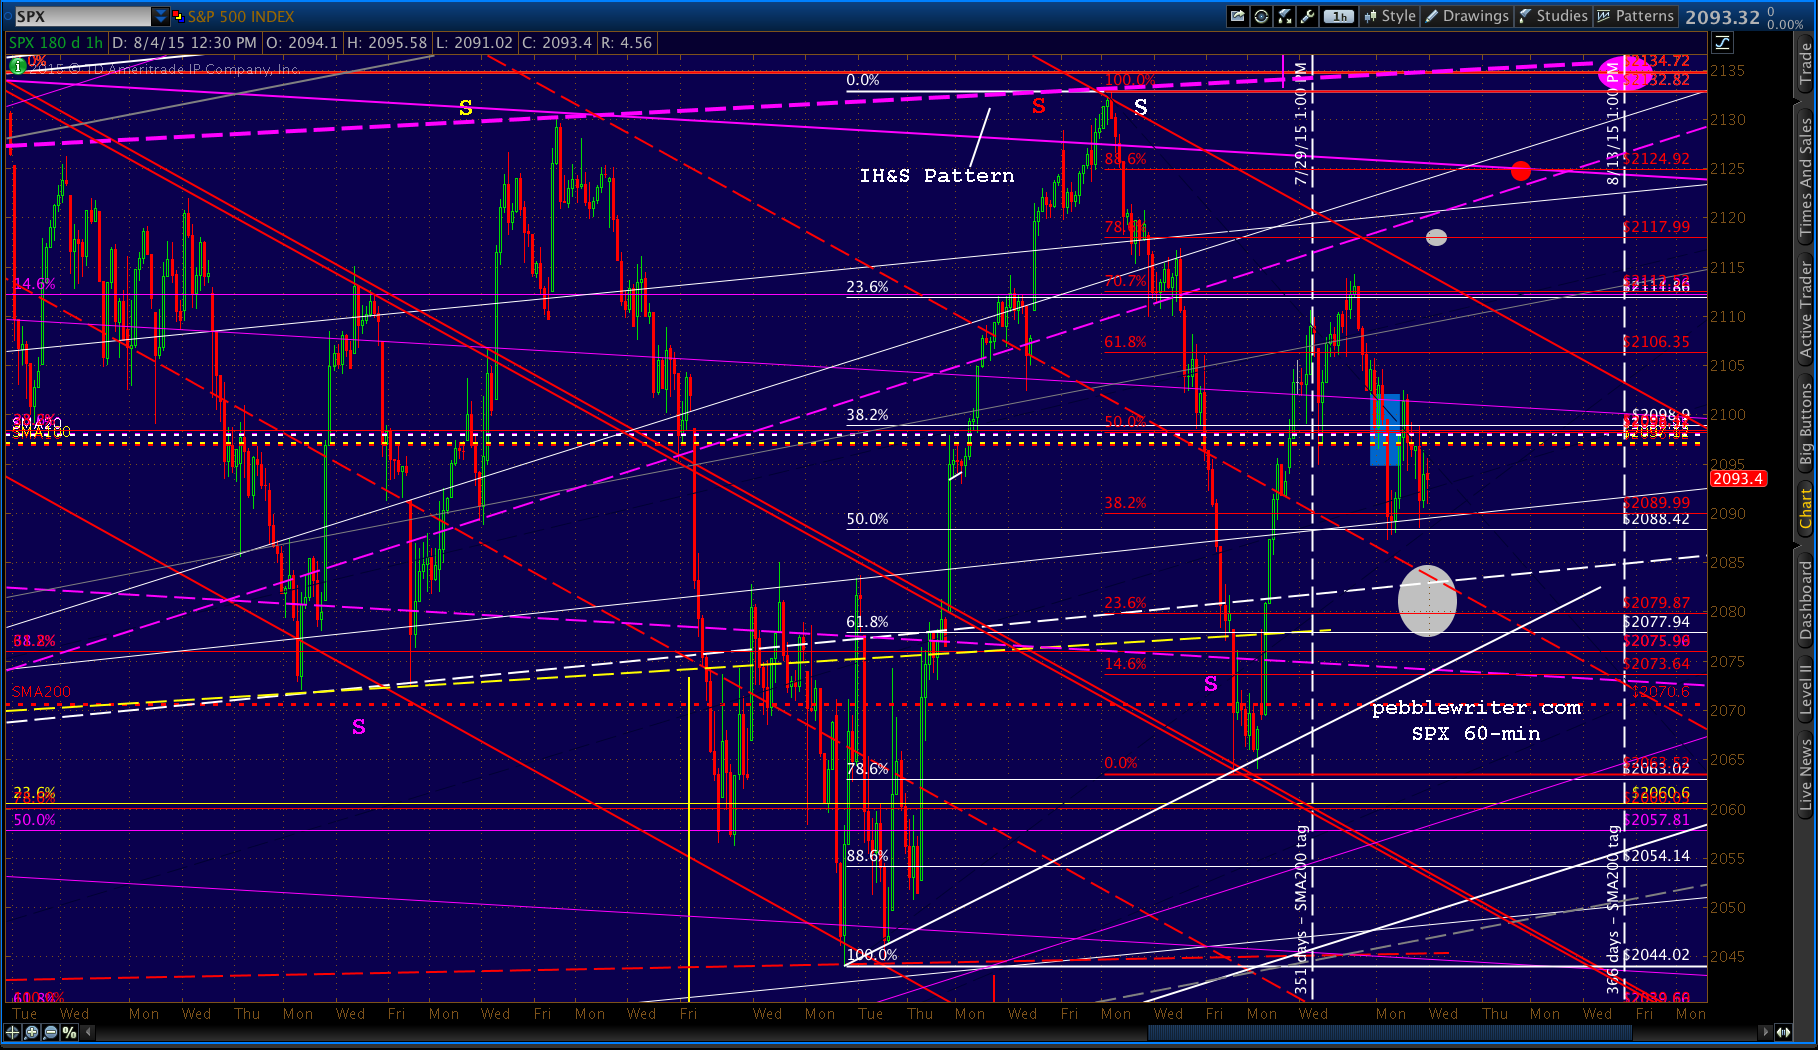 CL is up, but it’s just backtesting the channel midline…
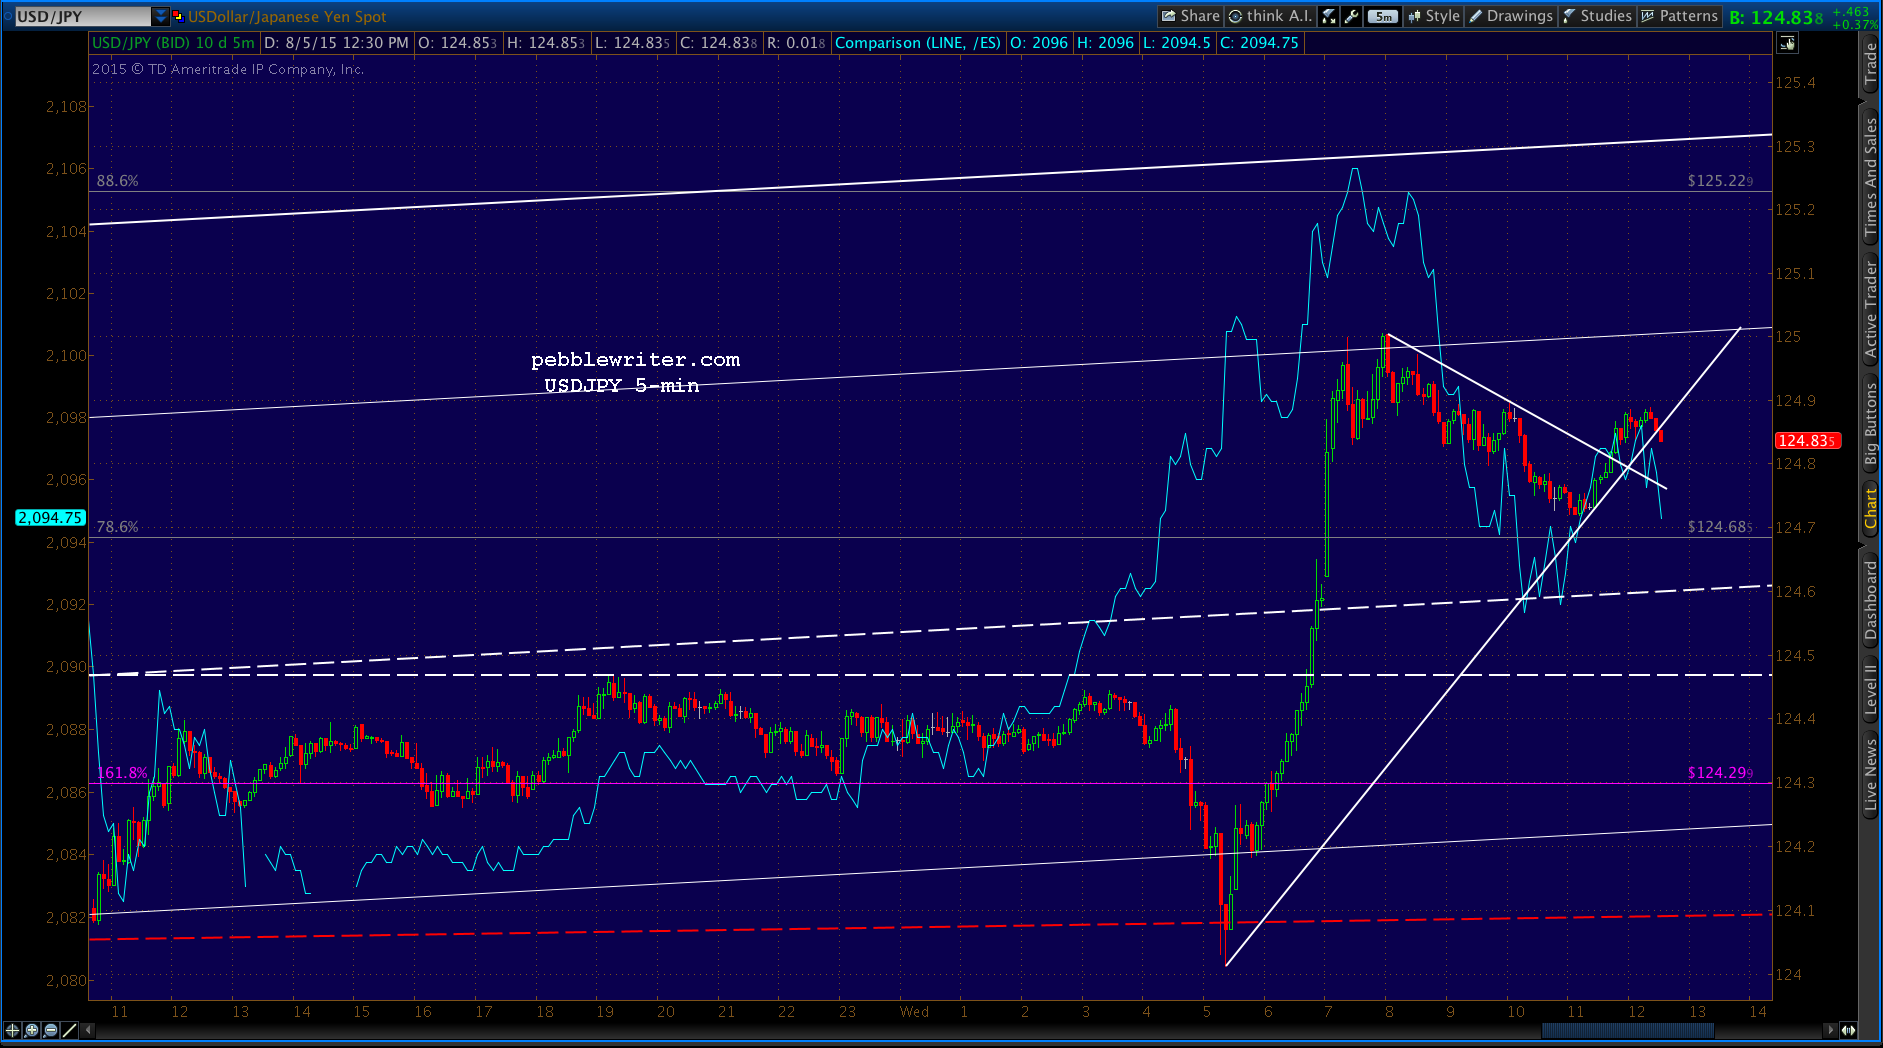
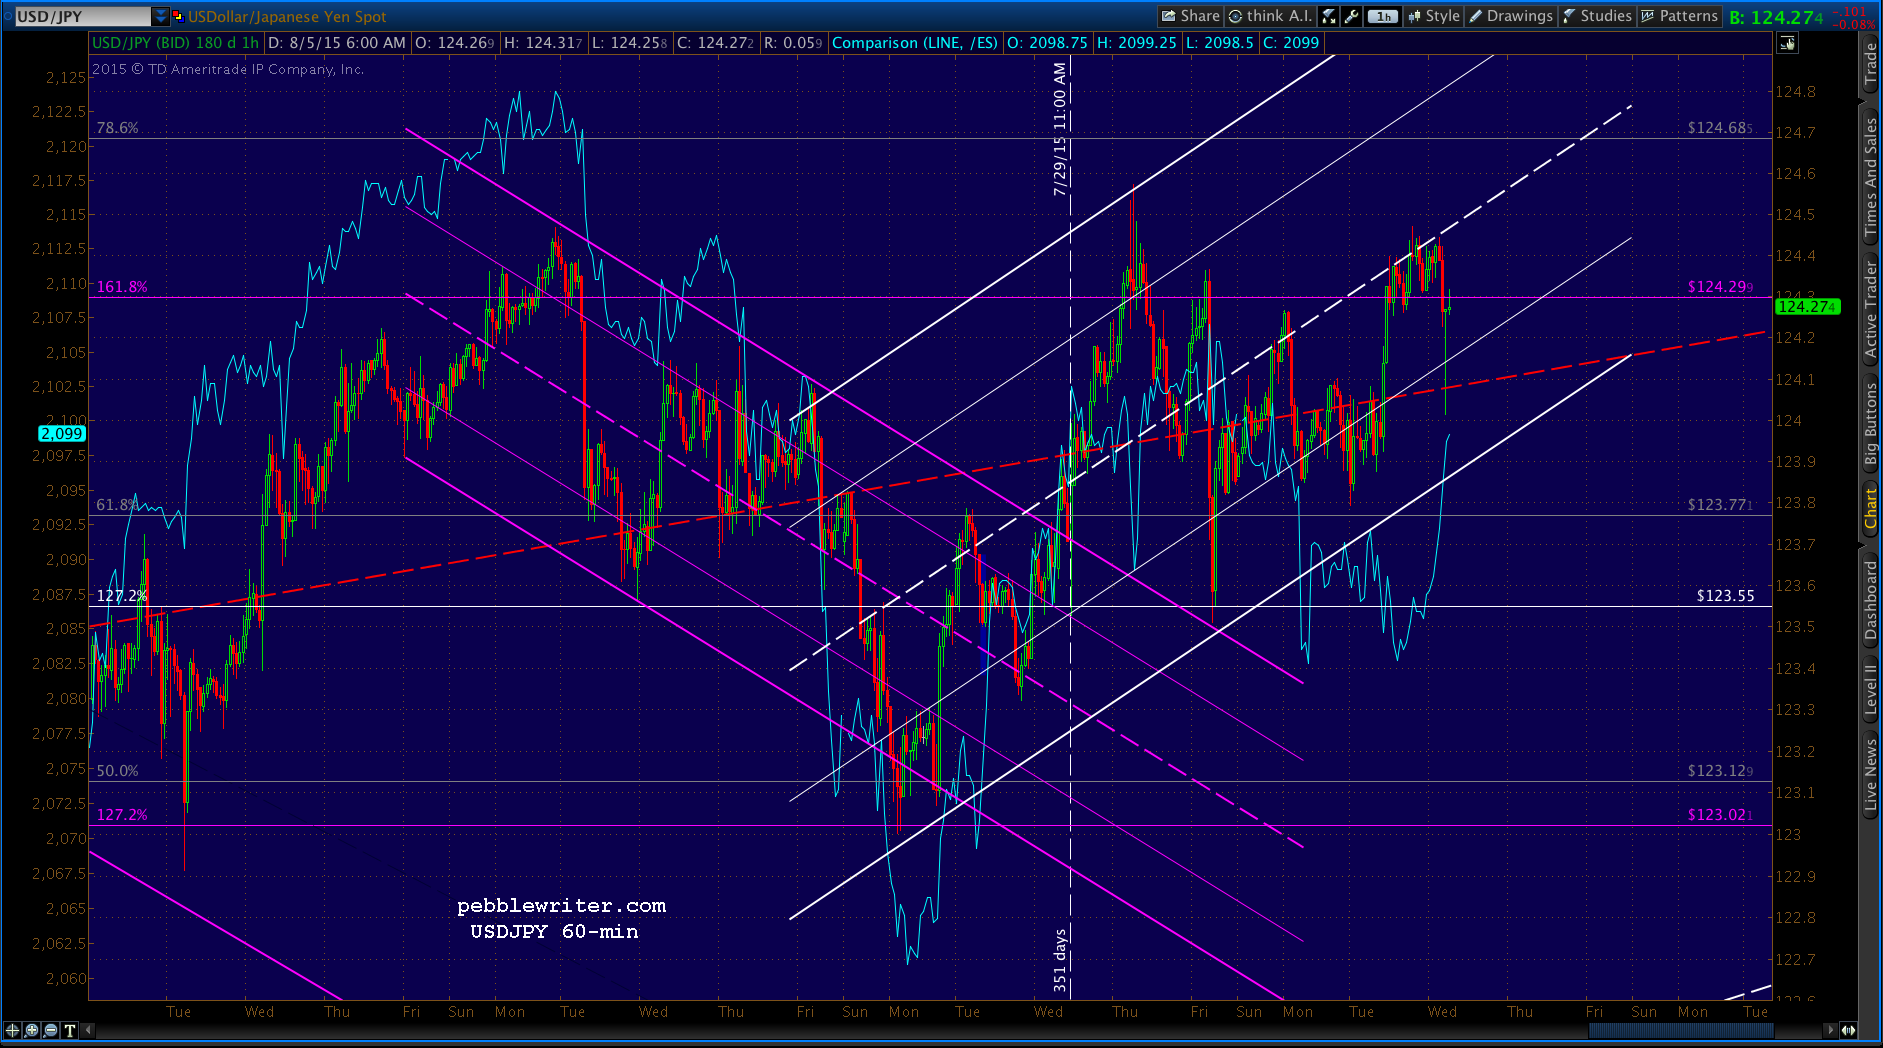
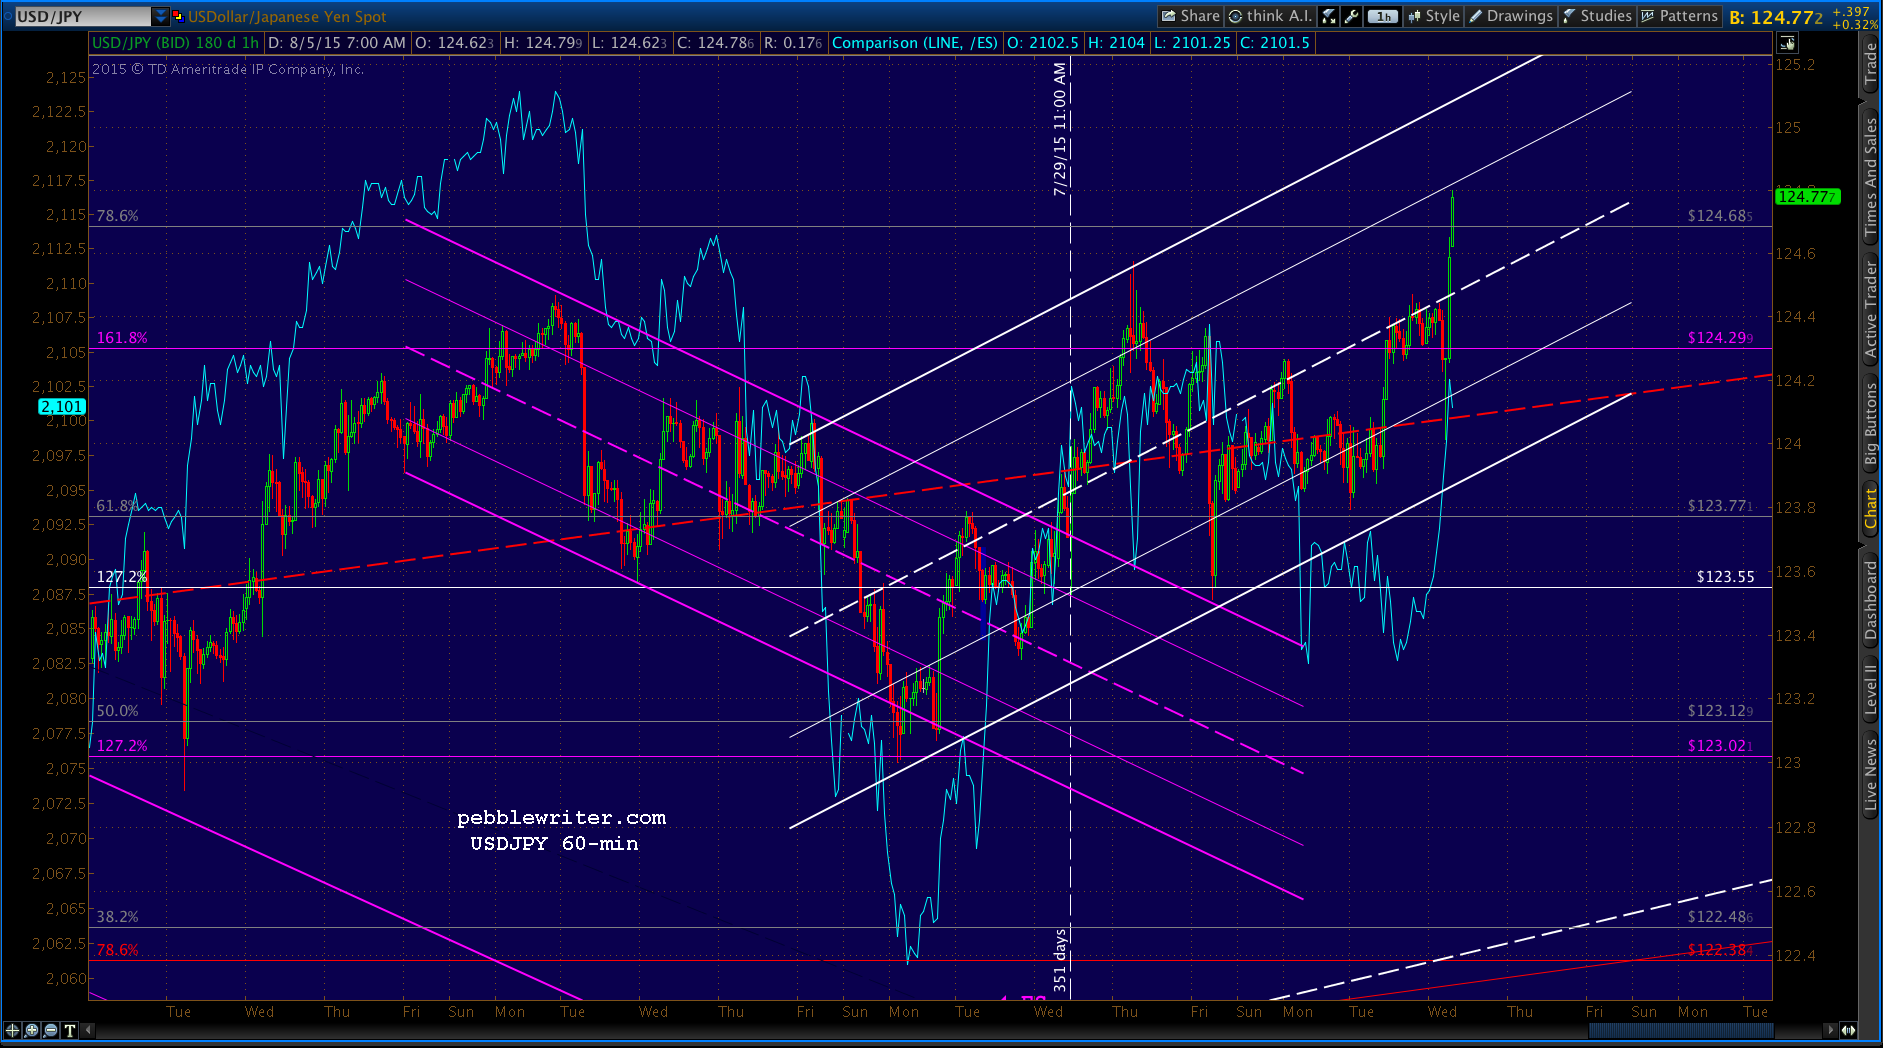
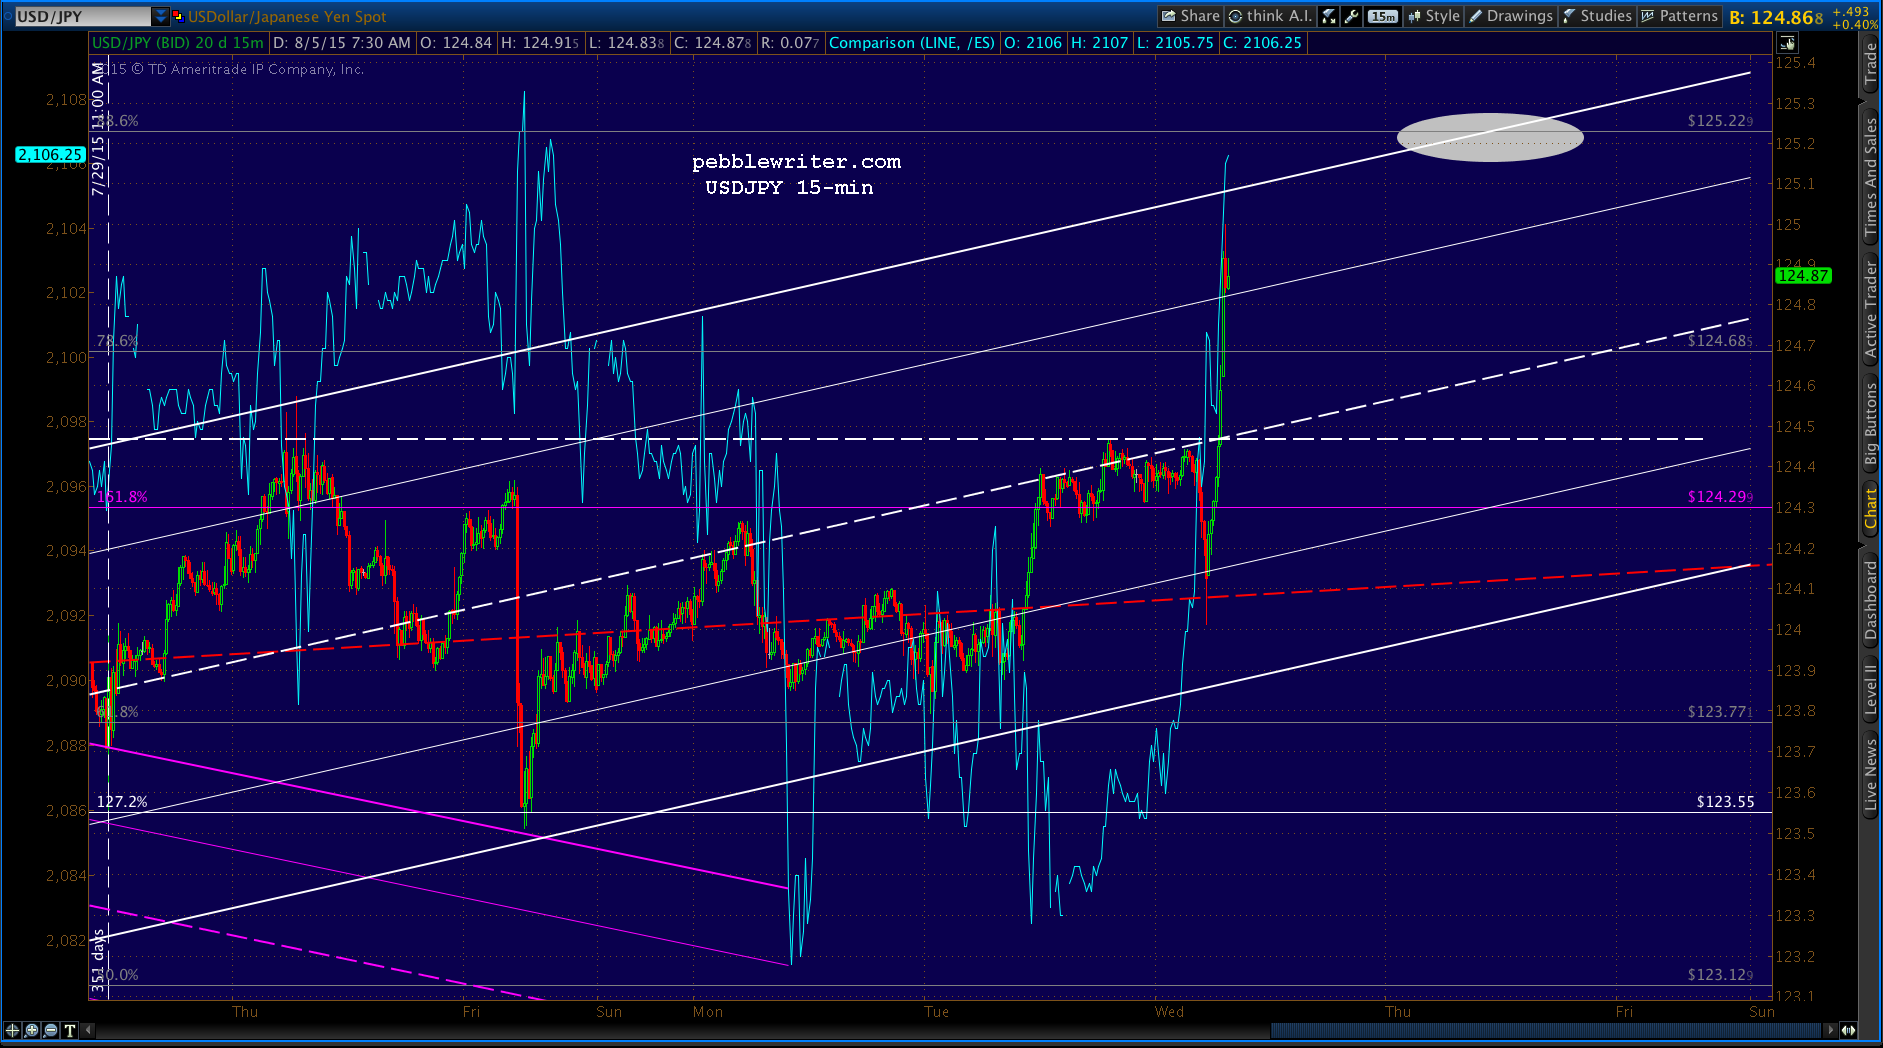
 While, USDJPY is making the opposite, bullish confirming move with a backtest of the red midline.
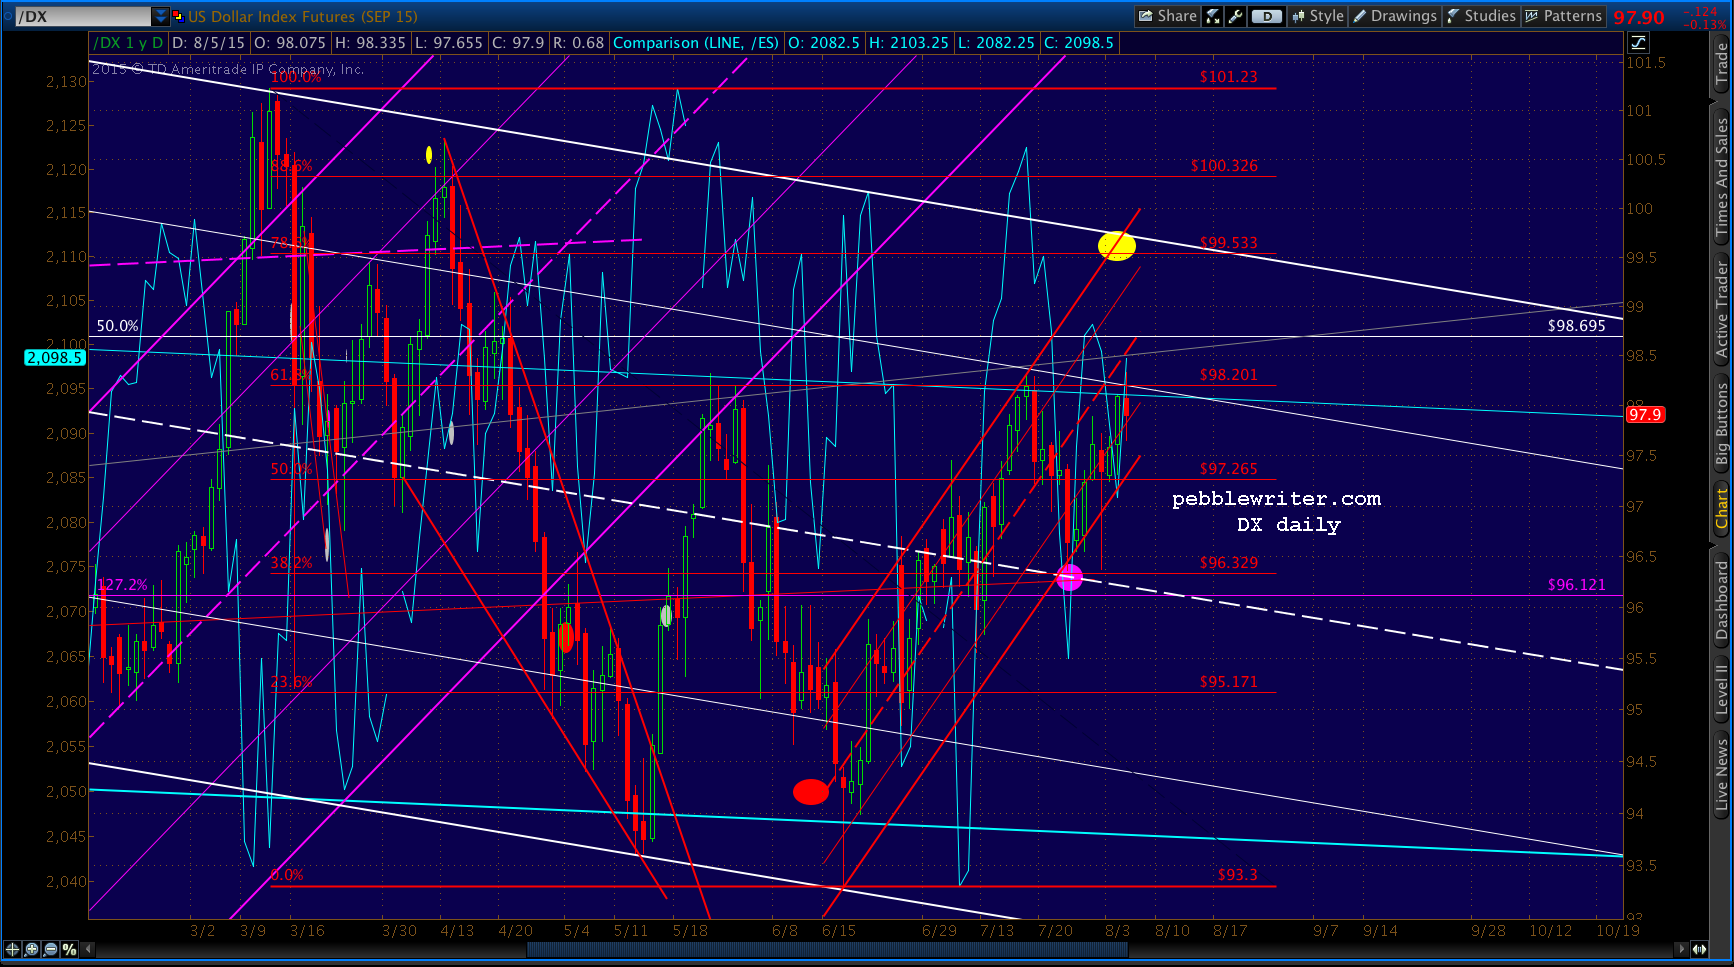
 The dollar is just digesting some of its gains since liftoff on Jul 31.
 Put it all together, and I remain in favor of a pattern of bouncing back and forth up to the vicinity of 2138 on Aug 13 to complete the purple IH&S Pattern, followed by a pullback that lasts just as long as it takes before a central bank action (presumably the BOJ, but could be Fed or ECB) provides additional upside in the form of more QE and/or a weaker yen.
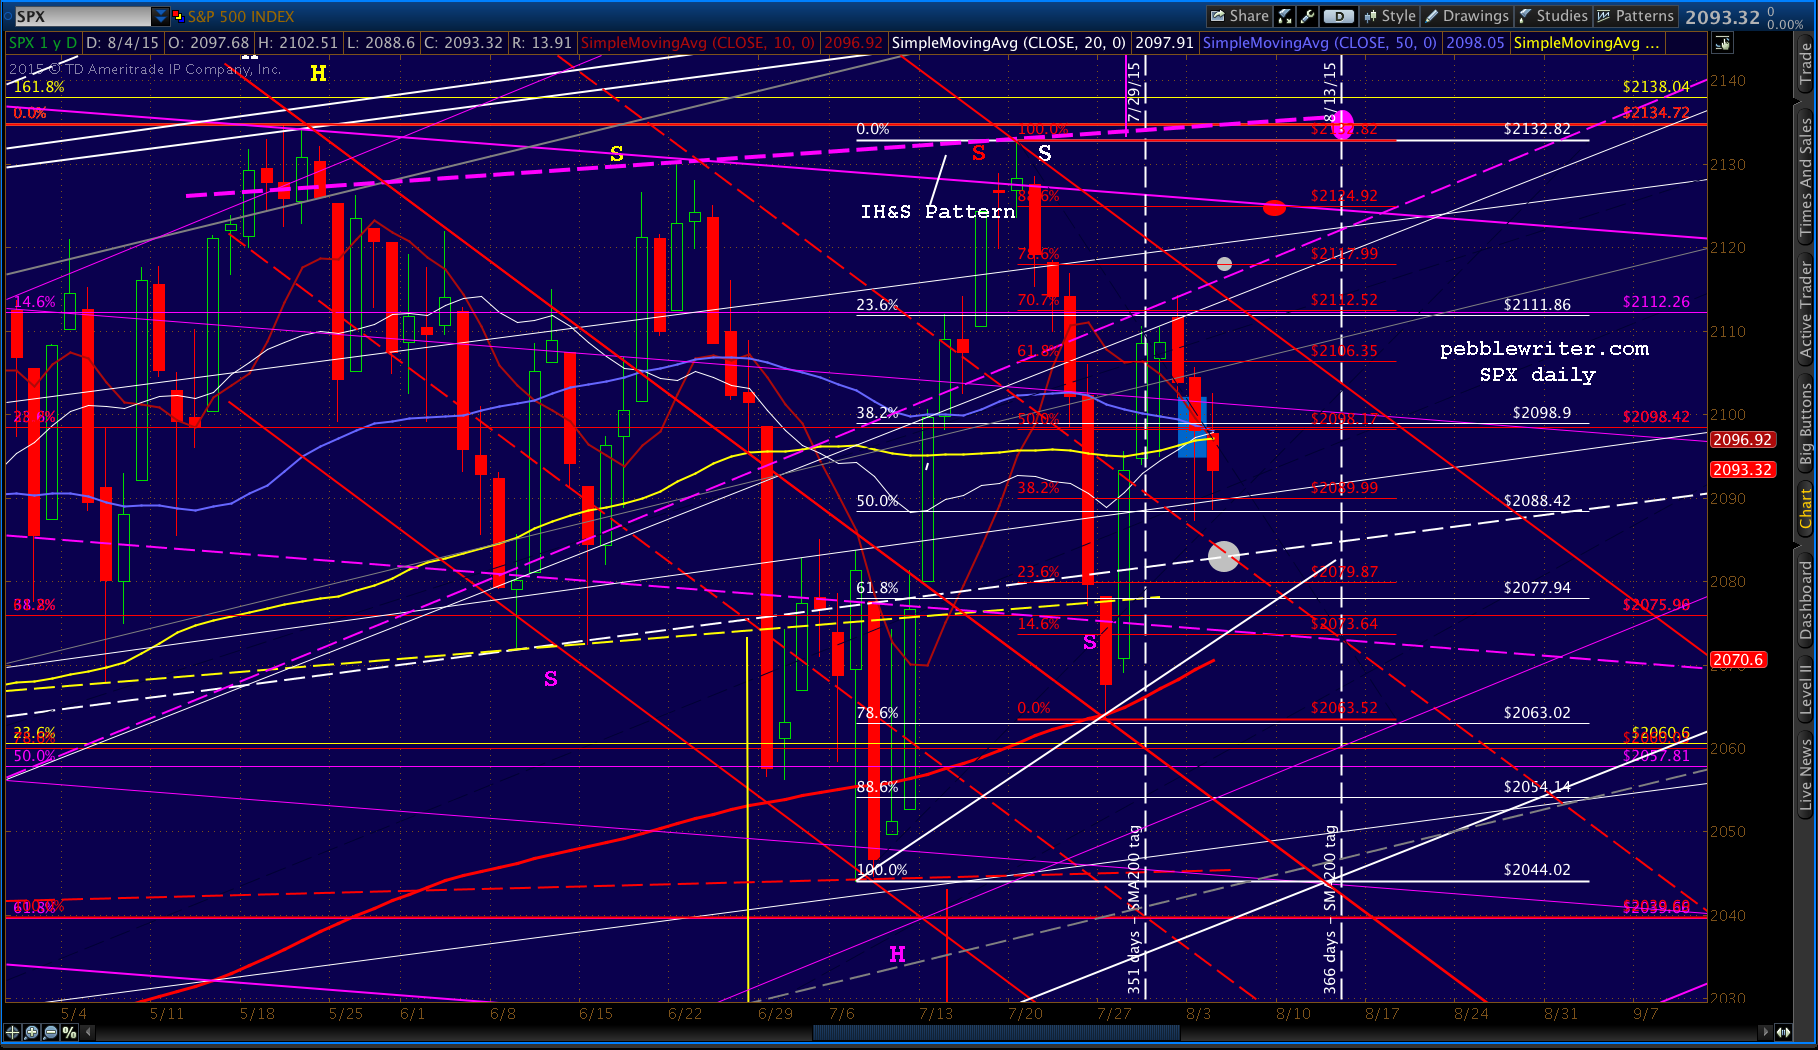
The analog suggests that will occur in October, with Oct 11 being the optimal date. This is our original chart from several months ago.
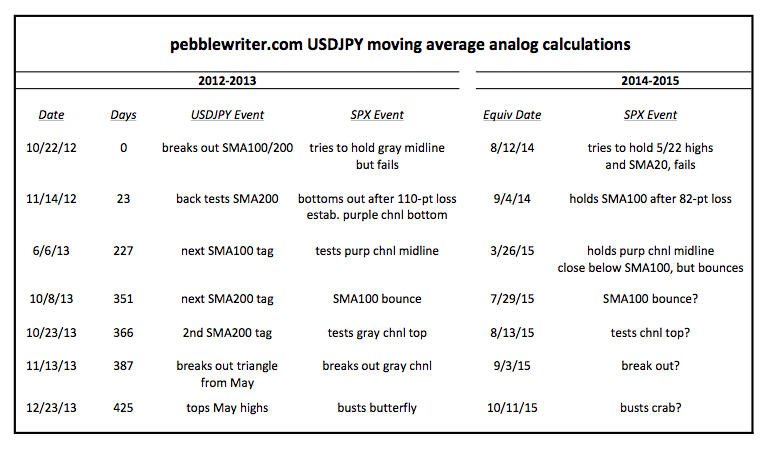 There are plenty of offshoots of that thesis. For instance, a run all the way to 2138 isn’t necessary at this time. It would be enough to get close to a IH&S completion without actually reaching it before falling back. But, this is the primary scenario I anticipate at this time.
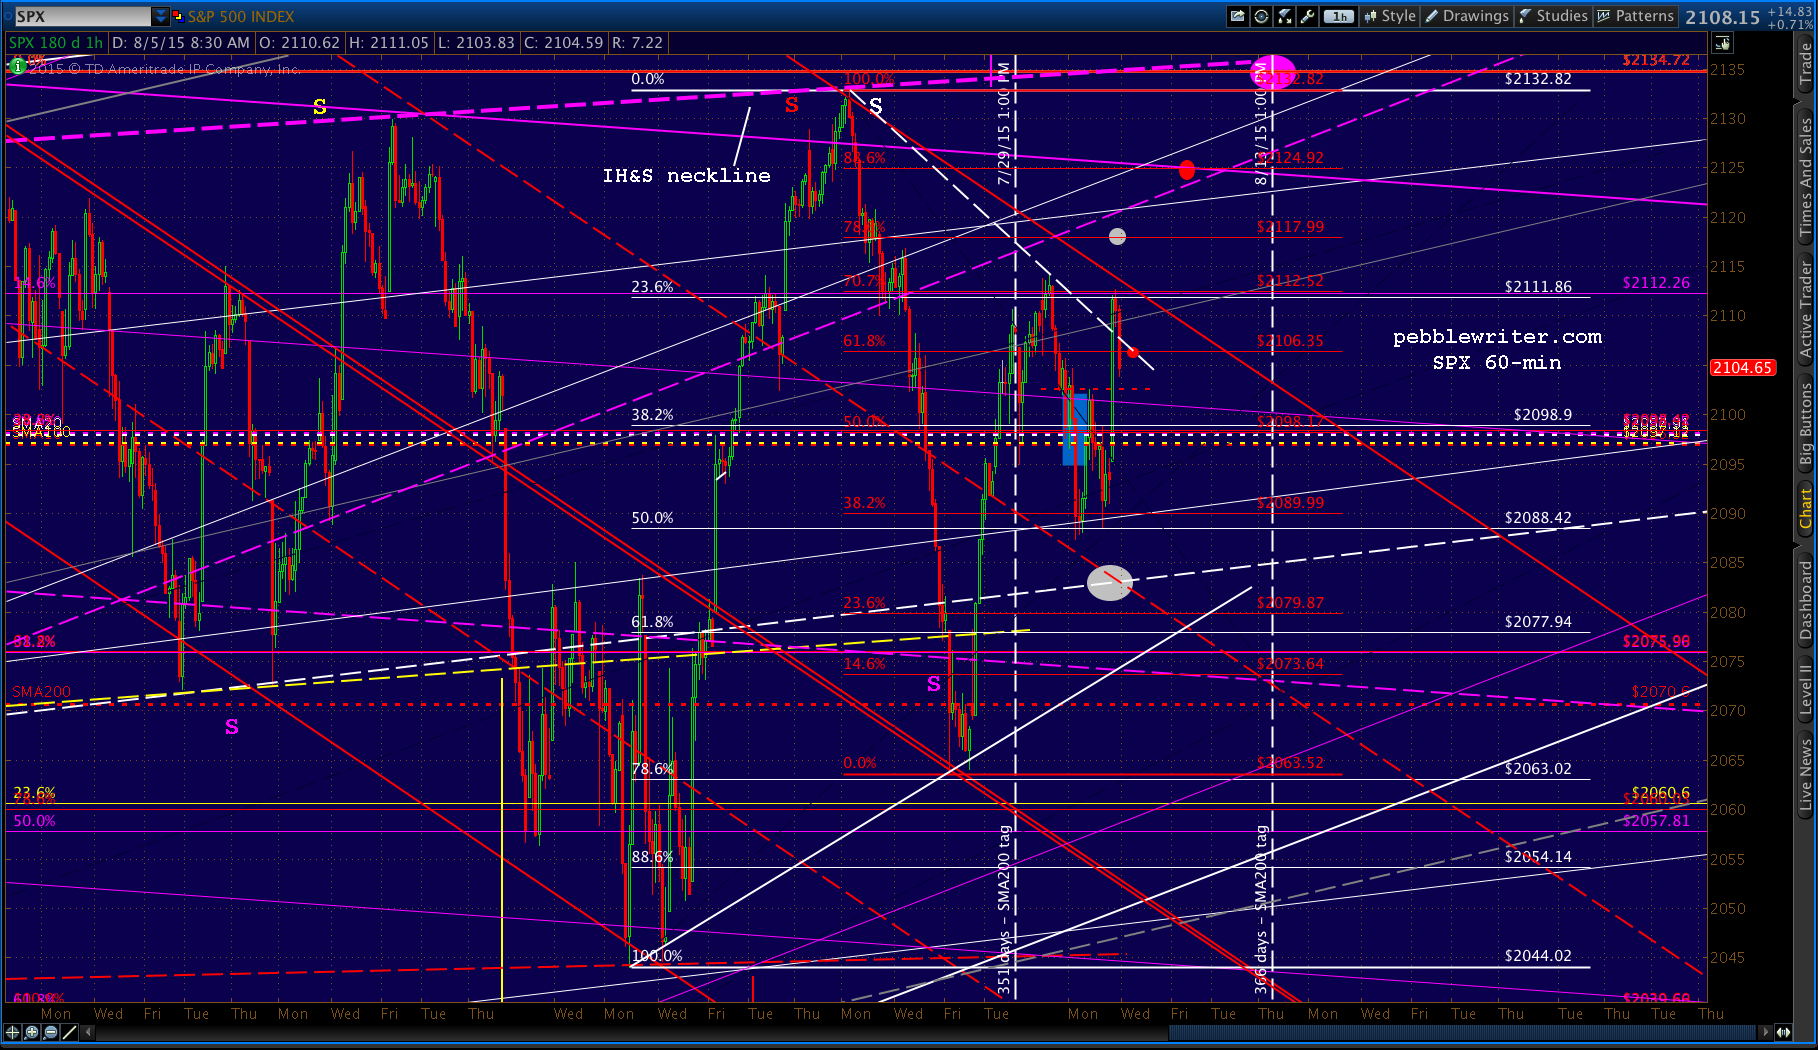
UPDATE: 9:45 AM
SPX just reached its first resistance, the TL off the Jul 20 highs and a gray .787 channel line.
 Watch USDJPY for indications of an impending pullback at 2109.35ish. It’s currently going strong and seems intent on topping last week’s high at least. Perhaps the .786 at 124.68?
 UPDATE: 9:52 AM
 UPDATE: 10:00 AM
File this one under “never say die.” USDJPY refuses to back off, still screaming skyward, now with designs on the gray .886 at 125.22 (with it being more common to come close, without actually reaching a key Fib like that.)
Manage those SPX stops accordingly, as this is probably a move to establish an uptrend in SPX by tagging that .786, or at least topping last week’s highs.
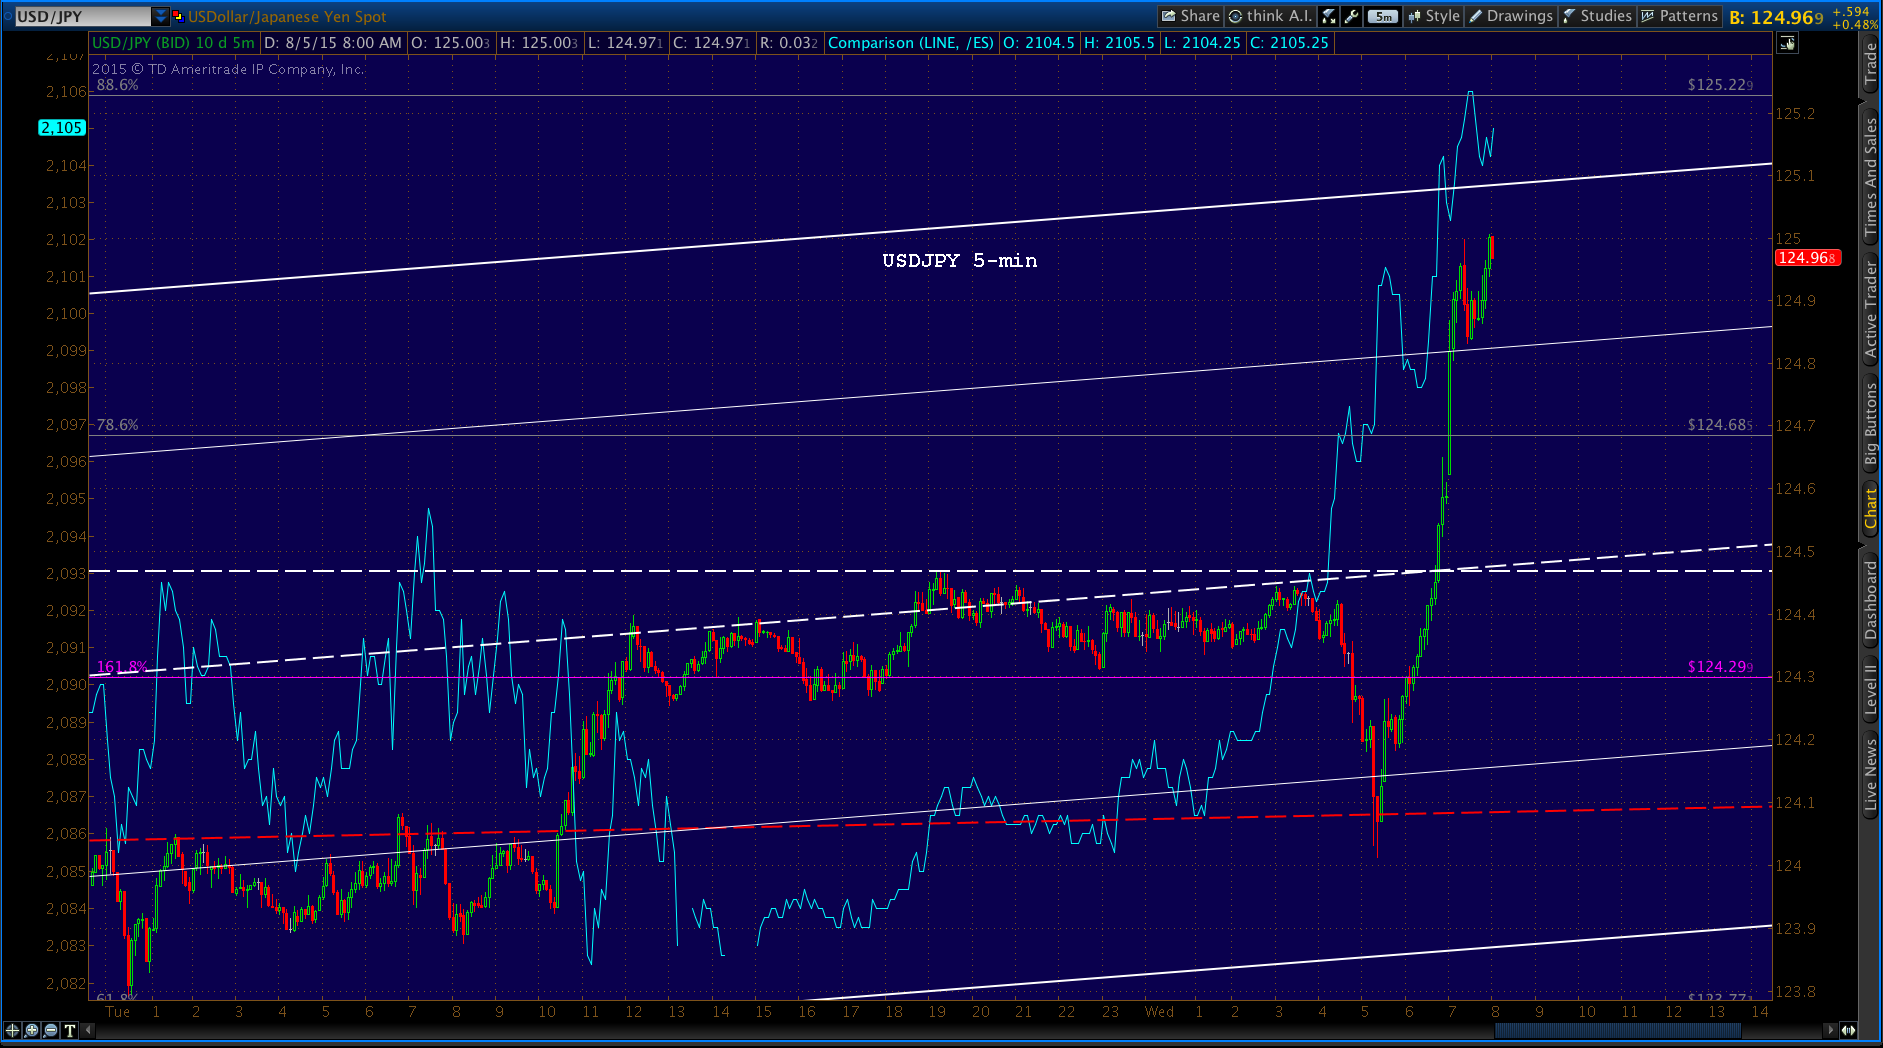
 FWIW, USDJPY has completed an IH&S of its own. Thought, I’ve learned to take H&S patterns in currencies with a grain of salt — especially pairs that are as manipulated as this one.

Just a little heads up for the day traders out there… I have to run out for a while in about an hour so. I’ll try to time it such that it’s not right in the middle of some craziness, but you never know.
UPDATE: 10:35 AM
Little spike and blow-off top for CL here indicates that they’re trying to wrap up SPX’s run (for now.)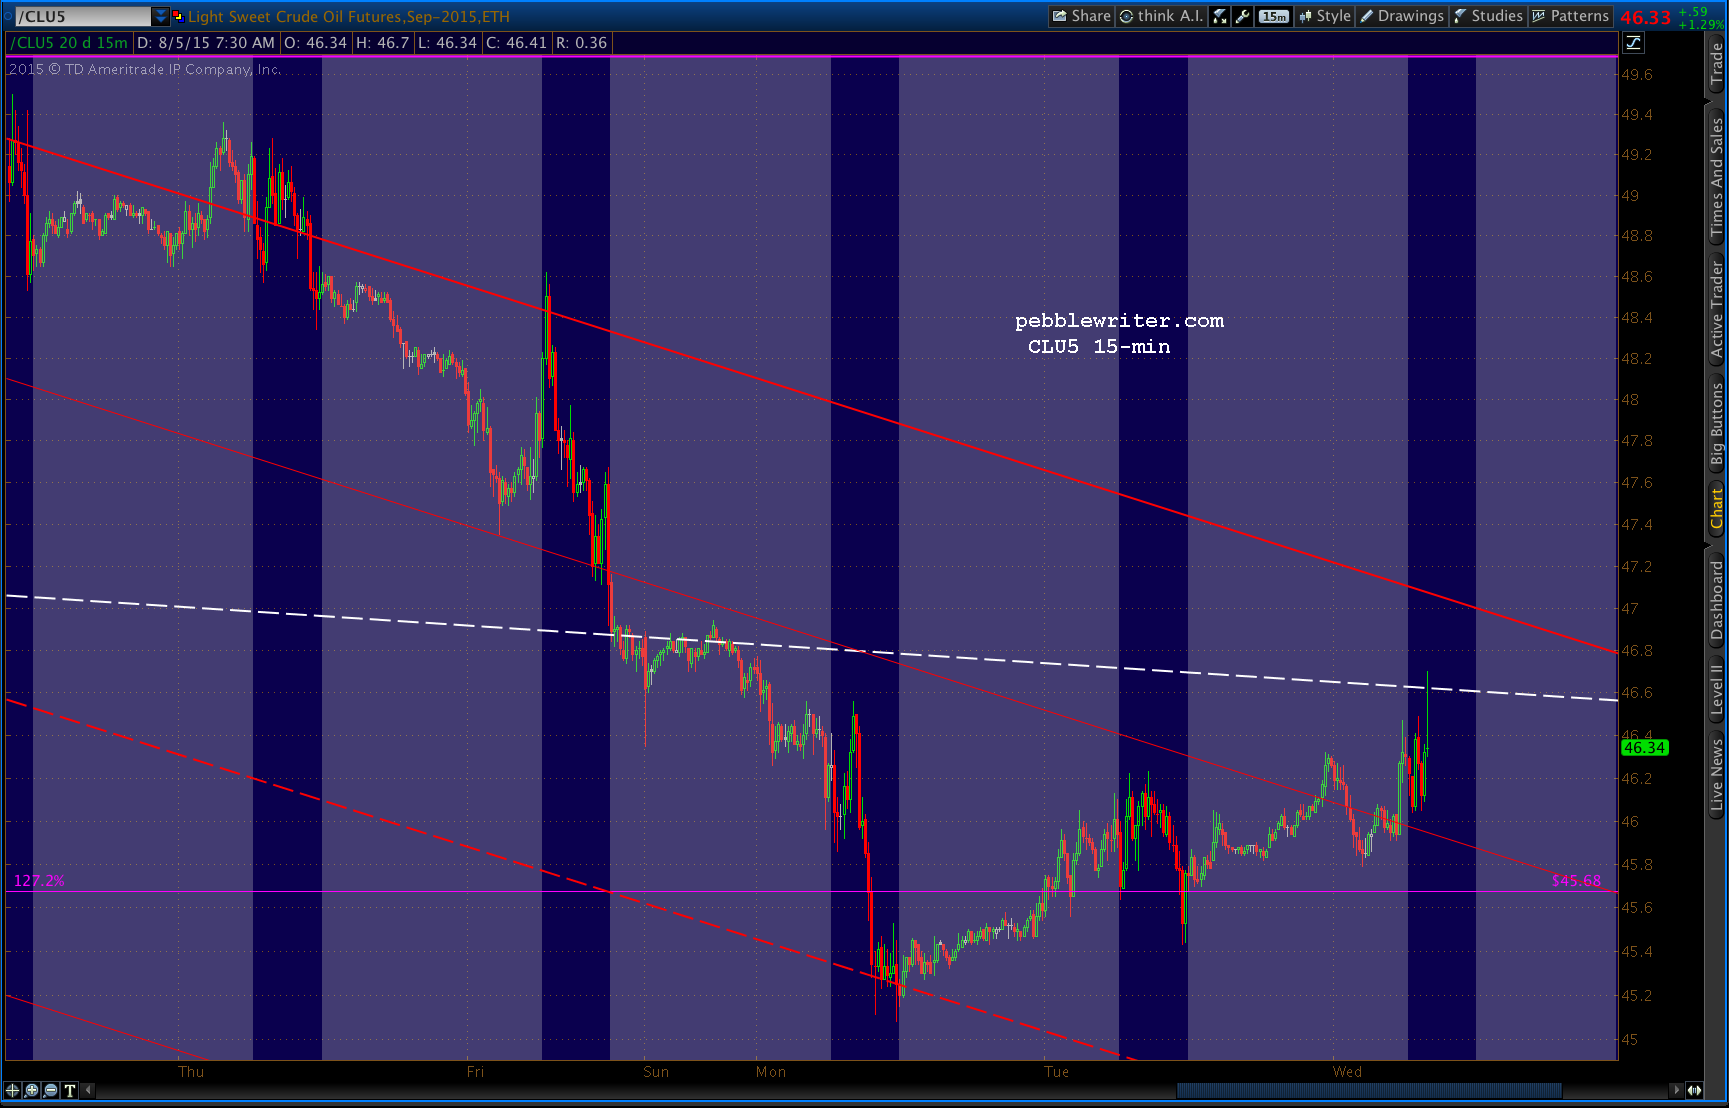 USDJPY has slowed…
 …and SPX is still a little shy of last week’s highs. If they’re going for a consolidation pattern, this is the way to do it.
 UPDATE: 11:02 AM
Trying to read the tea leaves here… USDJPY shot a little higher, so clearly the guys running the yen carry trade machine weren’t satisfied with 2112.66.
 The guys running the CL machine, on the other hand, are trying to get a bigger reversal here.
 Can’t we all just get along!? SPX’s pullback only reached 2109.58 so far, so I’m assuming there’s more to come. The .618 at 2106.35 would make for a nice, bullish backtest.
 I’d continue to keep an eye on CL and USDJPY. When they suddenly spike higher for no reason and CL regains that rising white channel, it’s time to get long again.
UPDATE: 11:33 AM
Things seem to have calmed down a bit, so I’m going to duck out for an hour or so. Best guess at this point is a backtest of the red .618 (2106.35) where it intersects with the white TL at 3:30 ET or so. If the .618 doesn’t hold, I’d look hard at the EW target (< 2102.51) and then the SMAs.
Note: the EW targets very often hold sway when there are bullish implications. But, the algos LOVE to catch EW traders taking positions on wave patterns and then blowing them out.
 And, for those with no interest in all these 5-10 pt bounces, keep your eye on a tag of 2134-2138 around next Thursday/Friday.
UPDATE: 12:05 PM
Got delayed a bit. Now I’m leaving. But, not before pointing out that the EW-friendly scenario seems to be unfolding. CL’s flag pattern is done…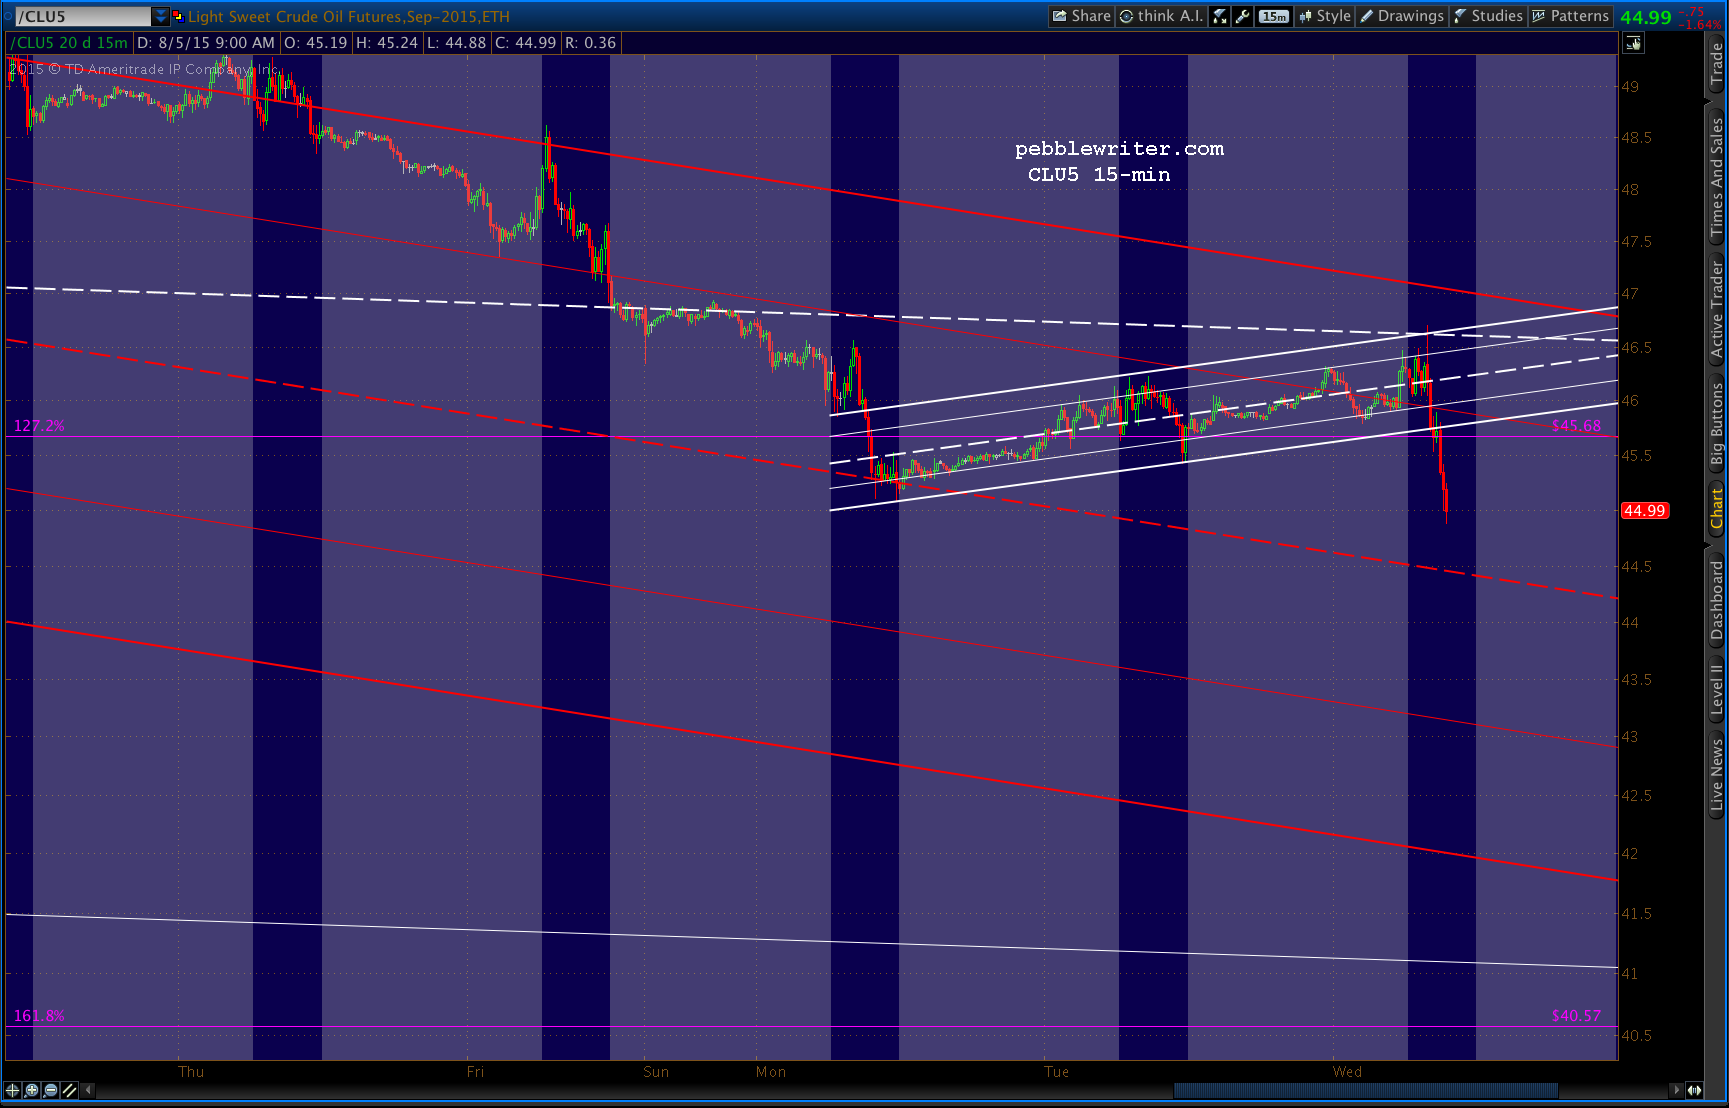 …but, USDJPY has found channel line support.
 UPDATE: 1:55 PM
 UPDATE: 3:32 PM
Probably a head-fake, but USDJPY just lost TL support on the 5 min chart, which if it holds, means no ramp job into the close.