


When we first noticed the similarities between recurring instances of USDJPY levitation over the past 4 years, we set about discovering the pattern that would ultimately signal the next breakout.
Sure, it could signal a breakdown, but central bankers have essentially outlawed those — in both words and in deeds.
Every instance involved USDJPY being either supported (by a trendline, a channel, a key Fibonacci level) or breaking out of a seemingly bearish predicament. In either case, a strong rally in USDJPY always drove stocks higher — without exception.
In fact, it’s fair to say (which we do, quite often) that the yen carry trade has been the single most powerful force behind stocks’ unending rally since 2011 [see: The Yen Carry Trade Explained.] This chart from May depicts the cozy relationship, alongside several key technical milestones.
 Yet, the trashing of the yen isn’t without consequences. Every time the BOJ bashes the yen (boosting USDJPY), it increases the cost of just about everything Japan must import. The budgets of beleaguered Japanese consumers and importers alike are nudged that much closer to the breaking point.
Fortunately, The Powers That Be aren’t entirely heartless. It remains our thesis that they engineered the oil crash chiefly to enable the Japanese to afford to keep depreciating the yen in the face of soaring oil prices [see: Those Wacky Central Bankers.] Naturally, this kept the carry trade alive (a coincidence, no doubt.)
One might even regard the latest leg down in oil prices as paving the way for a cheaper yen — an bribe enticement, so to speak, to the Bank of Japan. If that wasn’t enticement enough, China — Japan’s biggest trading partner — just devalued the yuan by about 2% today. [see: China Joins the Party.]
 But, as much as the BOJ enjoys helping the Fed, the ECB, the BOE and the SNB with their Keynesian ambitions, they have a market of their own to prop up. As we correctly anticipated on July 8 [see: Update on Nikkei] the sharp drop in NKD panicked the BOJ.
Before the USDJPY had even reached its 100-day moving average, they sent it soaring. It had rallied by over 4% as of this morning. It was enough to push the Nikkei 9.3% higher (and SPX +4.3%) over the same period. It was quite an accomplishment — which is now in danger of coming undone. Or is it?
 Note that the 6% drop back on July 8 stopped precisely on a trend line that also connects the April 1 and May 7 lows. It’s hard to know the exact timing, but a further decline to about 19,240 (-5%) would complete a huge Head & Shoulders Pattern that targets 17,275 — nearly 15% below current prices. Think that might prompt a little panicking?
Our March 27 analog predicted a denouement of some sort on Aug 13. Certainly a meltdown in NKD of that caliber would do the trick. It’s safe to say that US stocks would also be affected.
The S&P 500 has been the beneficiary of one after another central bank gimmick over the last 10 months since Fed President Jim Bullard halted the mid-October 2014 meltdown with a comment on Bloomberg that QE4 might be warranted.
But, this unstoppable force has run into an immoveable object: SPX 2138, which is the 1.618 extension of the 2007-2009 market crash [explained HERE.] Bullard, the BOJ, and the ECB got SPX up to 2134 all right, but it’s gone nowhere since then. Worse yet, it’s about to drop below the trend line (below, in purple) that connects the recent lows to that key October 15 low. And, if that weren’t enough, there are several potential H&S Patterns licking their chops, promising sizable downside in the event they’re triggered (marked with the red and white ovals.)
Bearish, right? It is… if the BOJ sits on their hands and looks away, pretending not to notice. But, with their own market in danger of a 15% correction, what are the chances of that happening?
* * * * *
SPX came within about 2 points of our second downside target yesterday. From China Joins the Party:
Today’s targets for SPX include the white TL from the Jul 7 bottom and the red channel midline at the SMA200 (2074.13.)
Tomorrow’s (Wednesday’s) targets coming up…
Note that USDJPY is hanging on to the rising white channel after reversing at the yellow .886 we identified yesterday. It has also found support at the red channel midline again.
 If it holds, our downside target for SPX is the red neckline at 2043.49. if it doesn’t, and NKD continues melting down, I think the 2019 target would work very nicely. It would break the purple trend line (either target would) and would threaten a very large H&S, just like NKD.
FWIW, the SMA200 is at 2074.80 today.
 With TNX melting down, gold soaring, support dropping in all sorts of instruments, I can’t say for sure that the BOJ will jump in and rescue the “markets.” That’s been their MO in the past, and I can only assume it will continue into the future.
Re the analog…I thought the inciting incident would be USDJPY being supported by its SMA100 and SMA200. In the end, the resistance SPX faces at 2138 was so strong that they couldn’t risk it. The USDJPY rally that began July 8 was necessary just to prevent serious damage to SPX. Interesting, though, that the timeline seems to be on track.
UPDATE: 9:30 AM
ES recovered only about 10 points from its overnight lows, so it appears SPX will blow through the SMA200 at 2074.80 — probably catch it on a backtest. SPX reached the July 27 lows (2063.52) in its opening salvo. It appears the algos are kicking in here — worth playing the bounce for agile traders. Again, the bounce target is the SMA200.
 At this point, SPX is clearly below the purple TL from October. It will really make an impact if it closes below it.
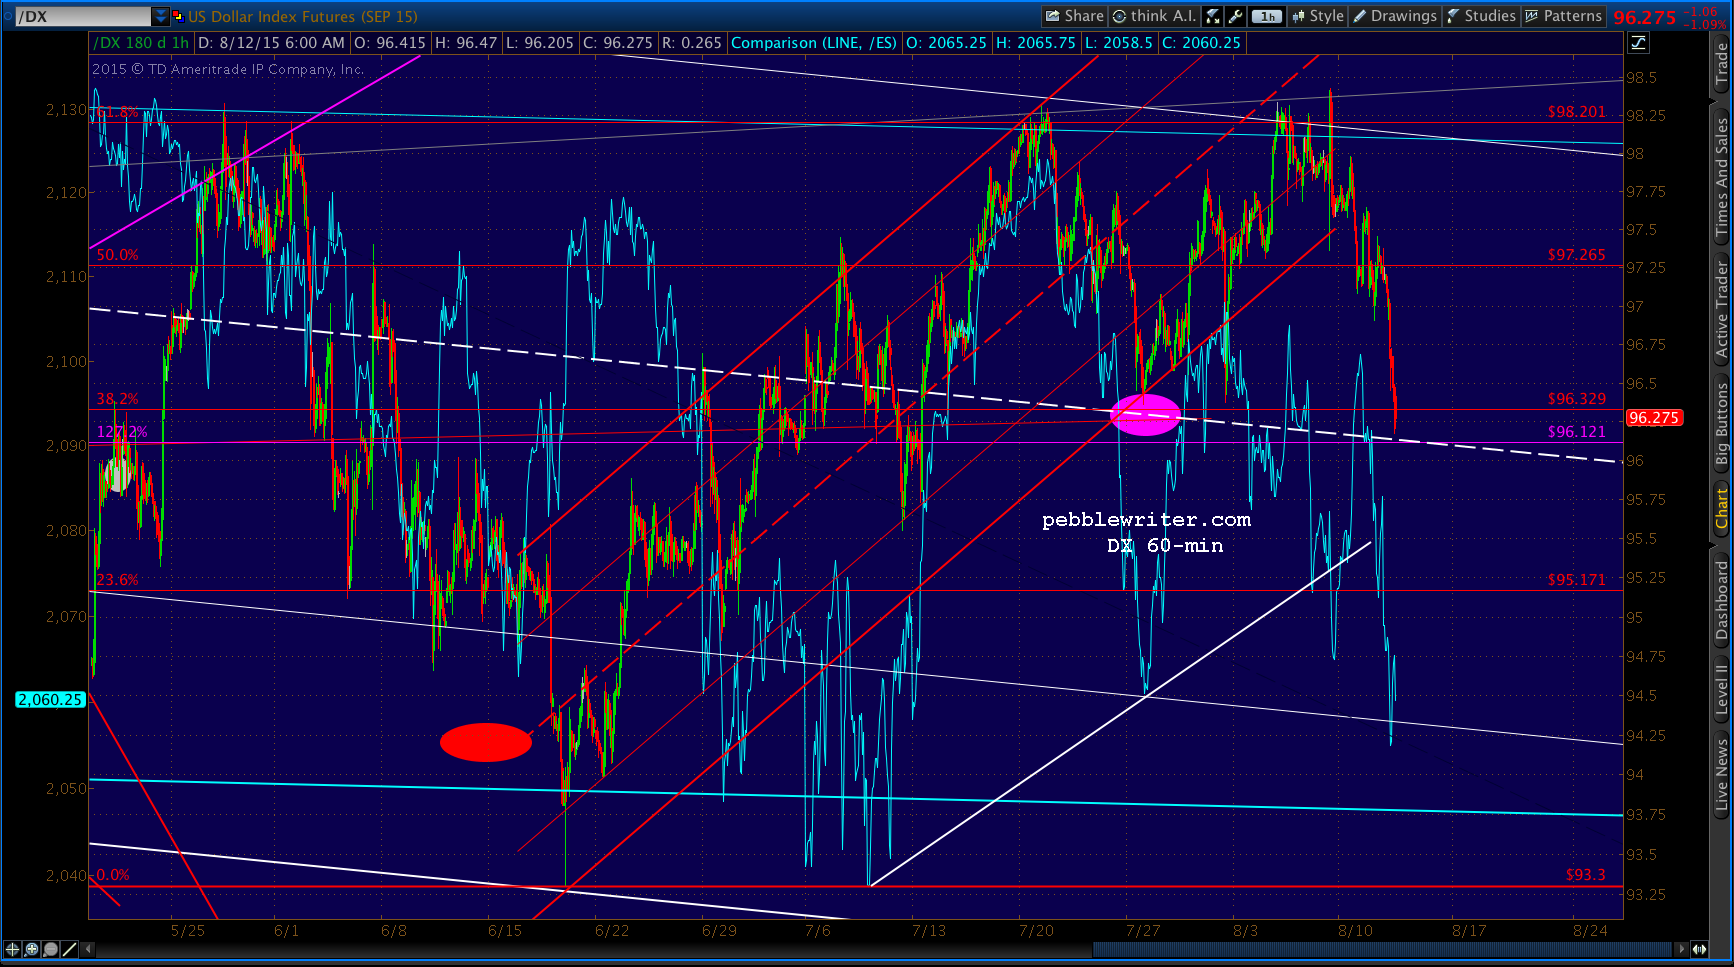
USDJPY has left the comfort of the rising white channel and is probing south of the red midline.  DX lost the rising red channel, but has good support at the falling white channel midline.
 EURUSD is, again, ignoring charting convention and trying to help stem the bearish tide.
 And, VIX is most of the way towards a Gartley or Bat Pattern completion at 17.85 or 18.73.
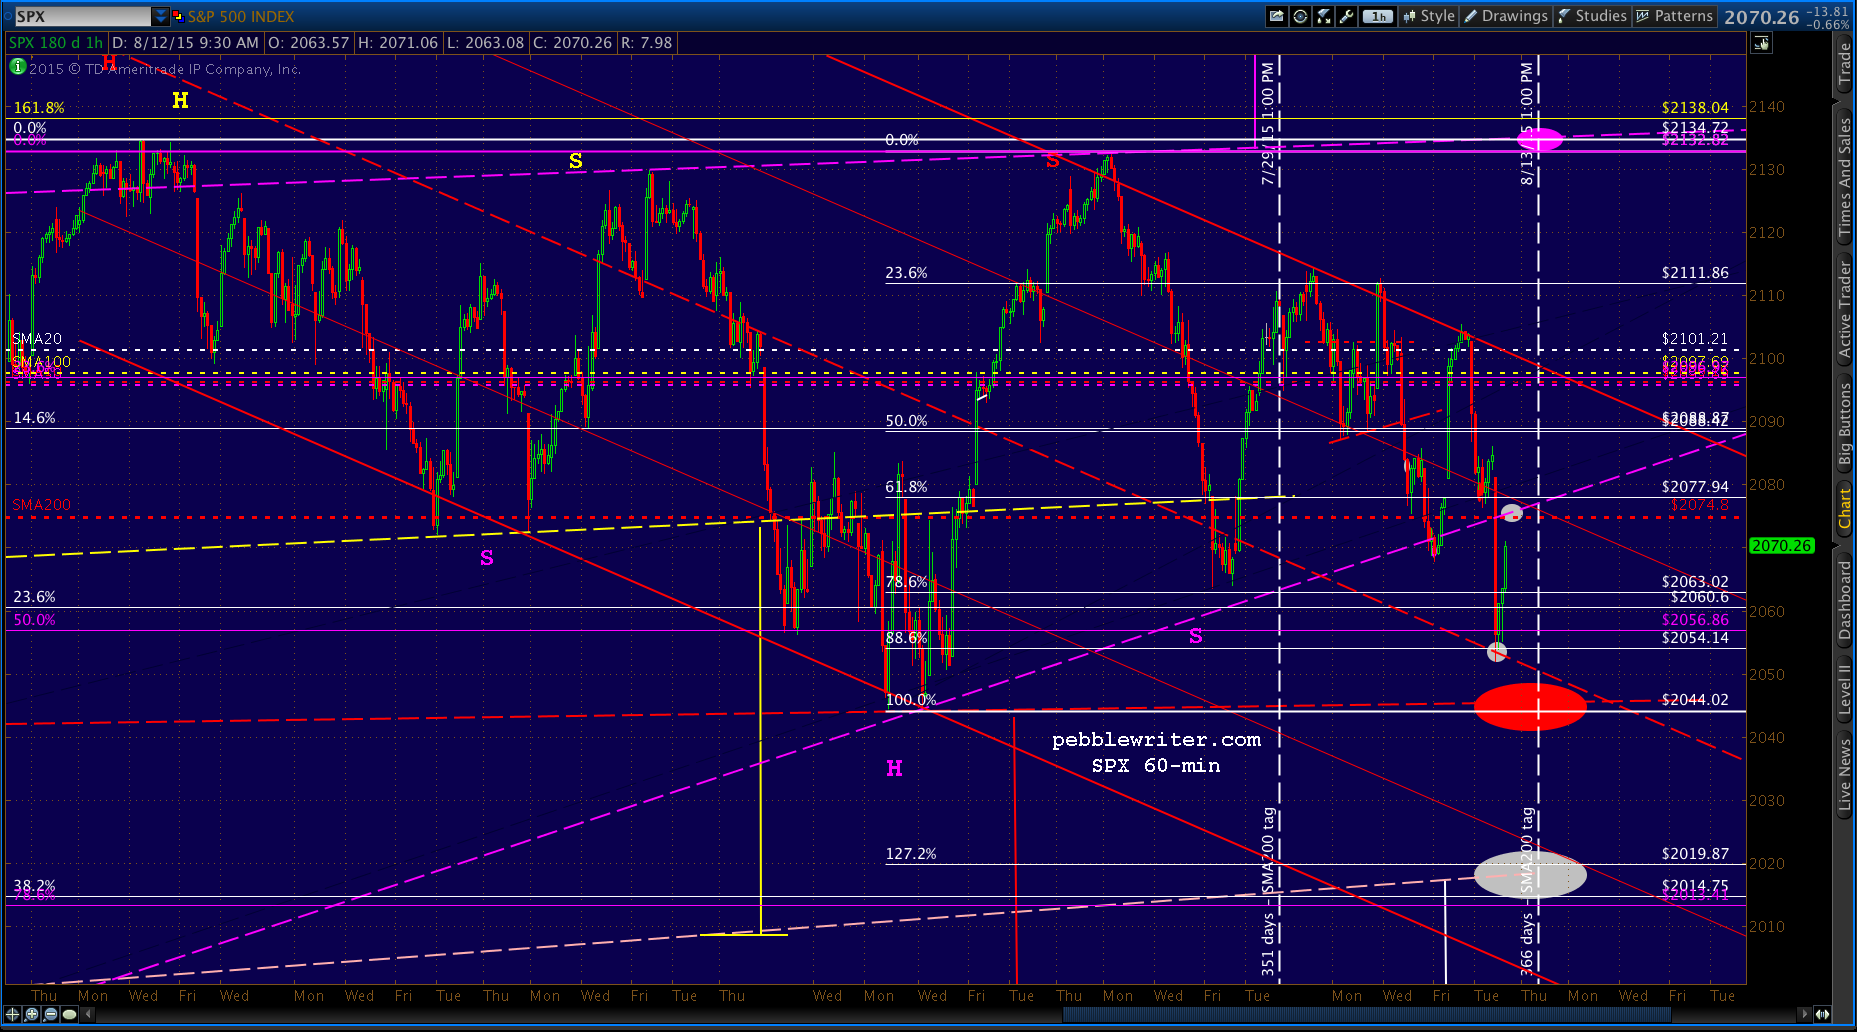
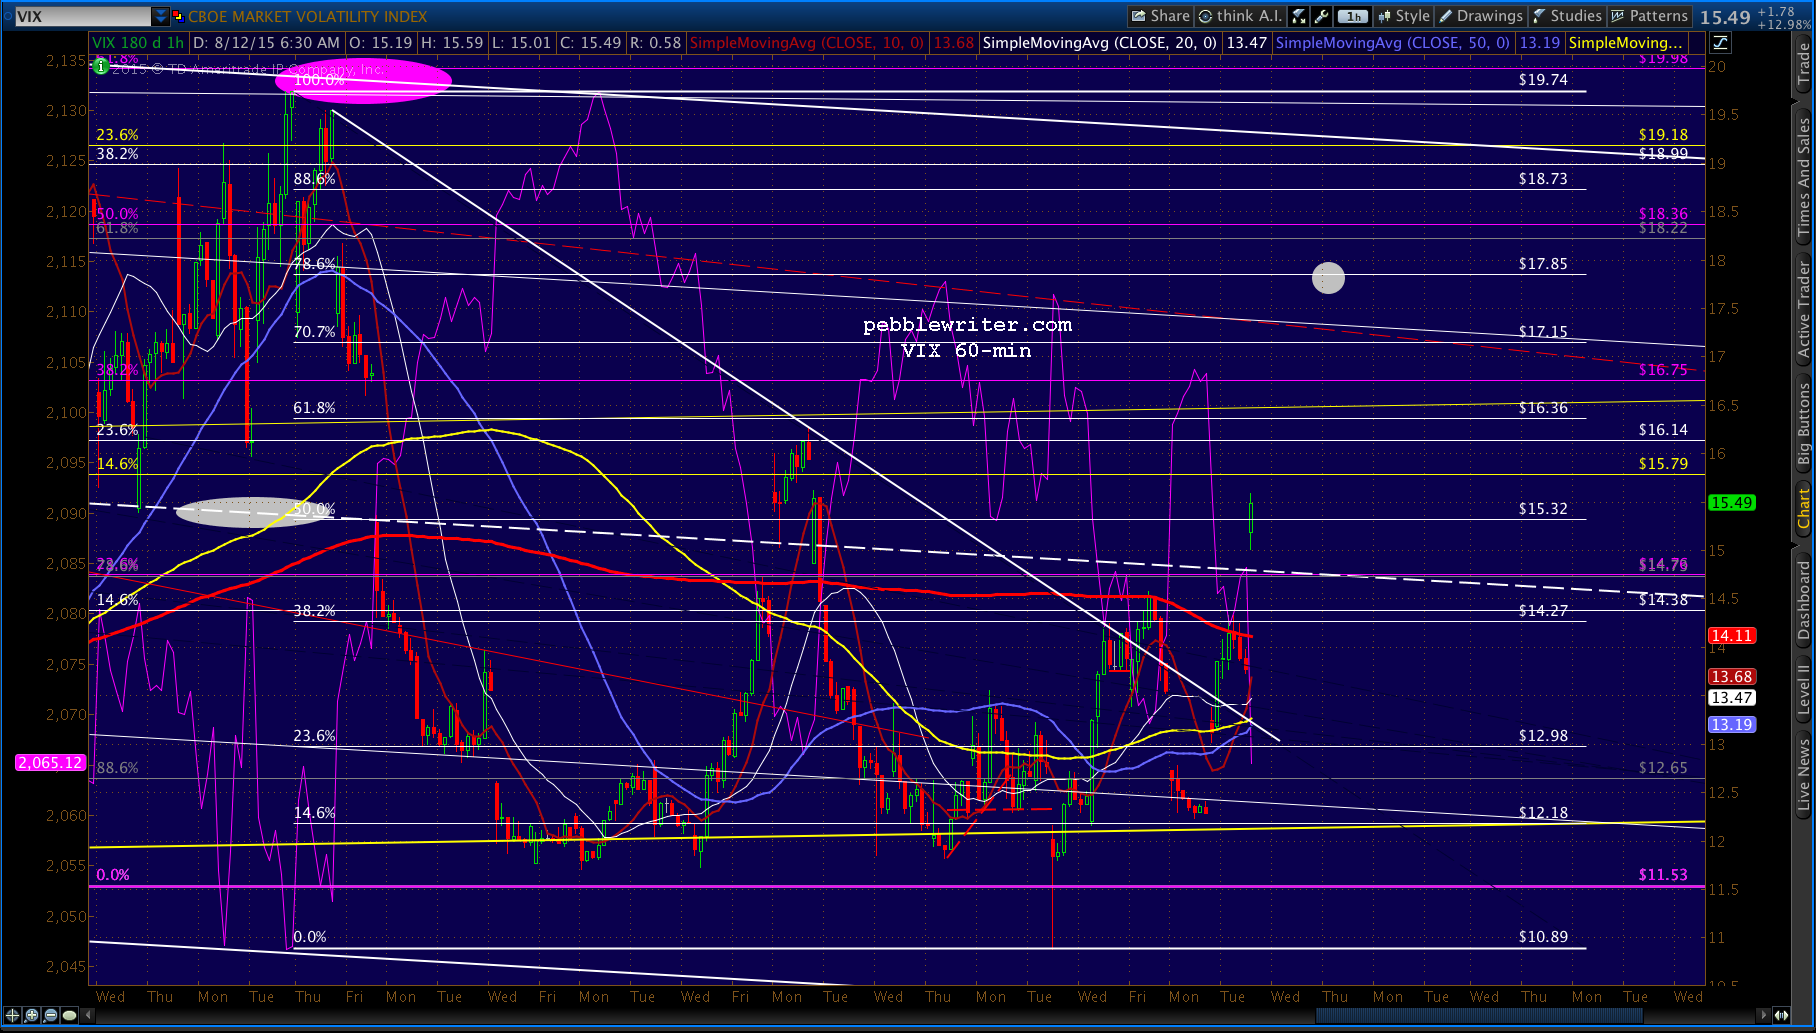 And, in the 4 minutes it took to put up those charts, SPX dipped below 2063.52, ending that particular bounce opportunity. It is now at the white .786 — the site of ES’s 14-pt bounce overnight.
 Note that a 14-pt bounce for SPX would take it back to the SMA200 for a well-designed backtest.
It appears SPX is waiting to find out from CL whether or not it’s going to slice through or rebound off the .236 channel line. NKD is making new lows, so it appears there won’t be a bounce here.
 Looks more like an .886 (2053.67) target, given that it crosses the falling red channel midline a few points south of here. USDJPY is inching towards the yellow .618 at 123.77, which will probably provide a concurrent bounce.
UPDATE: 10:24 AM
 Note that USDJPY didn’t reach that .618, meaning it has plenty of help still to offer the bears if it so chooses.
UPDATE: 10:32 AM
I think that was probably premature. In the last two minutes, both TNX and CL made very bearish moves. Back to the short side here at 2056.47. Tight stops of course. Charts in a moment.
TNX dipped below the previous lows…

 And, CL quick-tagged the red channel line only to drop back and break the white RW.
 ES came up short of its .886 at 2044. At 2052, it has 8 points to go. Maybe TPTB are going to go ahead and get that SPX 2045 while we’re down here???
CL indicates the timing will be around 10-10:30, and we have to get past the euro close at 11:30 first, so manage stops accordingly. The .886 bounce could be hard to control.
And, there’s an argument to be made for this being enough of a scare — within 7 points of a H&S completion (the red one) that targets 1950. It would be a 110-pt drop — about 5.3% from current levels and 8.6% from the 2134 high. It’s not that much, but these days it qualifies as “huge.”
UPDATE: 12:22 PM
This is shaping up a lot like the past two lows — with plenty of headfakes to go around. USDJPY stopped short of the .618 at 123.77, and CL found the TL of support we drew earlier. They’re both hanging around their lows for a reason. But, whether that reason is to fake out folks anticipating the neckline tag or to actually accomplish a neckline tag is unclear.
In any case, SPX appears likely to exceed the small trading range of the past couple of hours and probably head up to 2063-2067, or even all the way up to backtest the SMA200.
 Updated CL and USDJPY showing the detail of their “reversals.”
 UPDATE: 12:36 PM
This should be the reversal point here at 2067.63 if they’re trying to portray this as the 4th of the 3rd of the 5th wave down. A pop through here suggests the full SMA200 backtest.
 UPDATE: 1:09 PM
 UPDATE: 1:48 PM
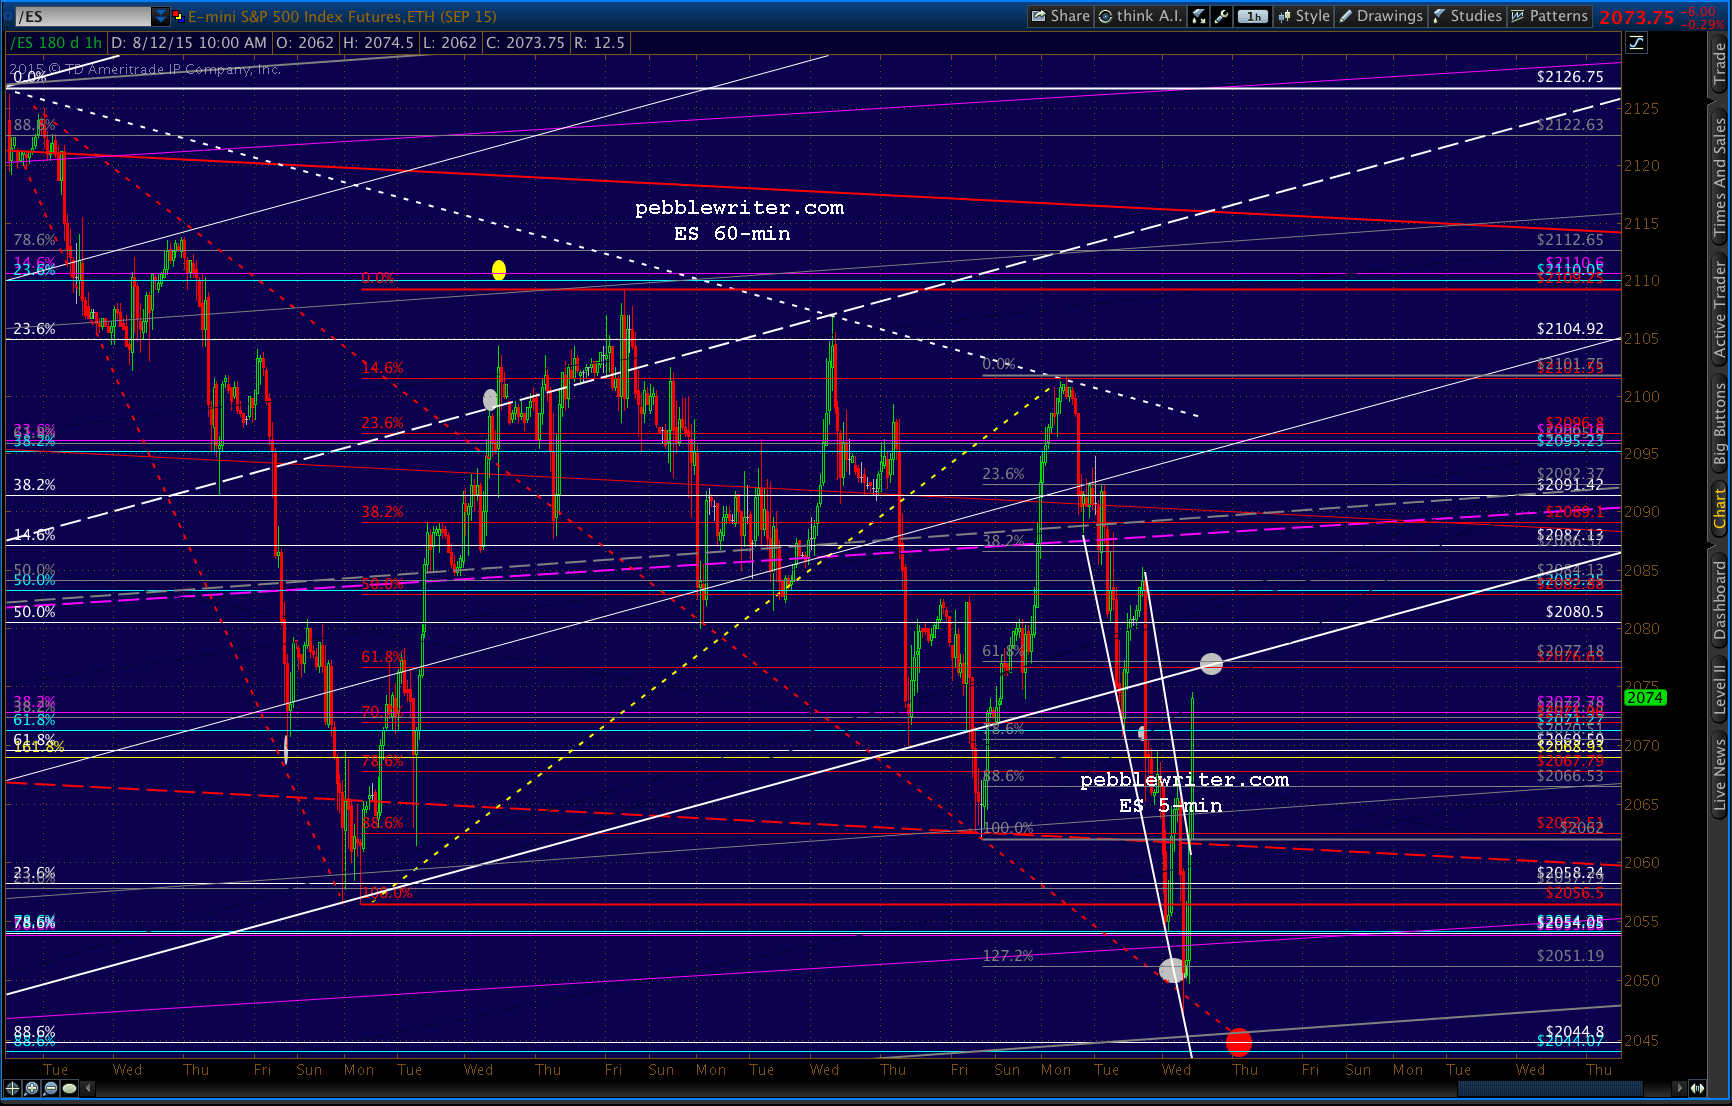
 The upside target is wherver SPX is when ES tags the gray .618 where it intersects the rising white channel bottom at 2077.18ish.
 UPDATE: 2:47 PM
Switching back to a short position here at 2081.5… 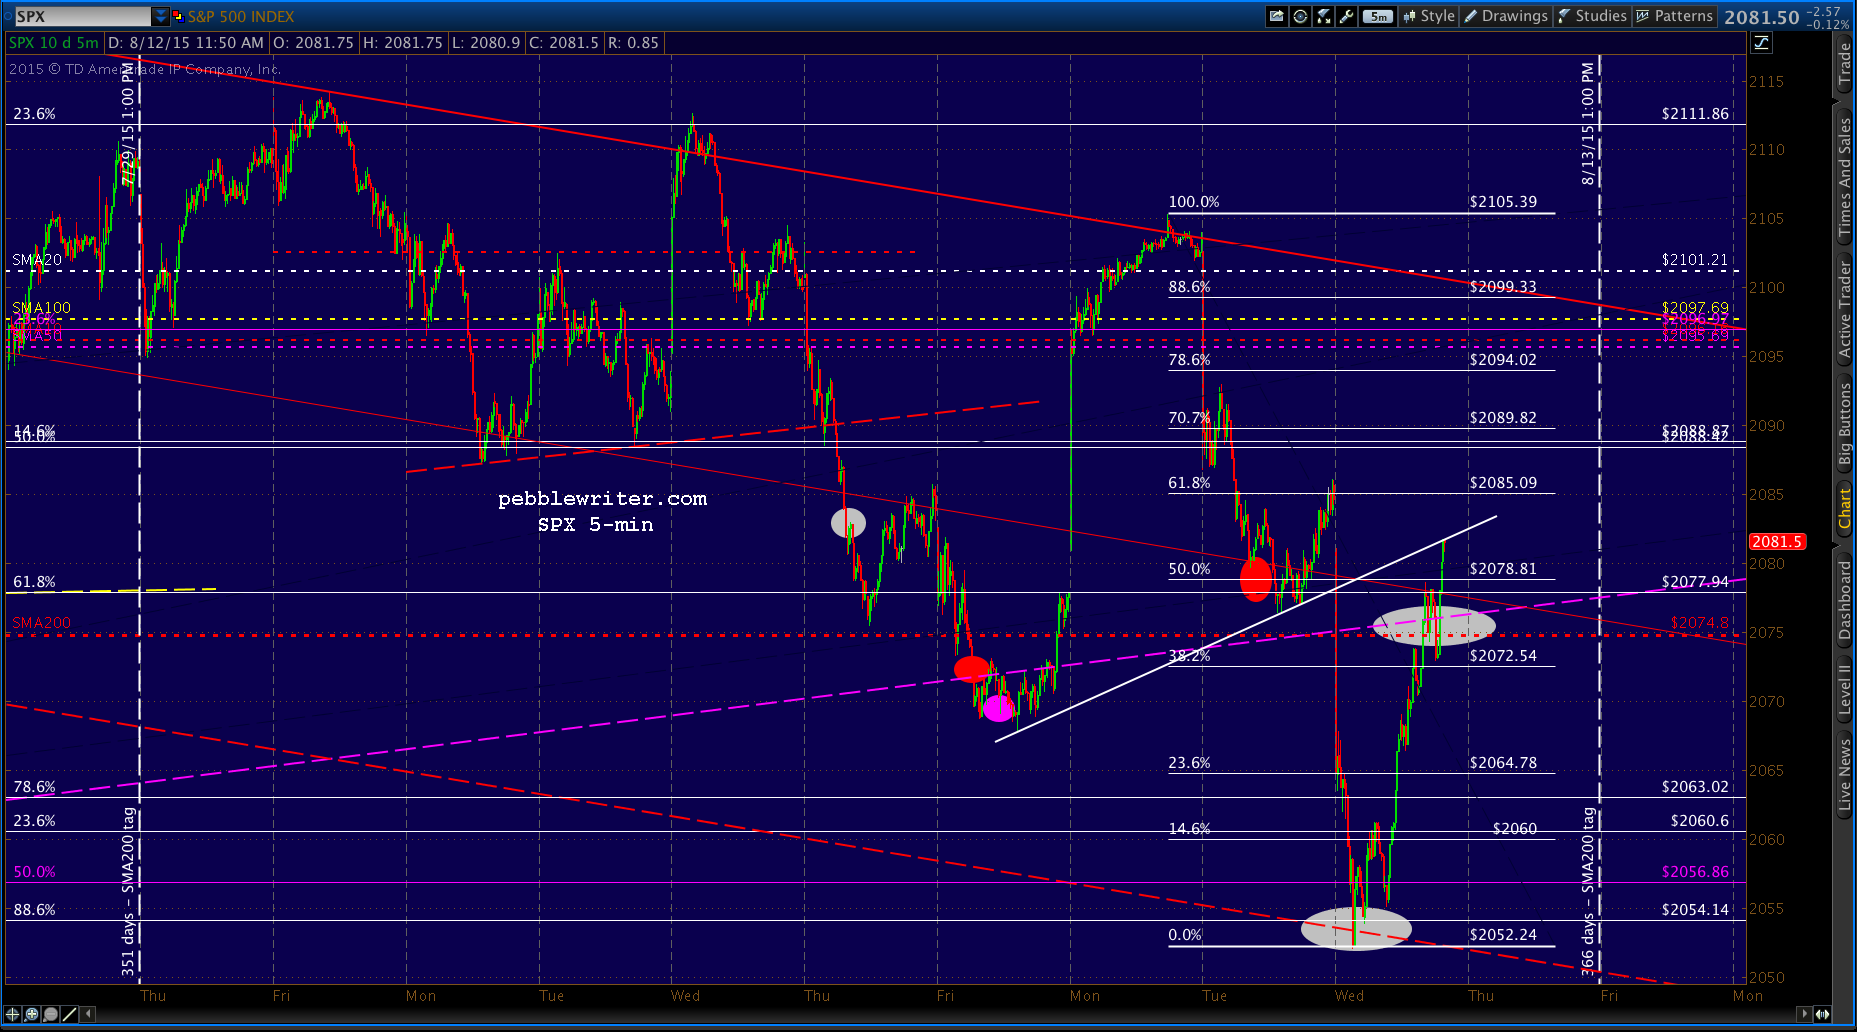 …as ES just tagged the .618 mentioned above. Resistance elsewhere as well.
 NKD back to the red .382.
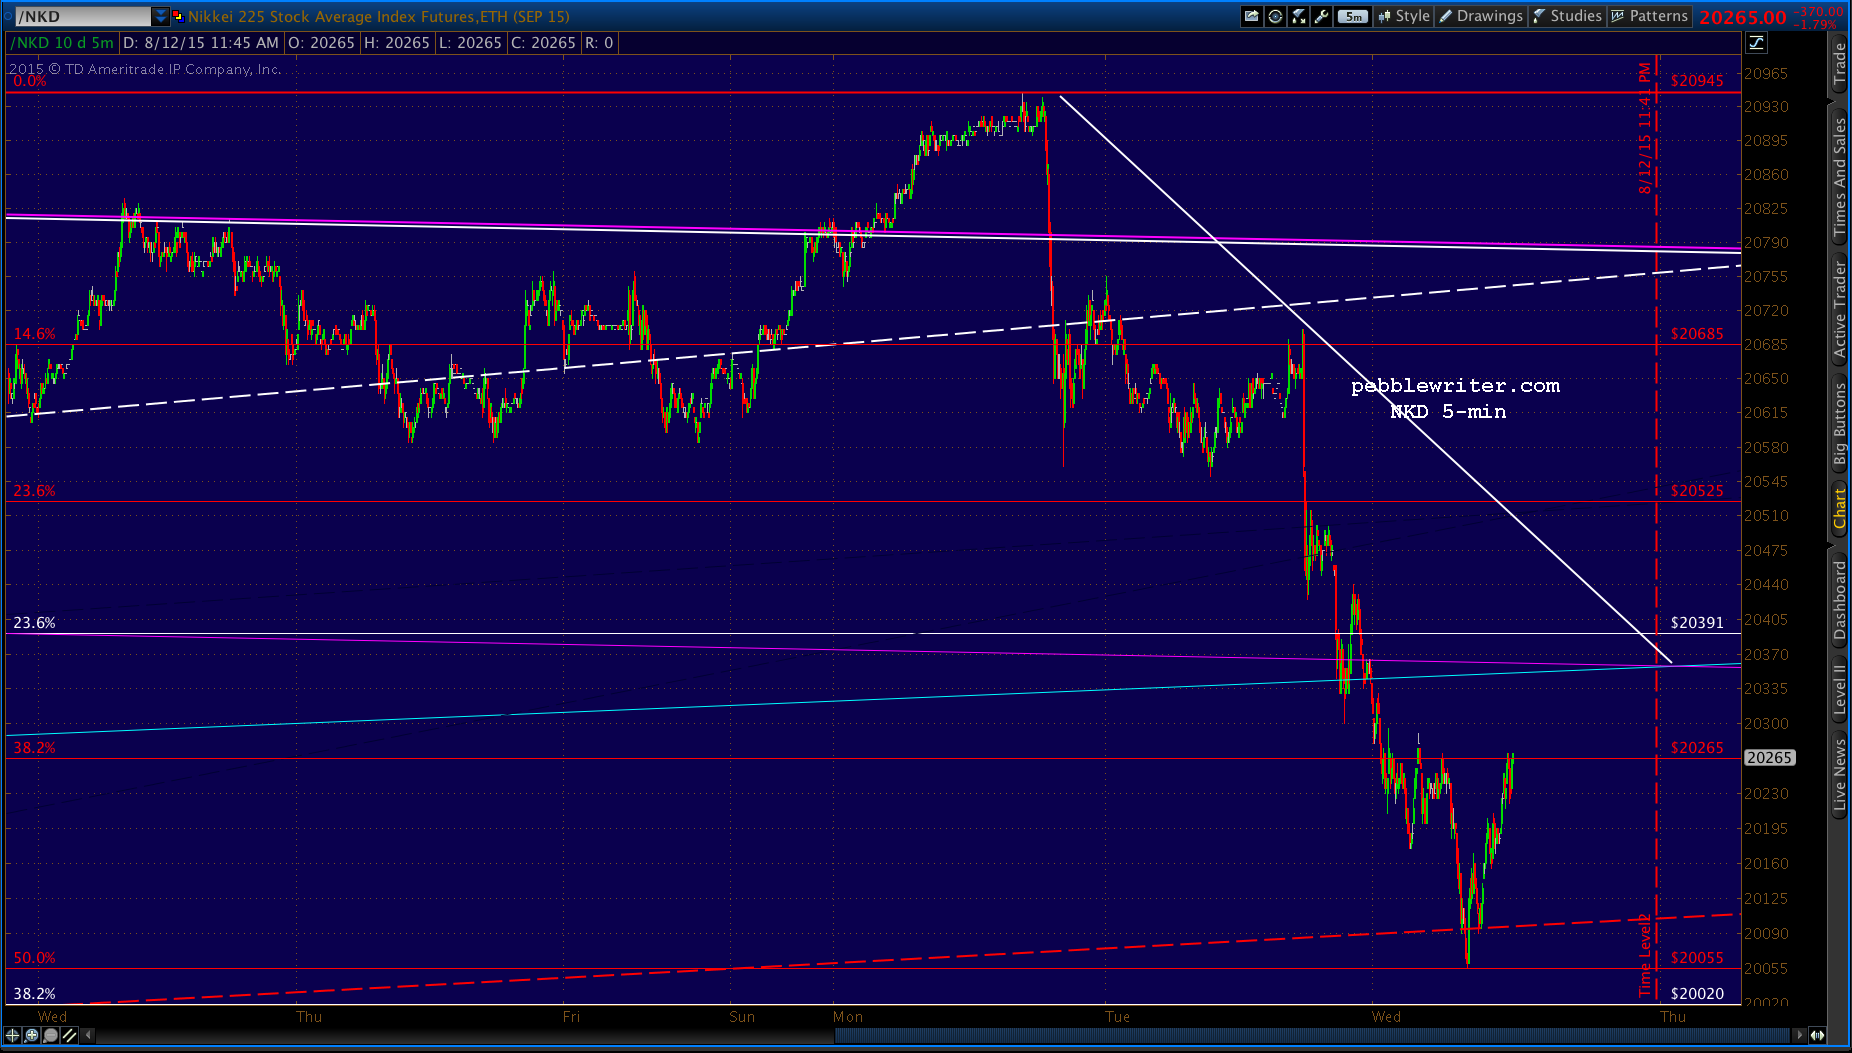 UPDATE: 3:26 PM
Stopped out again at the .618 (2085.09) These algo-driven melt-ups are just too hard to stop once they get rolling. SPX and ES are back inside their rising channels, so at the end of the day it’ll show as a very bullish recovery.
I suspect we’ll get another leg down, but there’s nothing to latch onto at this point.
 Regardless of the close, I would maintain a short position overnight if able to hedge it. I expect to see another leg down.