Month: August 2015

  • Update on NYA: Aug 31, 2015

    We pointed out on July 16 that it was do or die time for NYA.  It had backtested a trend line connecting a string of lows that was 7 months long — as well as the SMA100.  We forecast a drop to 10387 by early August and 10,042 by mid-August.

    We were right on the direction and the timing, but underestimated the extent of the initial drop.  Rather than find support at 10,042 — the potential neckline for a huge H&S Pattern — NYA plunged right through.

    2015-08-31-NYA daily CU 1300The drop to the white 1.272 at 9,513 surprised many investors, but was in keeping with our analog.

    continued for members(more…)

  • Charts I’m Watching: Aug 31, 2015

    Today’s action should serve to let off some steam after a rather ferocious bounce from last week’s lows.  The horses that took prices higher are all backtesting key support levels.  Whether or not they will hold is the question on everyone’s minds.

    SPX should reach Friday’s target lows without too much trouble — being that it’s no longer Friday.  Remember when stocks used to occasionally sell off into the weekend?  Note that our current forecast has been updated.

    I’ve also updated charts on NYSE, RUT,  COMP XLF, VIX, EURUSD, NG and GC over the weekend and will be posting these throughout the day.  If you haven’t yet signed up for automatic notifications and/or twitter alerts, this would be a good time to do so.

    continued for members(more…)

  • On Track

    A reminderFrom August 25-29, we’re offering Charter Annual Memberships at $950.  It works out to about $2.60/day, less than a cup of coffee.

    It’s $550 off a regular annual subscription (slated to rise to $1,500 by the end of the year), and a whopping $1,150 off a monthly subscription at the current rate of $175/month (which will increase to $200/month.)

    Best of all, your rate will never increase for the life of the site for as long as you remain a member.  To sign up now, click HERE.

    *  *  *  *  *

    The recovery from Monday’s lows is right on track, aided by two reliable friends USDJPY and CL.  In fact, yesterday’s action was the most such aid the “market” has had in months.

    For its part, USDJPY ran a very rigged orderly recovery back above the .618 Fib at 120.11 and the SMA200, where it remains this morning.  Funny how that happened.2015-08-28-USDJPY 5 0615continued for members(more…)

  • What If ???

    A reminderFrom August 25-29, we’re offering Charter Annual Memberships at $950.  It works out to about $2.60/day, less than most of us spend on a cup of coffee.

    It’s $550 off a regular annual subscription (slated to be at $1,500 by the end of the year), and a whopping $1,150 off a monthly subscription at the current rate of $175/month (which will increase to $200/month.)

    Best of all, your rate will never increase for the life of the site for as long as you remain a member.  To sign up now, click HERE.

     *  *  *  *  *

    I chuckled when I read a headline on Zerohedge yesterday: “What if the Crash is as Rigged as Everything Else?”  Charles Hugh Smith is one of my favorite financial writers and an excellent analyst, so I have no quibbles with his reasoning.  It’s sound, as always.

    But, given that we forecast last March the USDJPY’s decline to its SMA200, the effect it would have on stocks, and the reasons why TPTB would not only allow it but actually make it happen, I’m still shocked that so few analysts are picking up on the fact that of course it is!

    We have several new members over these past few days, so it probably wouldn’t hurt to recap.

    1.  the yen carry trade has driven the vast majority of stocks’ gains since 2011.
    2.  Japan can’t continue devaluing the yen w/o repercussions, chiefly higher import prices
    3.  SPX hit very heavy Fib resistance at 2138 in May (the Last Big Butterfly)
    4.  the only path past 2138 is further yen devaluation
    5.  because it will cost them, Japan needed to be sufficiently encouraged/threatened
    6.  crashing the oil market was the carrot, the very real risk of an equity trap is the stick
    7.  the BOJ will eventually give in and expand QQE and/or further depreciate the yen

    With NKD off 18% from its highs (about 2.4% of Japan’s GDP given the BoJ and GPIF holdings) on Monday, they no doubt felt sufficiently threatened. It has since recovered almost half of those losses, but is still languishing below its own SMA200.  Did they get the message?  Or, will another leg down be required in order to drive home the point?2015-08-27 NKD daily 0642USDJPY has been returned to the safety of the .618 Fib at 120.11 (trips below it produce sell-offs, trips above produce rallies.) But, it hasn’t regained its SMA200 — and, obviously, won’t until further easing and/or yen devaluation commences.

    2015-08-27 USDJPY daily 0642Our analog from March has done an excellent job of foretelling all of these events.  It has conveniently explained why.  But, it doesn’t explain “who.”

    In speaking with an old college friend who cut his teeth at Goldman and is one of the more savvy Wall Street guys I’ve ever met, it occurred to me that we may never know who the players are who have orchestrated the entire scheme.

    I’m fairly certain the Fed is at the center of it.  I think the sheer size of the moves precludes one or two hedge funds getting together to manipulate the USDJPY, ES, CL, ZN, etc. on their own.  That raises the question of the BoJ.

    Abe and Kuroda have been quite open about their efforts to prop up their stock market.  As discussed in Japan’s Equity Trap, there’s ¥80 trillion ($666 billion at 120 yen/USD) at stake between the BoJ and GPIF.  That’s over 13% of Japan’s GDP and almost 17% of Japan’s aggregate public market cap in those two government coffers alone.

    But, are they both in on the plan?  Do they have the Diet’s approval, or are they pulling a Hank Paulson — acting bewildered and frightened for the country’s future in order to secure government and corporate approval for the next round of yen decimation?  It’s hard to say.

    And, I’m not sure it matters.  Either way, it’ll happen.  And, it’ll be further proof that the crashes are just as rigged as everything else.

    Now, on to today’s forcast.

    continued for members(more…)

  • Deja Vu

    If this morning’s setup looks vaguely familiar, it’s because it’s practically a carbon copy of yesterday’s.  Futures up big on USDJPY’s threat to retake 120.11, bond futures getting hammered, oil bouncing overnight…overnight ramp jobs are what TPTB do best.

    Before we dive into today’s forecast, consider some long-term channel lines on SPX.  The central question we’ve been facing ever since calling a potential top on May 21 is whether TPTB can overcome the 1.618 Fib at 2138: the terminus of the last big Butterfly Pattern.

    Screen Shot 2015-08-26 at 6.07.58 AMThe above chart shows many similar challenges along the way, though few have equaled the current one in terms of the potential repercussions should they fail.

    continued for members(more…)

  • Best Day Ever!

    I’ve read so much criticism of technical analysis, chart patterns and harmonics lately that I’m taking the opportunity to crow about today’s results.  Our intraday calls on SPX delivered our best single-day results ever: 4.8%.

    From today’s post:  What Next?

    *    *    *    *    *    *    *

    At the open:

    SPX’s upside targets today include a backtest of the .618 [Fibonacci level] at 1940.63, followed by a close of the gap at 1970.89 [note: though charts indicate SPX opened at 1898.08, we use 1919.02, which was the low at one minute after the open — by which time all purchases should have been made.]

    9:47 AM:

    SPX has successfully backtested the .618 — the first potential turning point.  If it reverses here, then the .886 at 1856.46 is on the table.  If not, then we should see a continuation up to close the gap and potentially backtest the bundle of key Fibs and horizontal support at 1980ish.  I’d take a shot at a short, but keep an eye on USDJPY and NKD for signs of a reversal.

    11:14 AM:

    USDJPY threatening to break above 120.11.  It was enough to send SPX through 1940.63, so we’ll abandon the short and revert to the long side with the next upside target being the gap close.  Be aware, however, that neither USDJPY or NKD has truly broken out — merely threatening.  So, we could be reversing this long position at a moment’s notice…  Above [1940.63], the target is 1970.89.  Below it, the target is 1856.46.  Follow USDJPY and NKD for indications.

    NKD and USDJPY’s patterns broke down, and SPX’s move above 1940.63 proved to be a head fake.  Per our 11:14 update, this called for a short position.

    2015-08-25 SPX 15 13001:40 PM:

    Quick update… NKD is bouncing (for now) on the rising TL, while USDJPY broke down from and is backtesting its channel.  SPX has reached 1920 so far. [A trendline from yesterday’s lows] could provide support at 1887ish around the end of the day, with a gap down to 1856 in the morning.  A drop straight to 1856 today would be cleaner and neater, but things are rarely that simple these days.

    3:44 PM:

    SPX has reached the rising TL and is approaching the .886 Fib.  Looks like it might just close at or below 1887.87 as we discussed earlier. Next lower support, again, is 1856.46.

    3:52 PM:

    For anyone who can’t hedge overnight, I’d either take profits here at 1879 and go to cash or put in a trailing stop into the close. Still looks like it has further to go, but will we get there in the next few minutes? If you can hedge overnight, I think it’s fairly likely we get to 1856 in the morning.


    SPX closed at 1868.14, a full 72 points from where we shorted at 1940.63.  And, of course, 1940.63 was a 21-point gain from 1919.02.  All in all, it was a very cool 93-point (4.8%) gain.

    It’s even more cool considering it happened on a day when folks who don’t believe in chart patterns, harmonics and technical analysis were running around with their hair on fire. Well, not literally we hope…

    Last, a special congratulations to any new of our new members who put at least $20K to work today, following our market signals.  You’ve paid for the next year’s research on the first day! *


    Enjoy this article?  Take advantage of our current membership promotion.  Over half off, and your rate is guaranteed to never increase.  Now through Aug 29.  For more details, see:  Sign Me Up!


    * my lawyers would want me to remind you that this sort of thing isn’t the norm.  We’re only averaging a little over 13% per month so far this year.


  • Japan’s Equity Trap

    A lot of folks get that wrong.  They talk about Japan’s “deflation trap”, as though everything would be just great if only Japan could just manage to get inflation back above 2%.

    In Japan, as in the US and the eurozone, inflation has been defined into non-existence.  We accept terms like “core inflation, without the volatile food and energy component” as though it actually meant something.  Sounds official…even sounds legitimate.  It’s not.

    There’s plenty of inflation.  Just ask the person who does the shopping or pays the bills in most households.  Even with the recent oil crash that was engineered to protect the yen carry trade, real inflation at the consumer level is more like 7-8% (for more, check out John Williams’ excellent website.)

    No, the real trap that could drop kick Japan’s economy into the Pacific is the outrageous amount of stocks they’ve bought on margin over the past year. I consider it an equity trap.

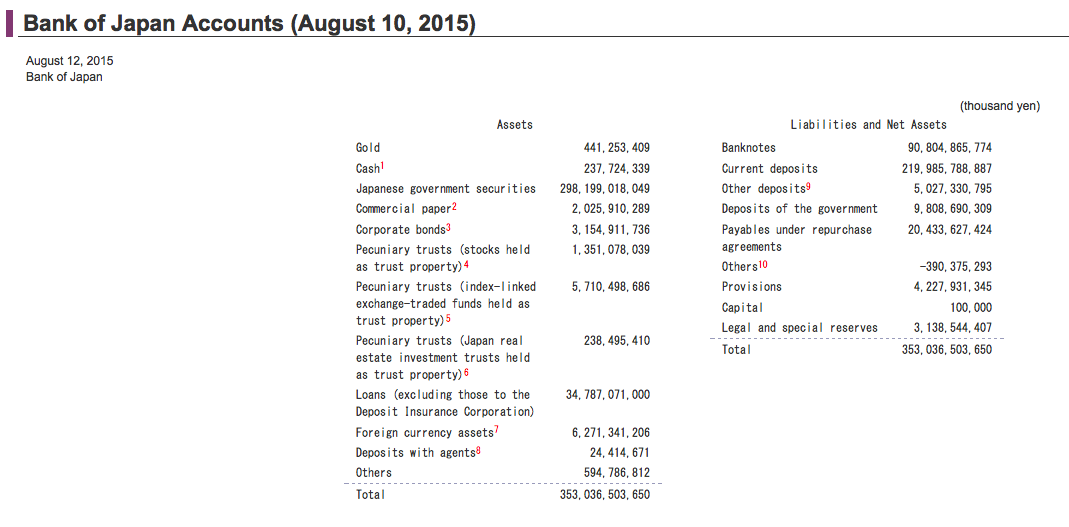
    The most recent data show the BOJ owns almost  ¥7 trillion in stocks outright.  I understand they’re not buying stocks on margin at the local Schwab office.  But, when your stocks are 70X your capital, you’re heavily margined.

    Screen Shot 2015-08-25 at 10.19.04 AMNot only that, the ¥140 trillion Government Pension Investment Fund has allocated 50% of its assets to stocks.

    Screen Shot 2015-08-25 at 11.47.02 AM

    Let’s round it off and say the bank/government of Japan has an equity position of ¥80 trillion ($666 billion at 120 yen/USD.)

    First, note that this almost exactly the amount of annual easing that was announced in last October’s QQE expansion.

    More ominously, it leaves Japan in a do-or-die situation.  At its lows yesterday, August 24, the Nikkei 225 was off 9.5% from Friday’s close.  Not that you’ll hear this on the news, but it’s off a full 18% in less than 2 weeks.  I know, I know, it’s China’s fault…

    If all of that $666 billion were in the Nikkei, the last two weeks’ exposure to equities would have cost Japan $120 billion — 2.4% of GDP!

    Sure, some of it’s on the books of a long-term pension plan, and the rest is presumably not going to be realized anytime soon.  But, the data illustrate just how vulnerable Japan is since it: (1) put that much money into stocks; and, (2) is doing so in such a leveraged fashion.

    japanpublicdebtAt the end of the day, taking on this much risk smacks of desperation.  It’s probably because Japan is desperate.  With over 40% (and growing) of Japan’s borrowings going to pay interest on existing debt — which is already over 250% of its (shrinking) GDP — don’t expect things to change anytime soon.

    And, don’t expect the BOJ to sit idly by and allow the equity trap expand out of control.  They have no choice but to increase QQE and/or devalue the yen again, and soon.

    For more on the yen carry trade and why central banks are working to protect it at all costs, check out:  The Yen Carry Trade Explained (Why the Rally Won’t Die.)

    *  *  *  *  *

    Enjoy this article?  Take advantage of our current membership promotion.  Over half off, and your rate is guaranteed to never increase.  Now through Aug 29.  For more details, see:  Sign Me Up!


  • What Next?

    NEW PROMOTION !

    Following our recent results, several members (as well as a few lurkers) have inquired about another annual membership promotion.  We got a great response to the last one, so we’ll give it another go. 

    From August 25-29, we’re offering Charter Annual Memberships at $950.  It works out to about $2.60/day, less than most of us spend on a cup of coffee.

    It’s $550 off a regular annual subscription, and a whopping $1,150 off a monthly subscription at the current rate of $175/month (slated to increase to $200/month at the end of the year.)

    Best of all, your rate will never increase for the life of the site for as long as you remain a member.  As one of our long-time members who recently renewed at $600 would tell you, this aspect alone makes this a great offer. 

    Note:  If you’re already a monthly/quarterly/semi-annual member, we’ll add your new year to your existing membership.  Your annual price will still be locked for life.

    We are also increasing referral incentives during this promotion.  Send a friend our way, and we’ll credit you $250 when they subscribe to an annual membership

    If you’re a new member, ask a friend to join too and split the savings.  There’s no limit, so if you have at least a few friends you could end up with a free membership.

    *  *  *  *  *

    If there were any doubts about the relationship between the USDJPY and SPX, yesterday’s price action should have laid them to rest.  2015-08-25 USDJPY v SPX wkly 0600As we’ve maintained for the past couple of years, the yen carry trade is the single most powerful influence on stocks’ unending rally and has been since October 2011.

    Knock the ever-depreciating yen out of the equation, and — as we saw yesterday — the “markets” start behaving like real markets. They actually begin to reflect the deteriorating fundamentals underpinning over-inflated prices.

    We could leave it at that.  But, it’s important to note that yesterday’s mini-flash crash was no less scripted than the past five years’ rally.  The opening plunge took SPX slightly past our initial downside target of 1887.87, and landed NKD and USD JPY just shy of our targets for them.2015-08-24 SPX daily 0631continued for members

    (more…)

  • Our Analog Plays Out

    Better late than never.  Our analog has finally played out, 11 days later than expected.  As we forecast would happen back on March 27 [see: A New Analog], the trillions that have benefited either directly or indirectly from the yen carry trade [explained HERE] are now suffering from the USDJPY’s decline.  From that original post five months ago:

    Back to the 2012-13 timeframe:  USDJPY first closed at or below (at) its SMA200 again on Oct 23, 2013 a total of 366 days (≈1 year) from Oct 22, 2012.  The equivalent this time around would be Aug 13, 2015.

    The chart below from July 17 [see: Analog Update] shows that original USDJPY target (as well as a potential earlier date): 2015-07-17 USDJPY daily 0642The pair went up to tag our upside target, and has now finally returned to earth — plunging below the SMA200 target as well as the vital .618 Fibonacci level (in yellow below.)

    2015-08-24 USDJPY daily 0612Remember, the yen carry trade depends on a depreciating yen (increasing USDJPY.)   An appreciating yen breaks the cycle, and we get crazy declines in a market that has been propped up so long by the BoJ’s actions.


    Screen Shot 2015-08-24 at 5.43.59 AM

    Want higher prices again?  Simple: the BoJ must announce an expansion in QQE (the Fed could also play a role) or at least make sure USDJPY gets a very big bounce right here.  Key levels to expect after the break…

    continued for members(more…)

  • End Days

    No, it’s not another apocalyptic warning from the tin foil hat crowd.  It’s just that NKD is closing in on our 19,240 target (between 29,210 and 19,240.)  In my opinion, it’s the most important of the dozens of charts that I follow.  And, as a reminder, it fits in perfectly with our analog as well as our forecast for the Nikkei.

    From our last NKD update on Aug 12:

    Will the next meltdown will be the charm?  Time to ladle a little QQE on top of the currency manipulation?

    2015-08-12 NKD 1211When the yen carry trade makes the global financial markets world go ’round, and the central bank that makes the yen carry trade happen is also responsible for propping up the Nikkei 225, and said central bank is facing a colossal collapse of its phony baloney economy if the Nikkei should collapse…

    Well, let’s just say that — whether by carrot or by stick — we expect the BoJ to “do the right thing.” They just need the proper motivation — which should be delivered today.

    2015-08-21 NKD daily 0600Our next major downside target is likely to be tagged in the opening hour today.

    continued for members(more…)