

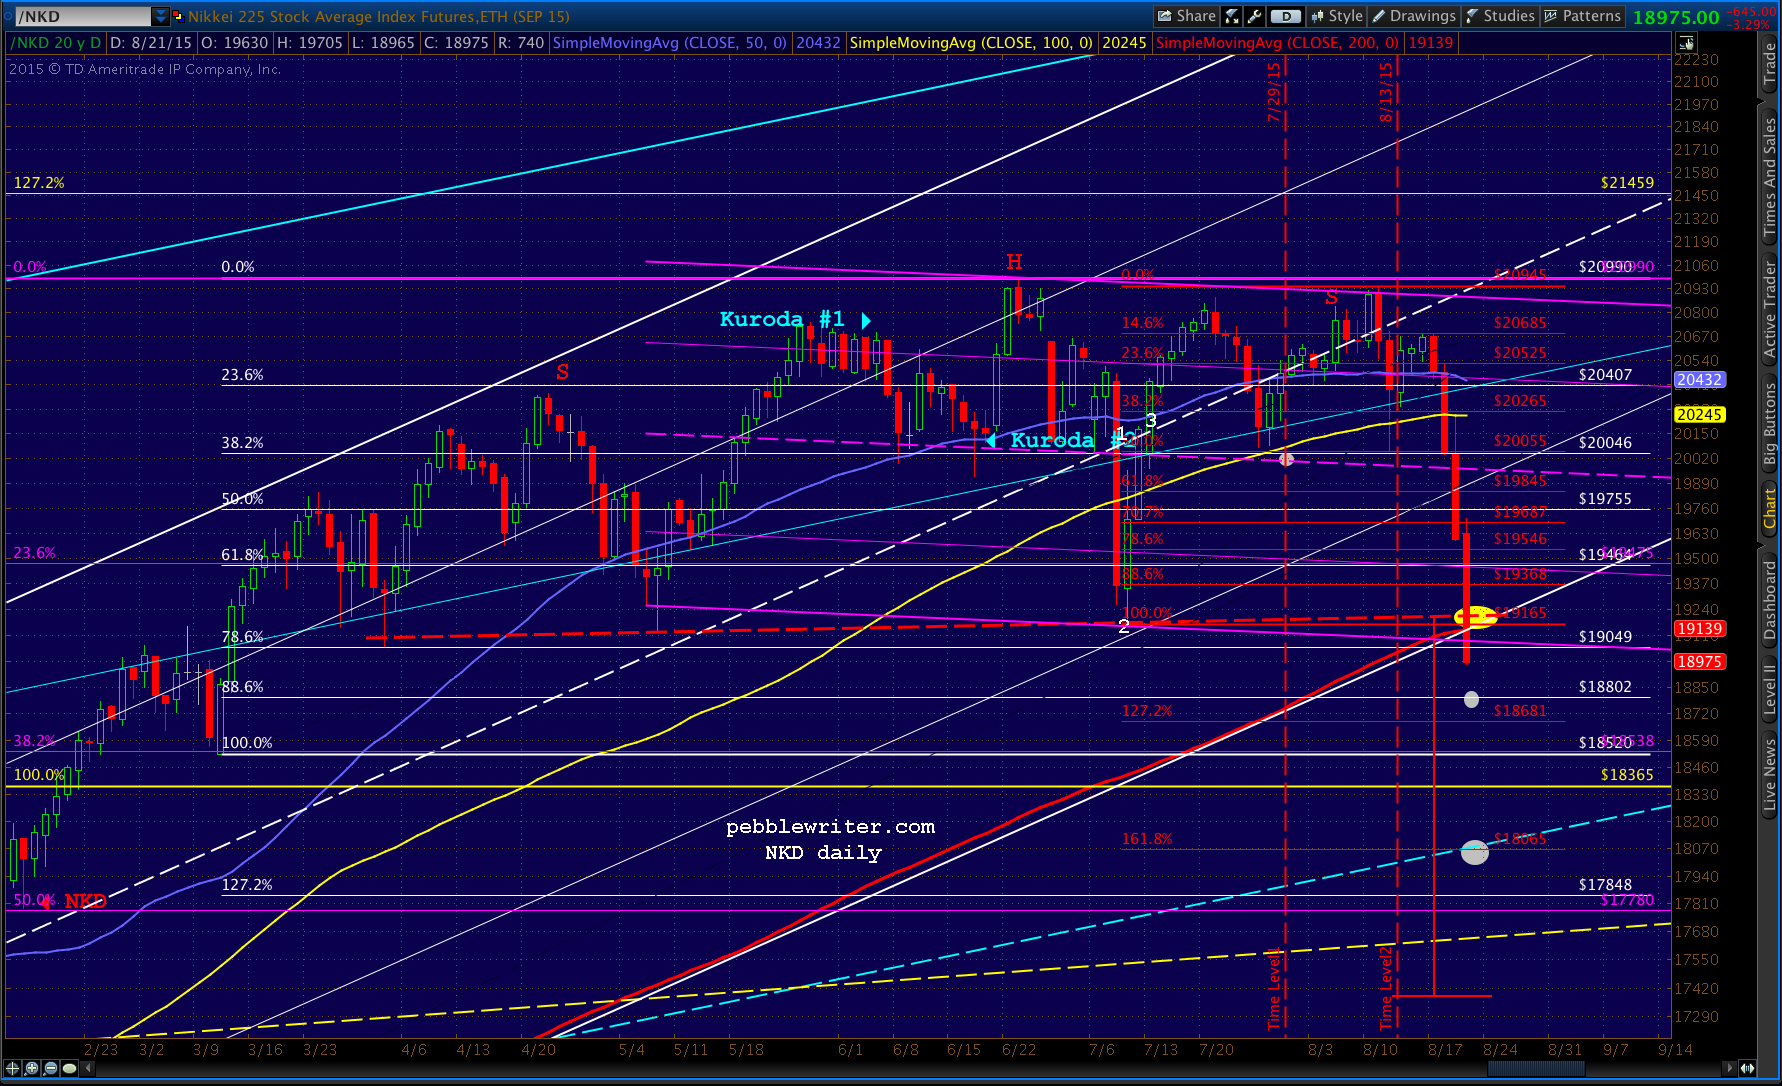
No, it’s not another apocalyptic warning from the tin foil hat crowd. It’s just that NKD is closing in on our 19,240 target (between 29,210 and 19,240.) In my opinion, it’s the most important of the dozens of charts that I follow. And, as a reminder, it fits in perfectly with our analog as well as our forecast for the Nikkei.
From our last NKD update on Aug 12:
Will the next meltdown will be the charm? Time to ladle a little QQE on top of the currency manipulation?
 When the yen carry trade makes the global financial markets world go ’round, and the central bank that makes the yen carry trade happen is also responsible for propping up the Nikkei 225, and said central bank is facing a colossal collapse of its phony baloney economy if the Nikkei should collapse…
Well, let’s just say that — whether by carrot or by stick — we expect the BoJ to “do the right thing.” They just need the proper motivation — which should be delivered today.
 Our next major downside target is likely to be tagged in the opening hour today.
continued for members…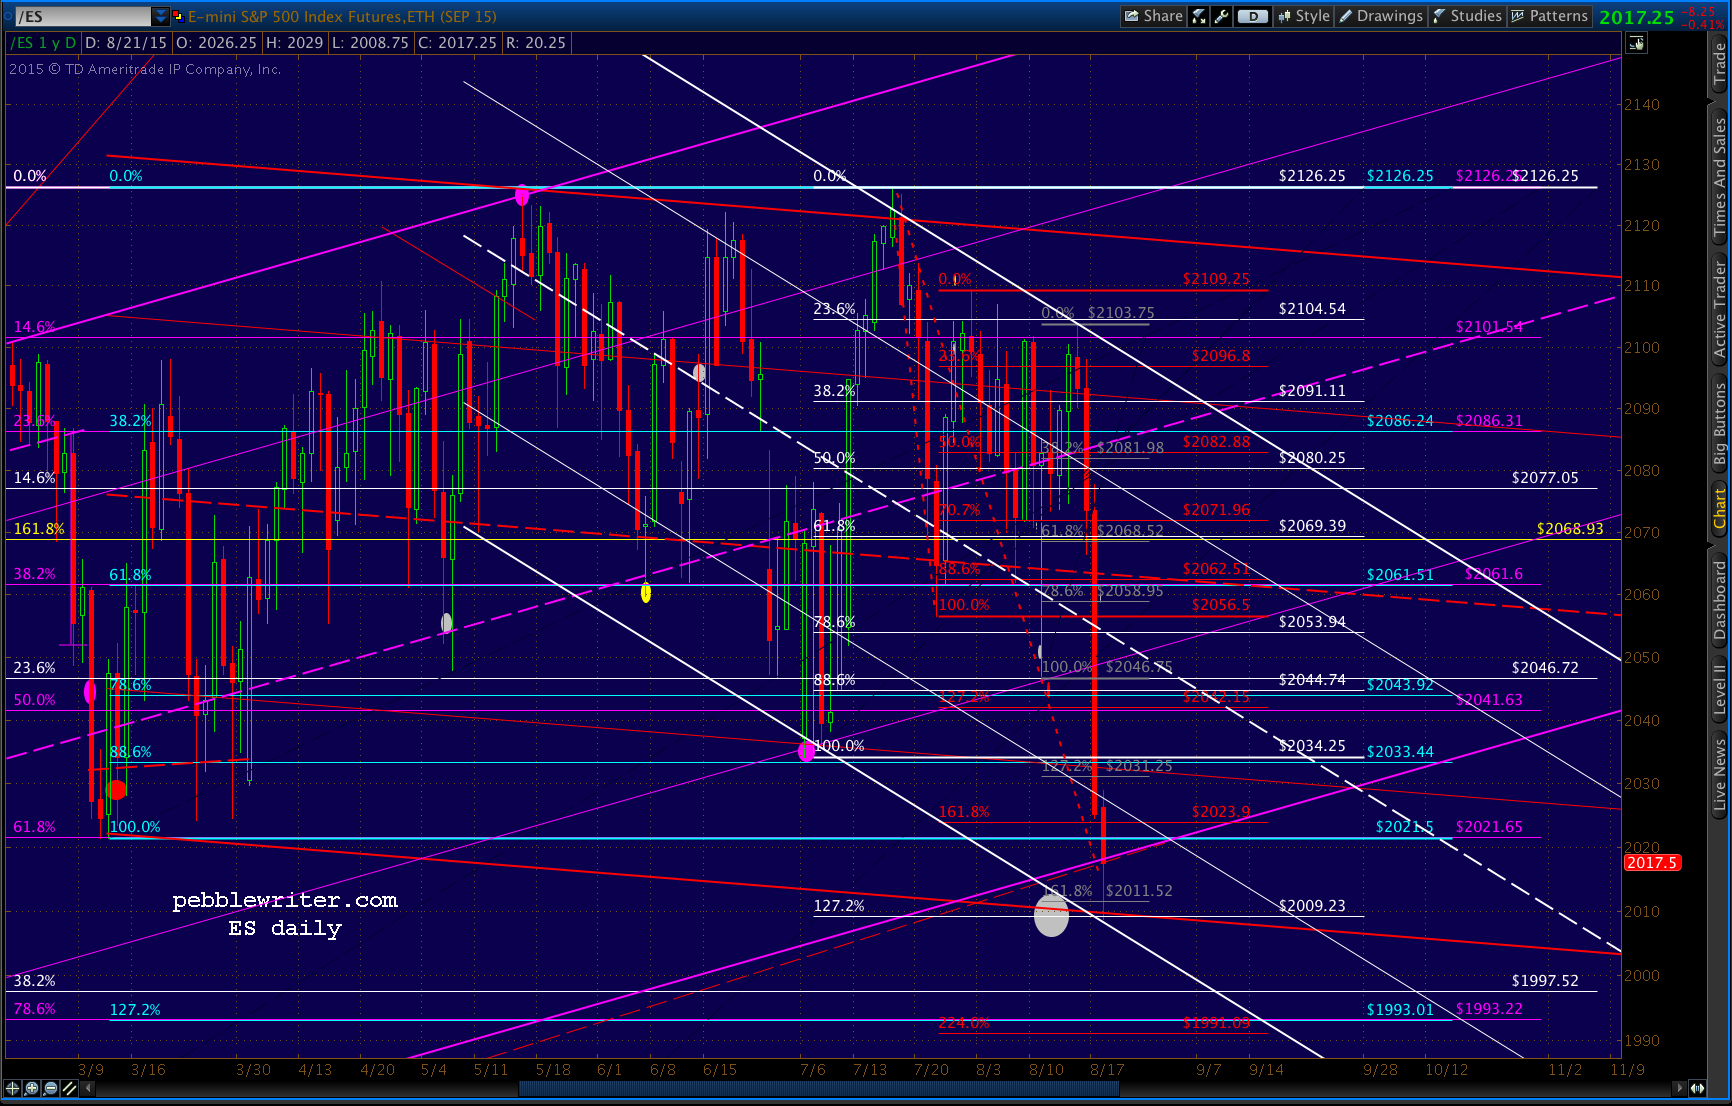 They attempted a bounce a couple of hours ago, but no dice.
A reminder, though 2020 is marked, 2013-2015 is just as valid and has been marked before on past charts. It works better from a big picture standpoint.
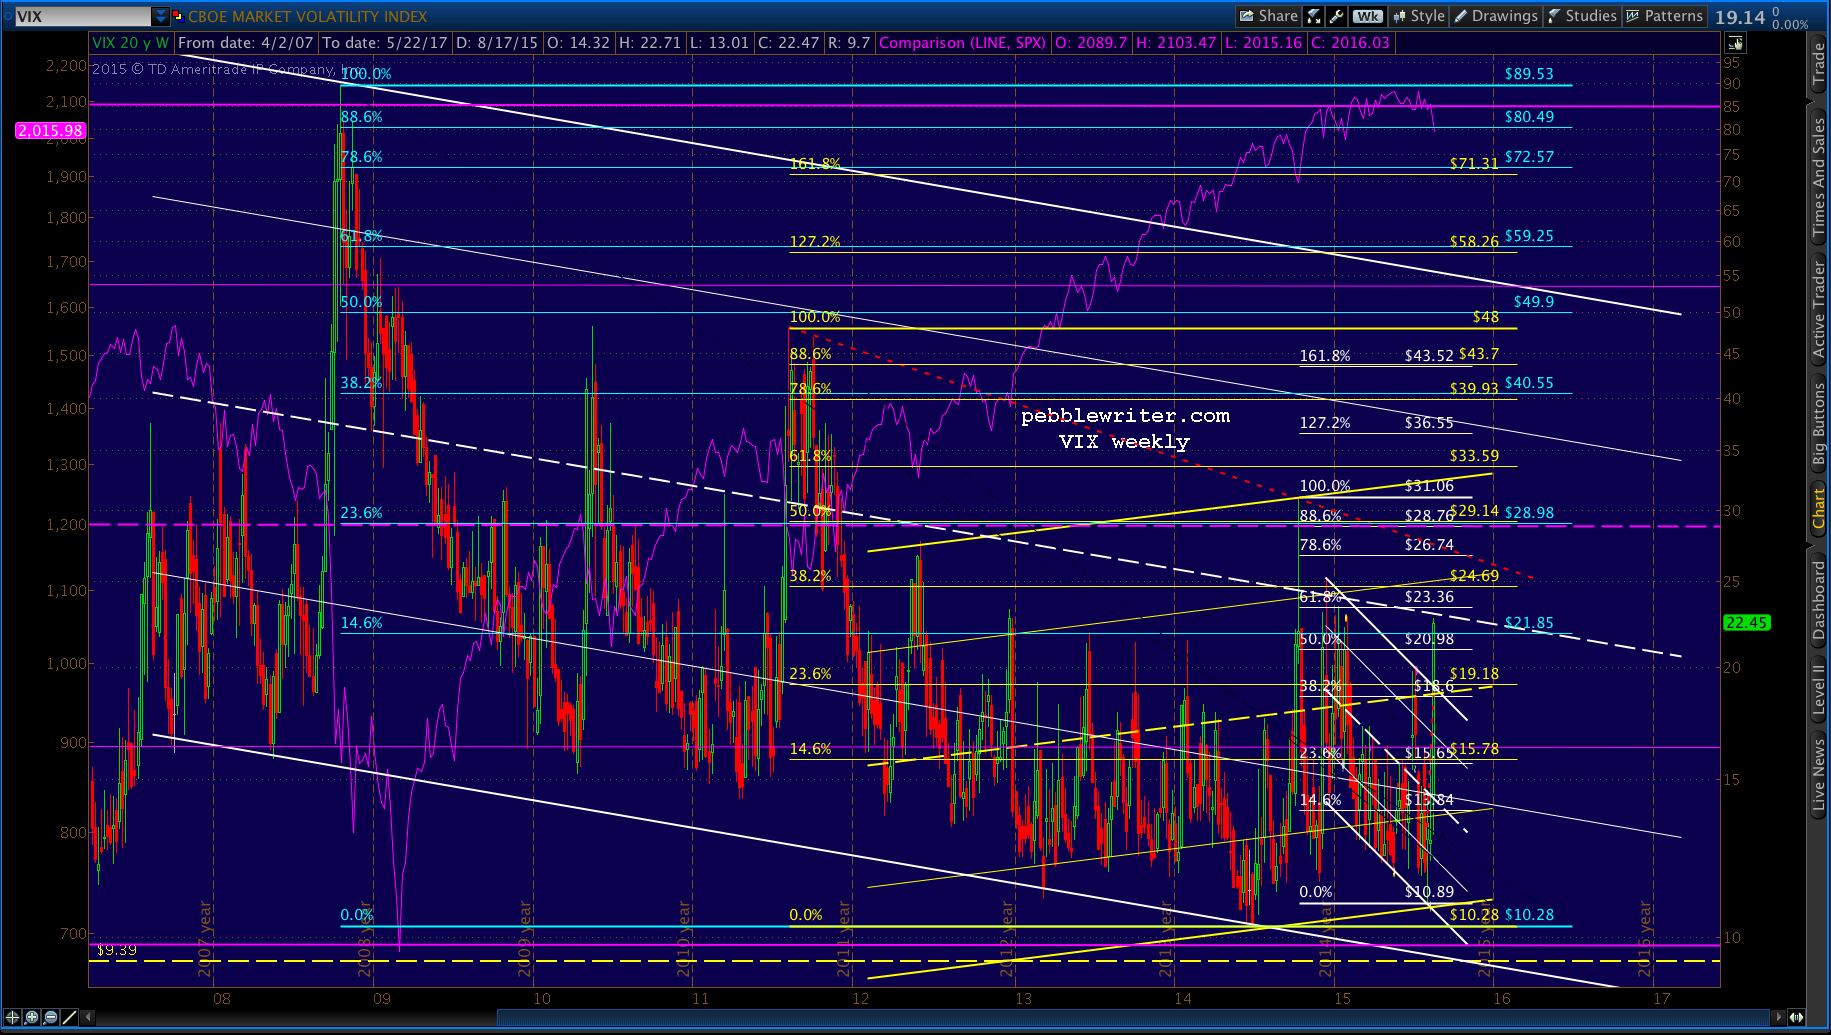
 Pay special attention to VIX, which appears ready to break out.
 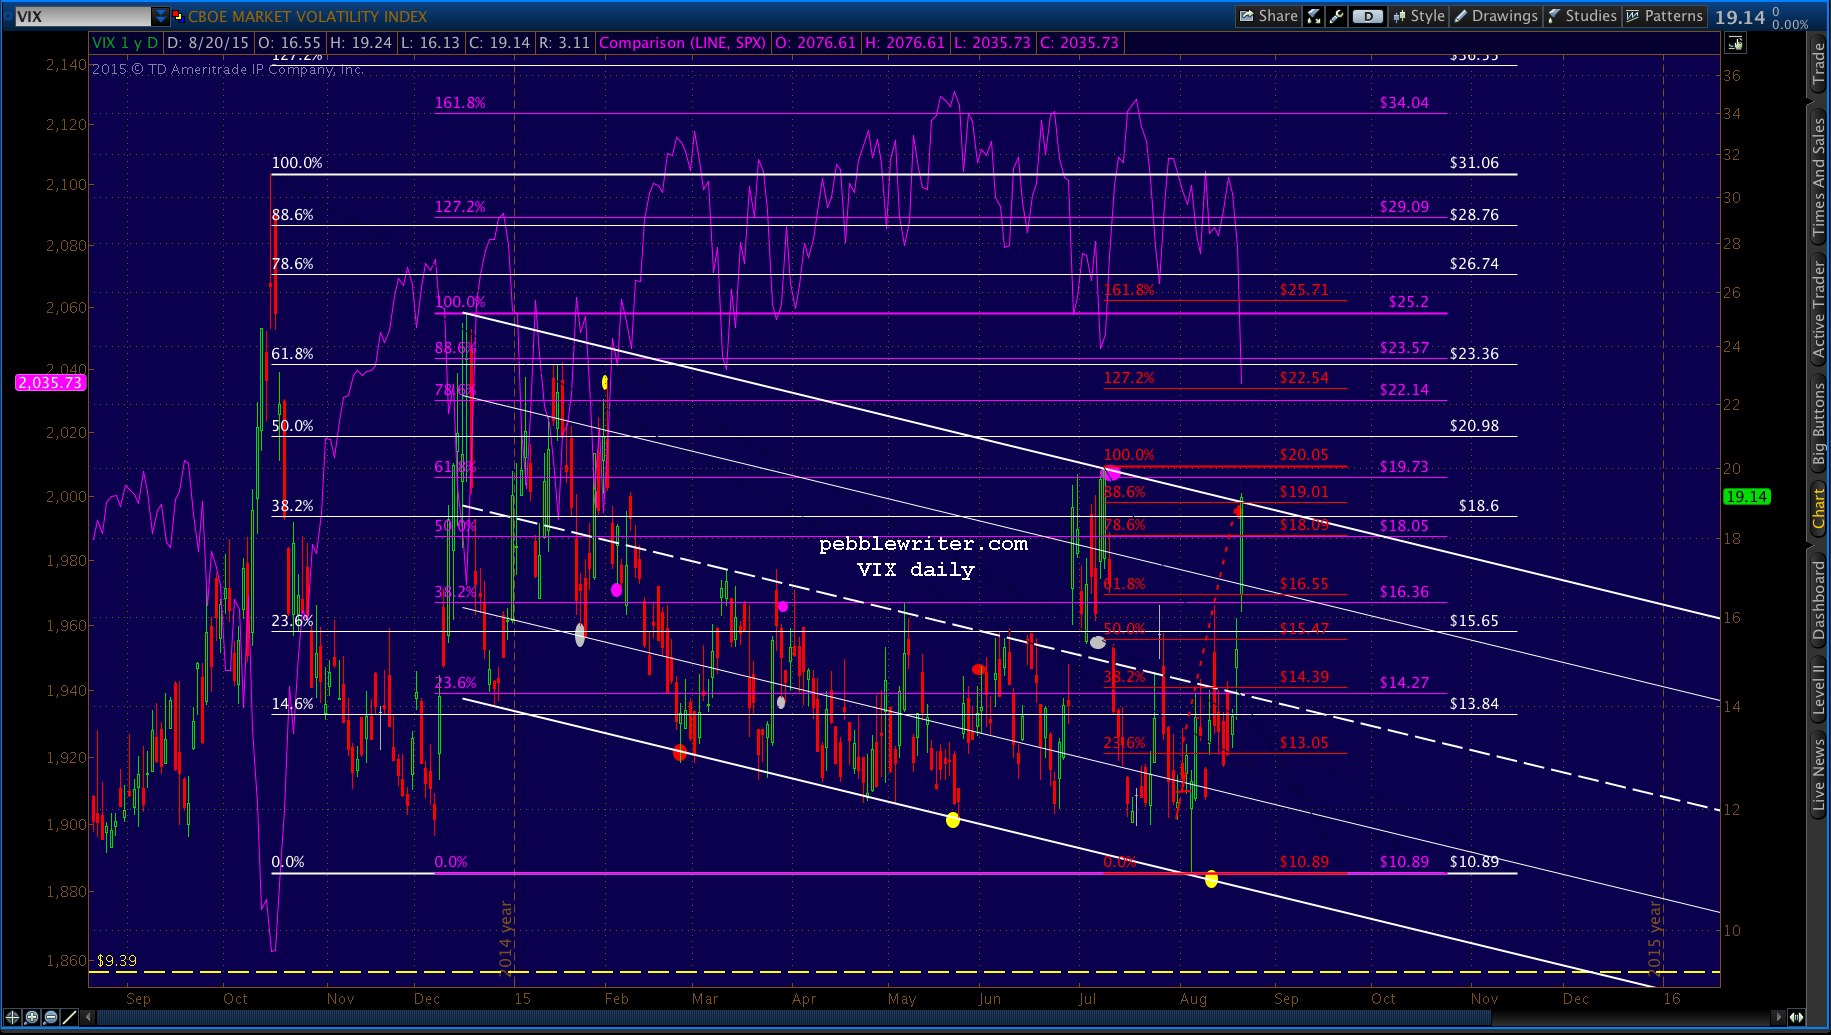 UPDATE: 9:33 AM
 UPDATE: 10:40 AM
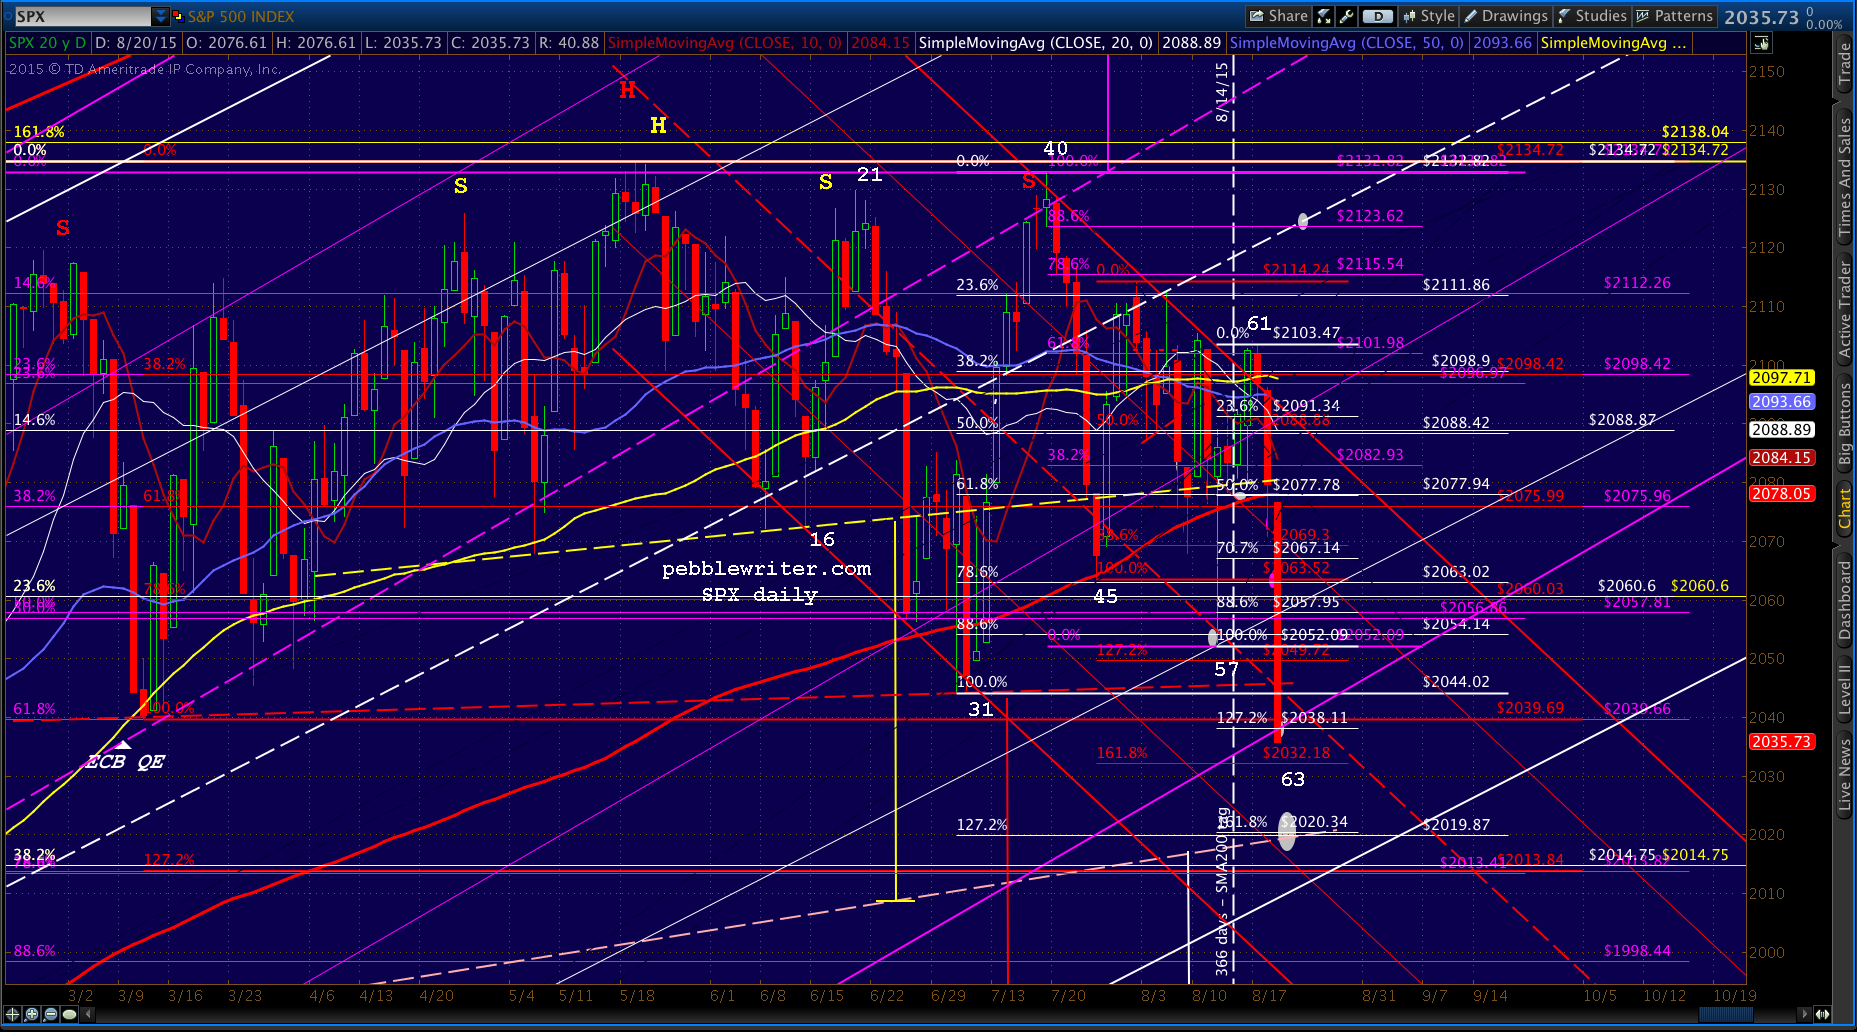
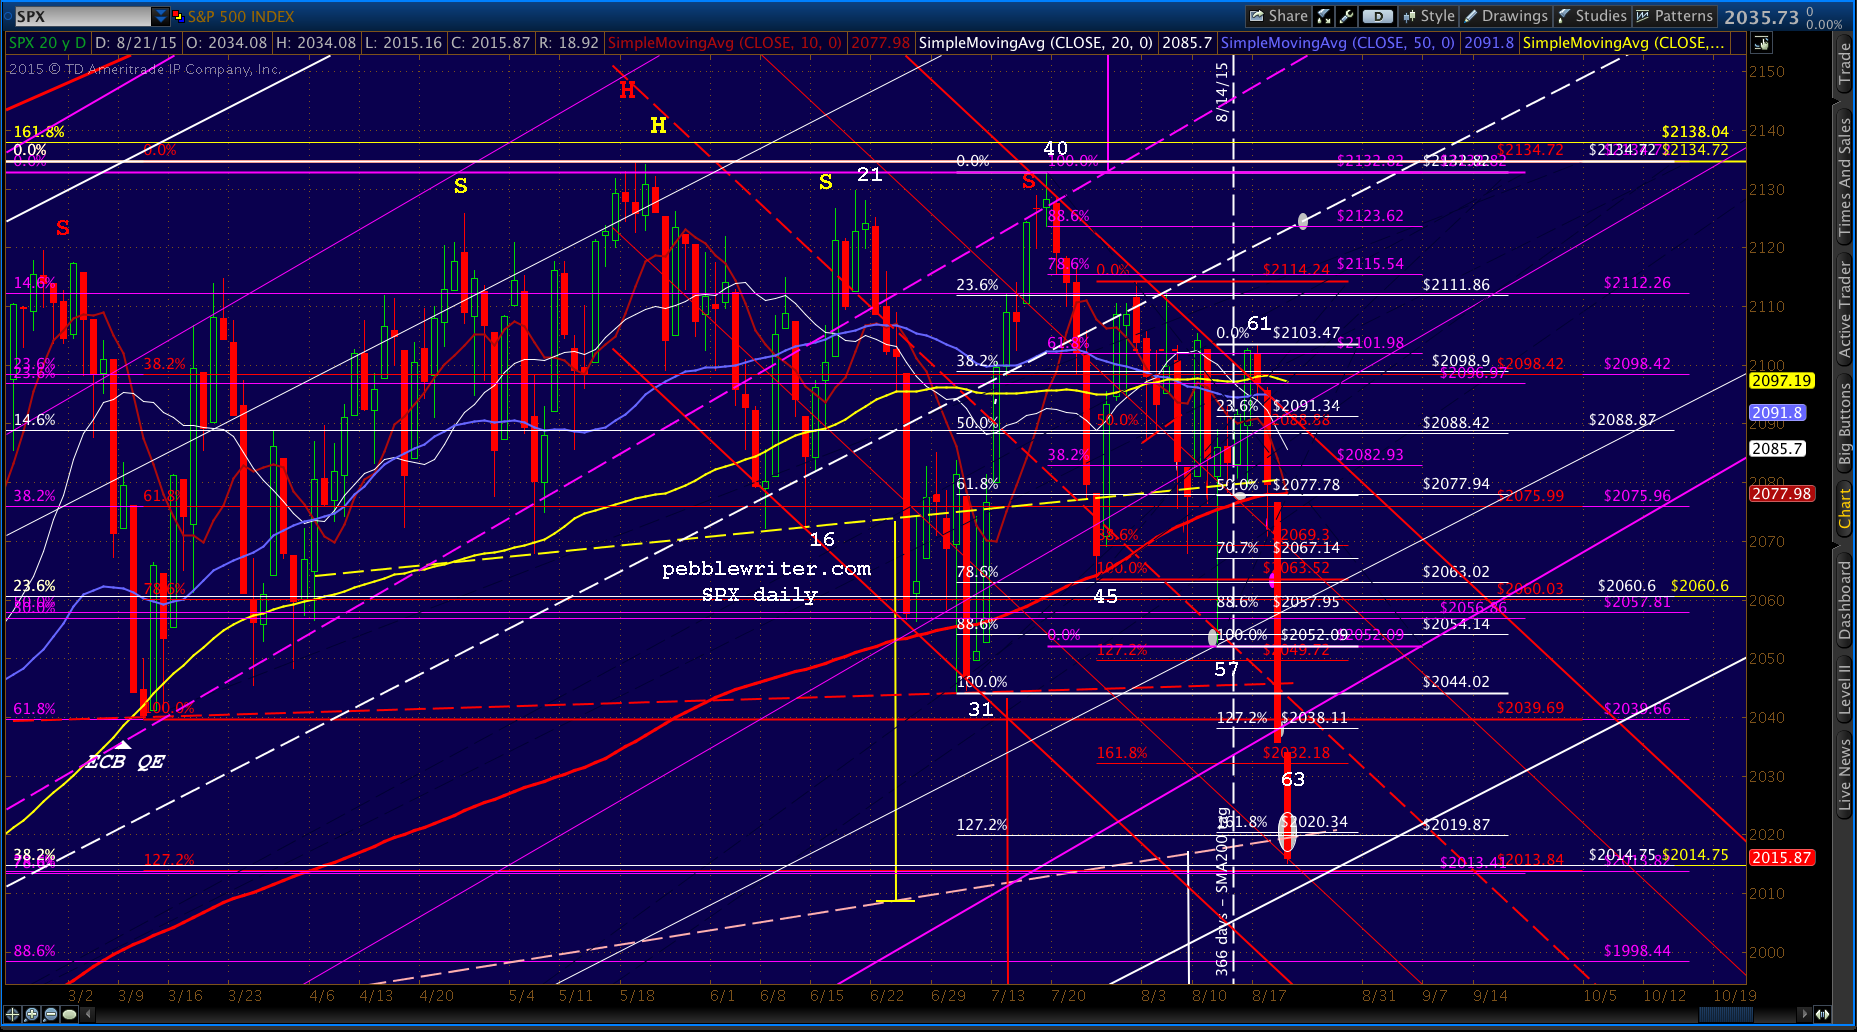
SPX slipping a little past the neckline, but should find channel support here. If you were stopped out at 2020 or rode SPX down to 2014.75 and stopped out, this should be solid support.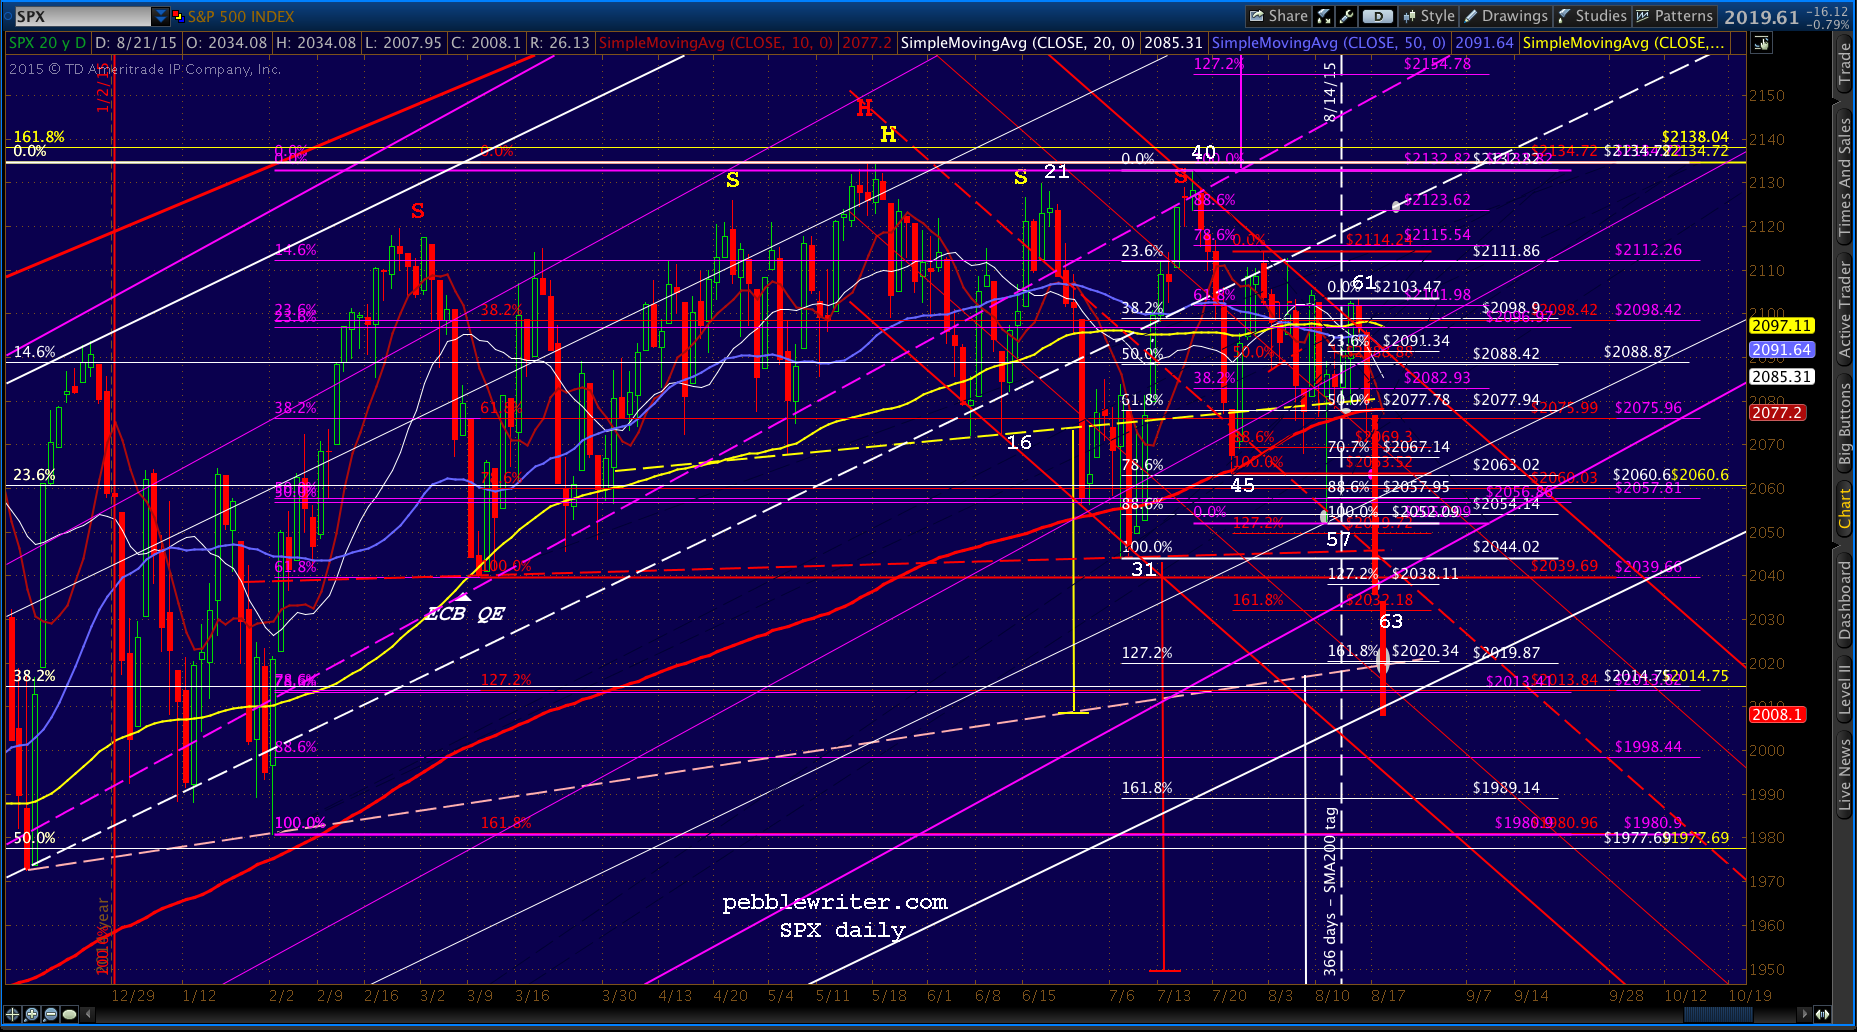 I’d be more confident if we had good Fib support here, too. The closest is the purple .886 at 1998.44, followed by the white 1.618 at 1989.14 — completing the white Butterfly Pattern.
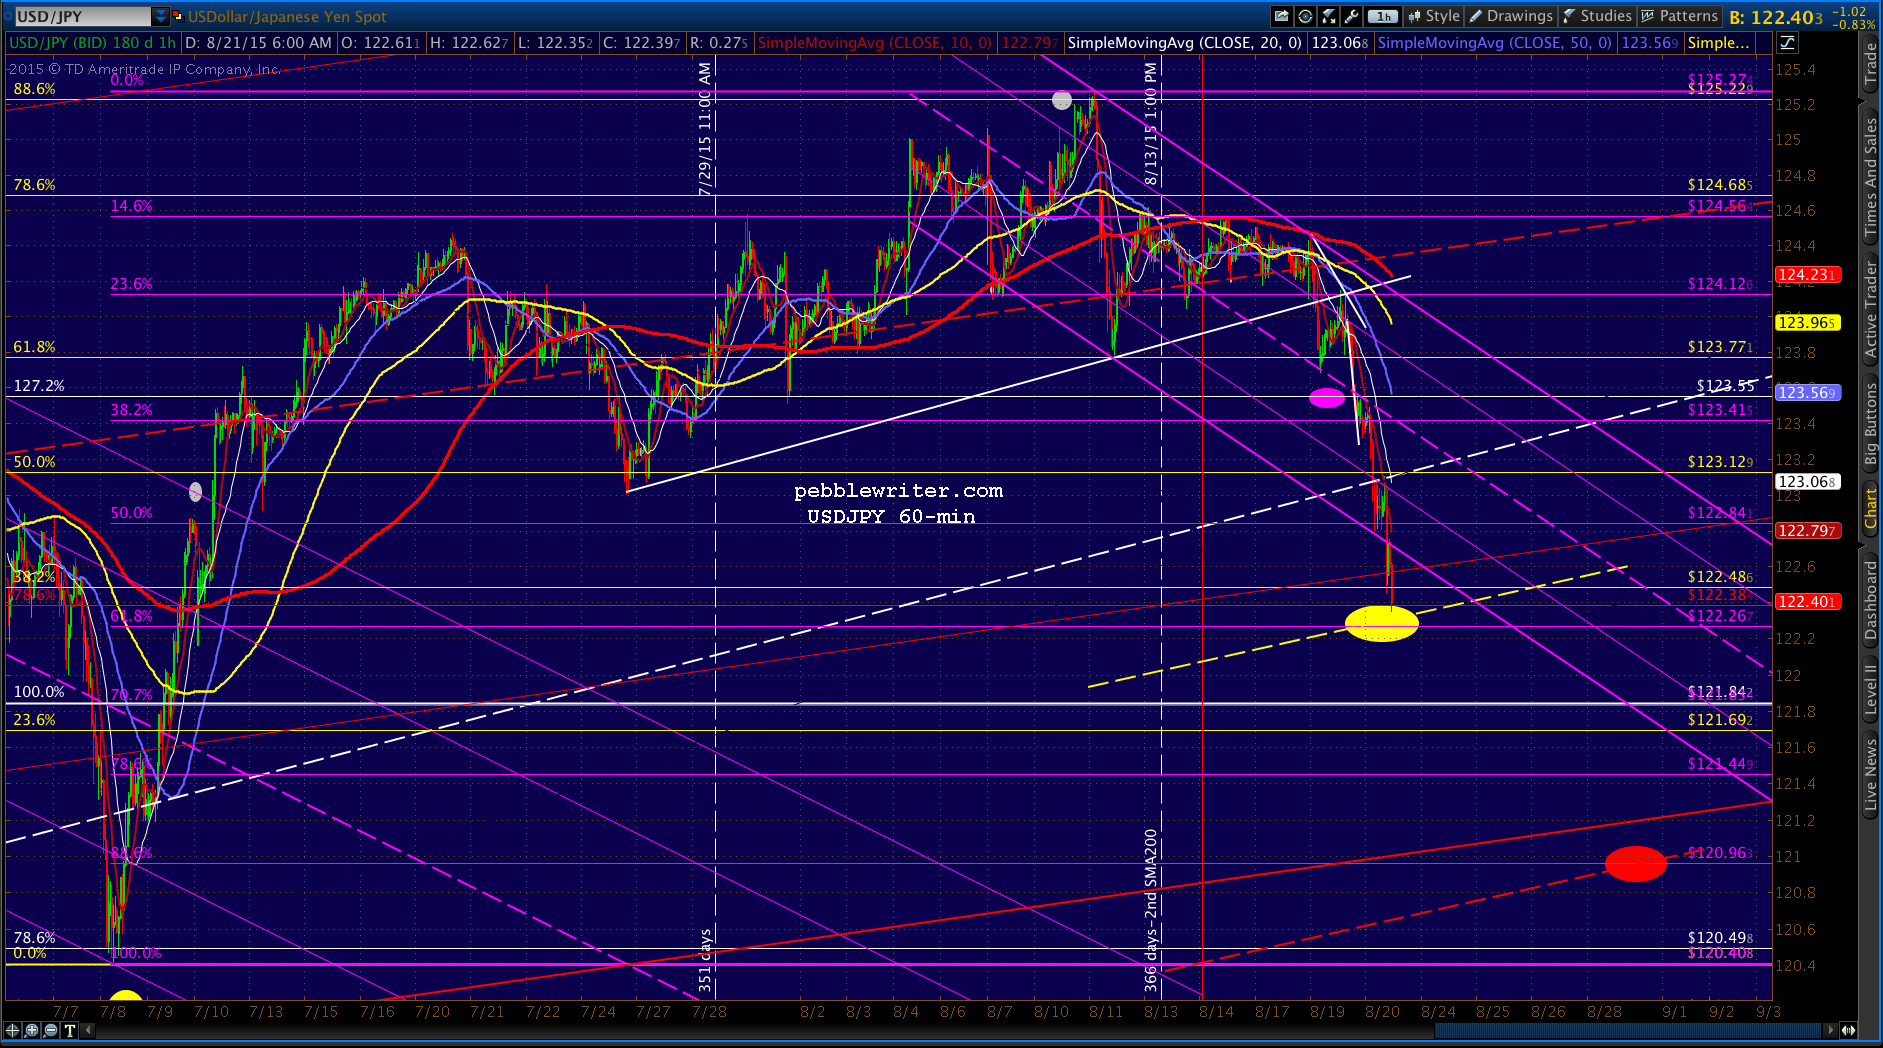
The key remains NKD which, when it completes the H&S pattern at 19210-19,240, should prompt the BoJ to step in in a very big way.
 USDJPY, SPX and CL will keep slipping until that happens. Also, note that the SMA200 itself is at 19,140, so it’s quite possible we’ll see a slip beneath the neckline to that level.
UPDATE: 11:08 AM
NDX just tagged the neckline, another few points till SMA200.  USDJPY tagging the .618 and SMA100.
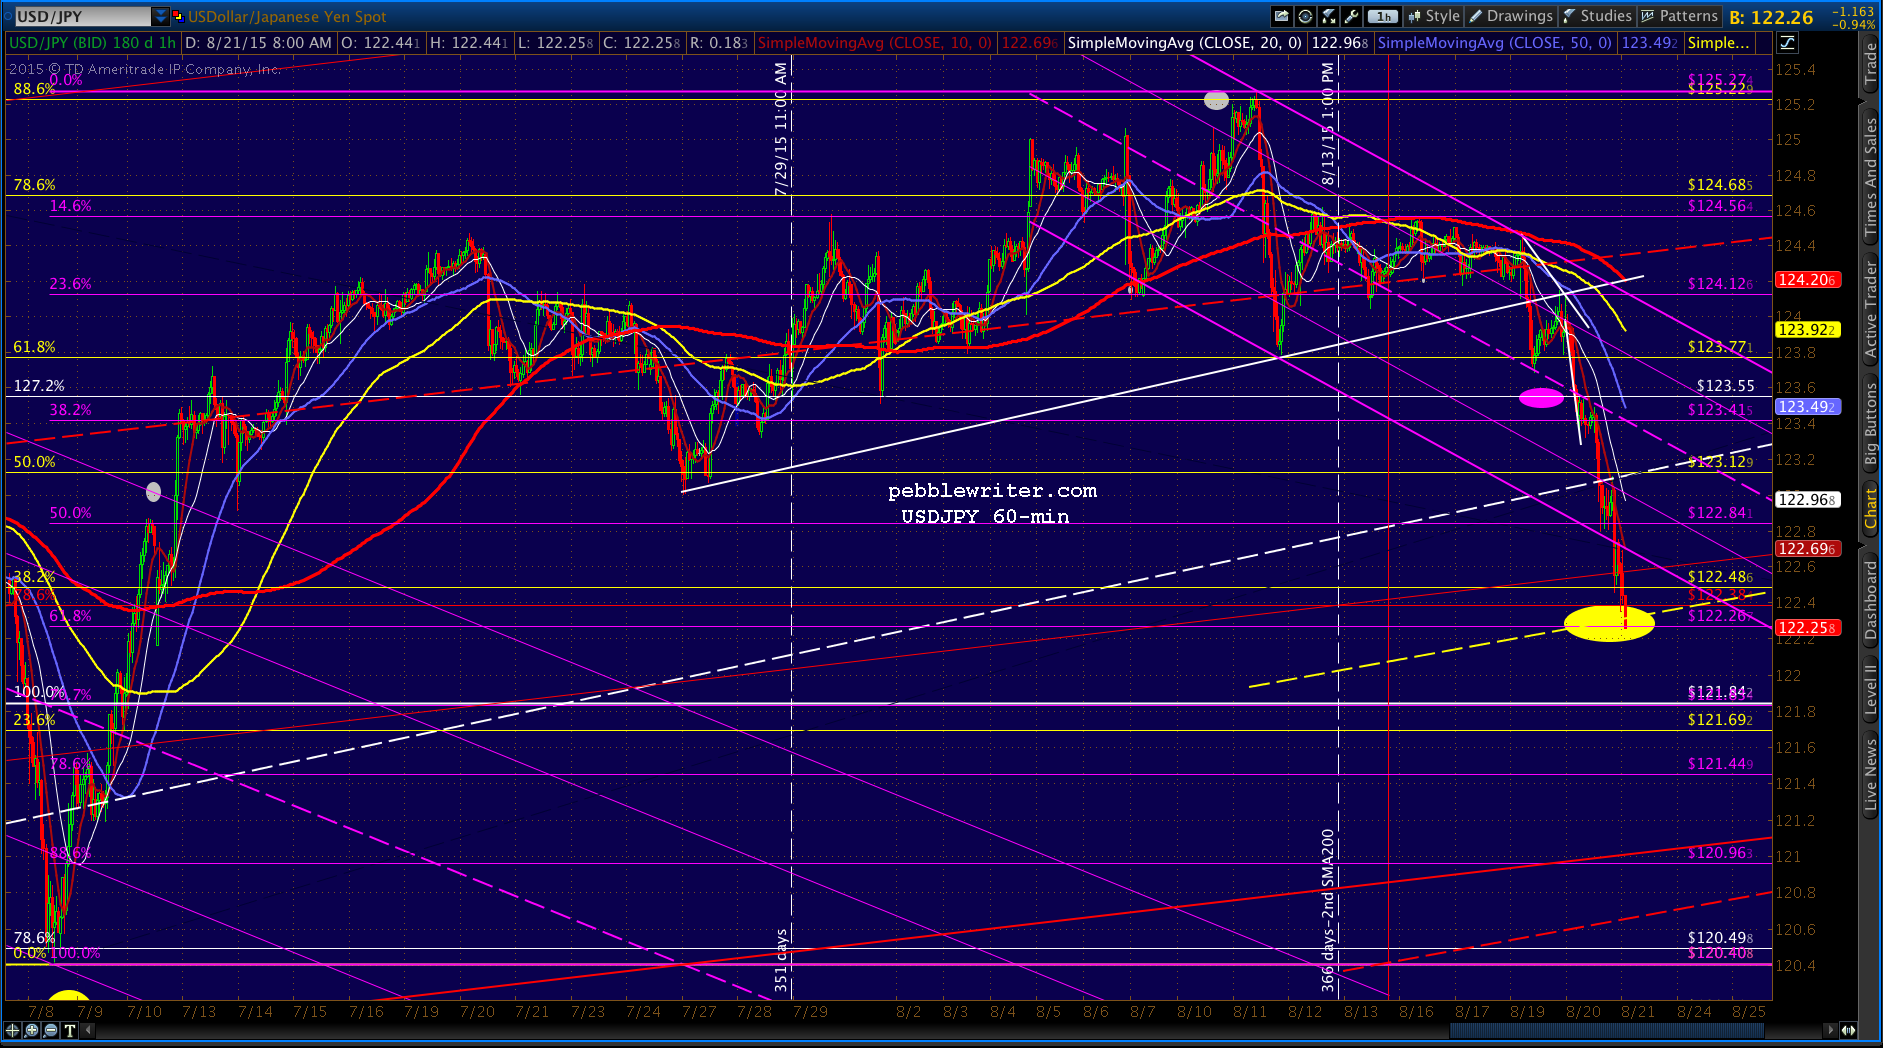 BoJ has to be sweating bullets right about now…
Would be a strong buyer at SPX 1998.44. Would even consider leverage with appropriate stops.
UPDATE: 11:17
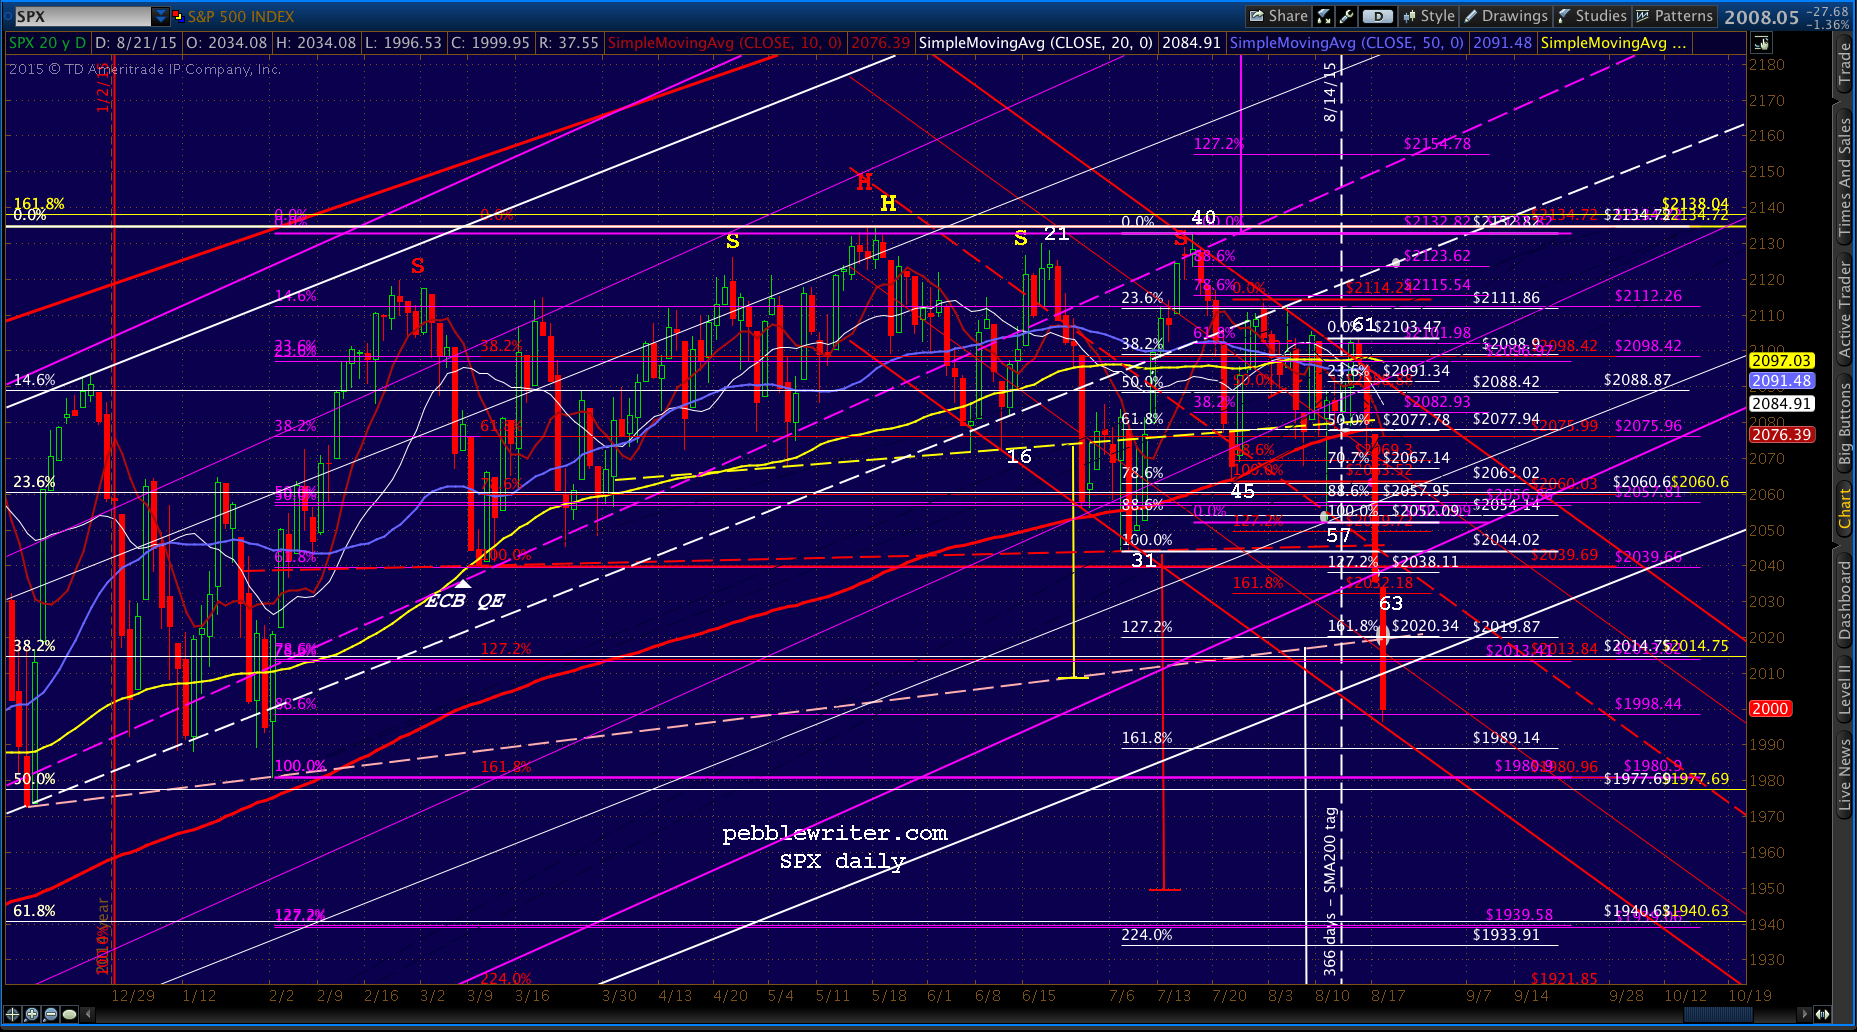 First order of biz is to get back to the white channel bottom, followed by white H&S neckline at 2020.
UPDATE: 1:18 PM
Obviously stopped out on the 1998 long. Will try again here at 1993.50. USDJPY is being propped up at the Dec 8 high (121.84), so no SMA200 move just yet. NKD propped at the .786 of 19049. So, I think there’s another leg down after we get whatever bounce we get.
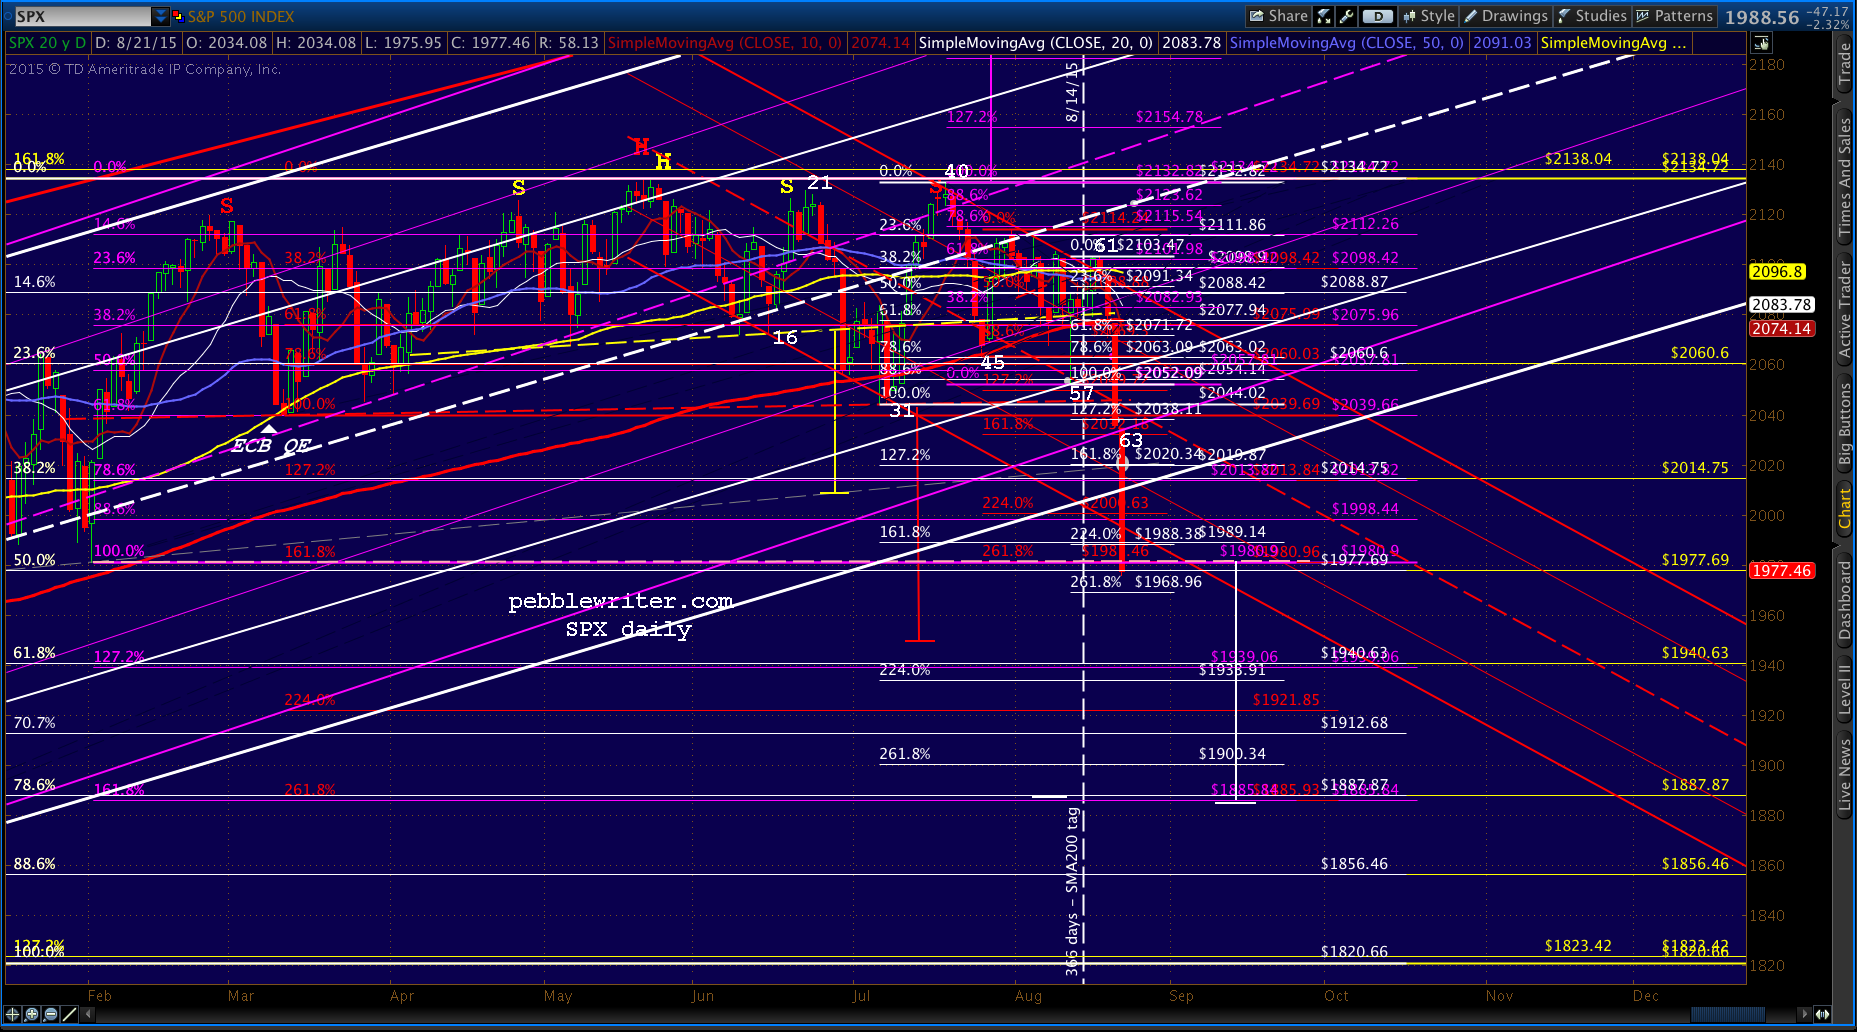
 Next support below 1988.98 is 1980-1981 and then way down at 1940ish. Note the red H&S targets 1950, and the white H&S targets 1887 — also the white .786, the purple 1.618 and the red 2.618. It makes an excellent target if things are allowed to get that far. Of course, it completely destroys all LT bullish channels.
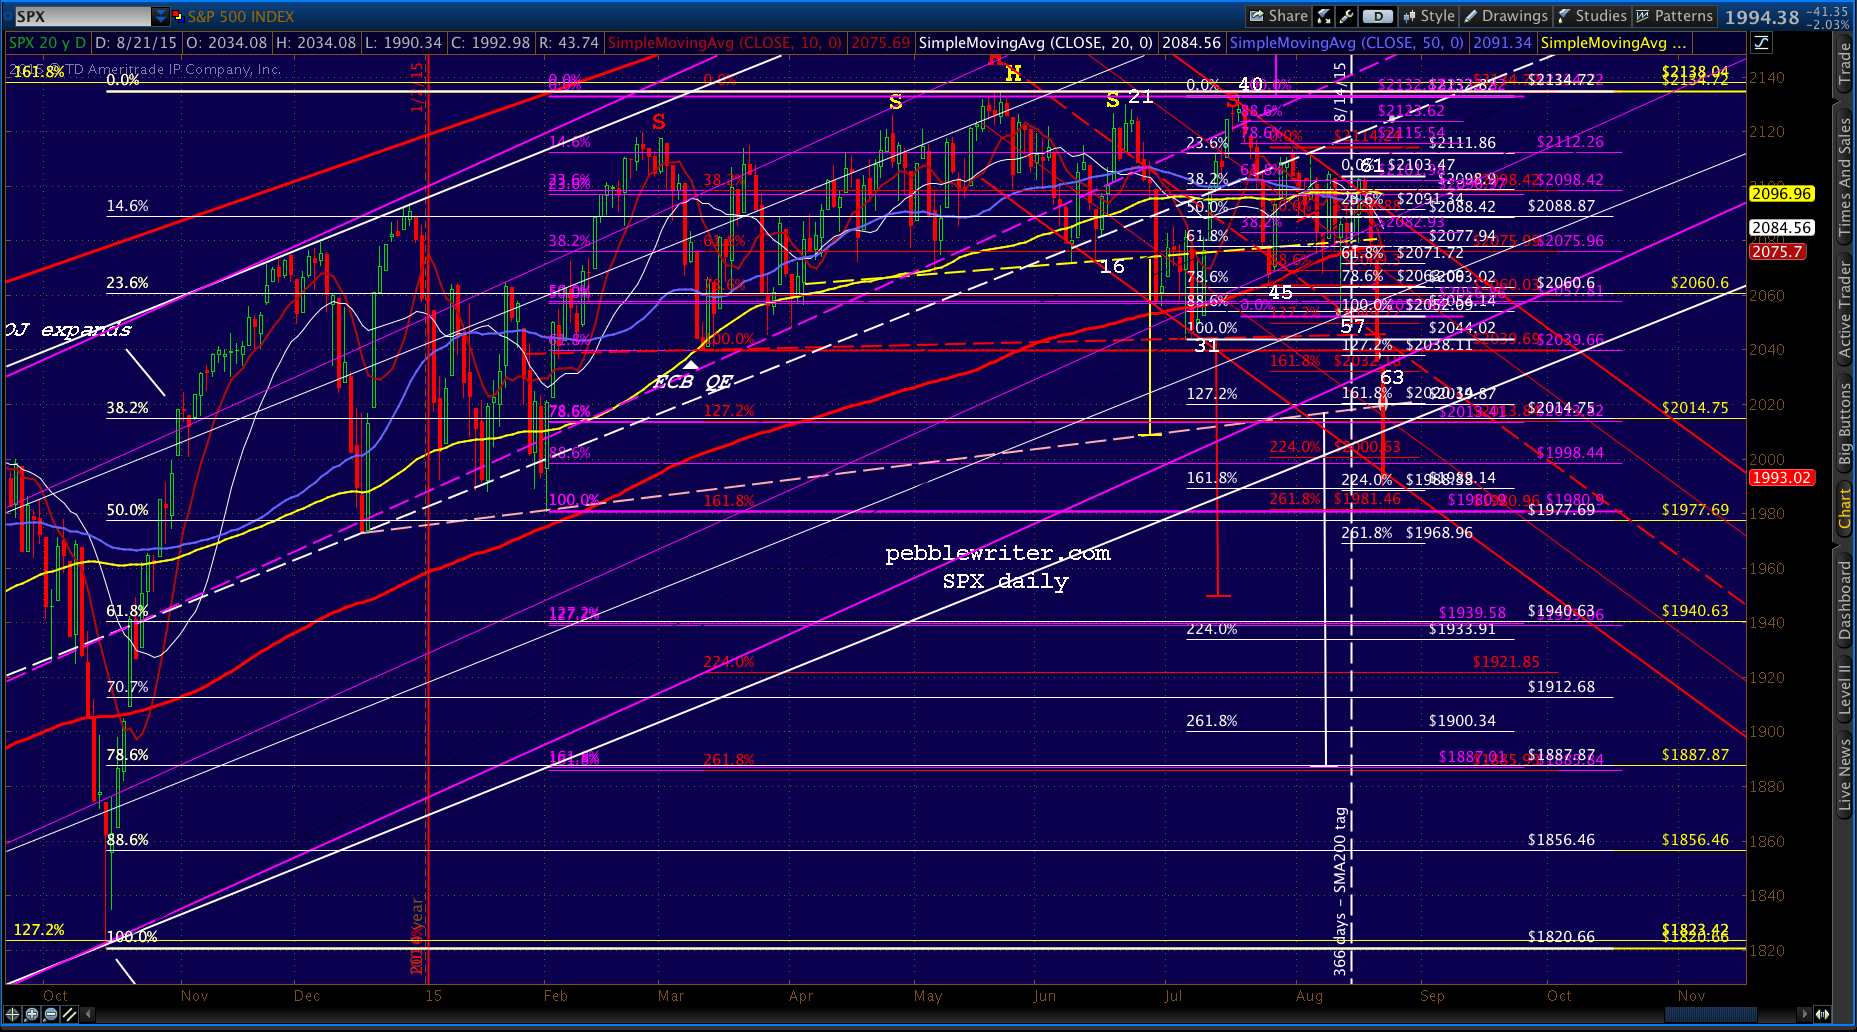
In many ways, 1980 looks quite solid. One measure is how it equates to ES, which is positively screaming 1977.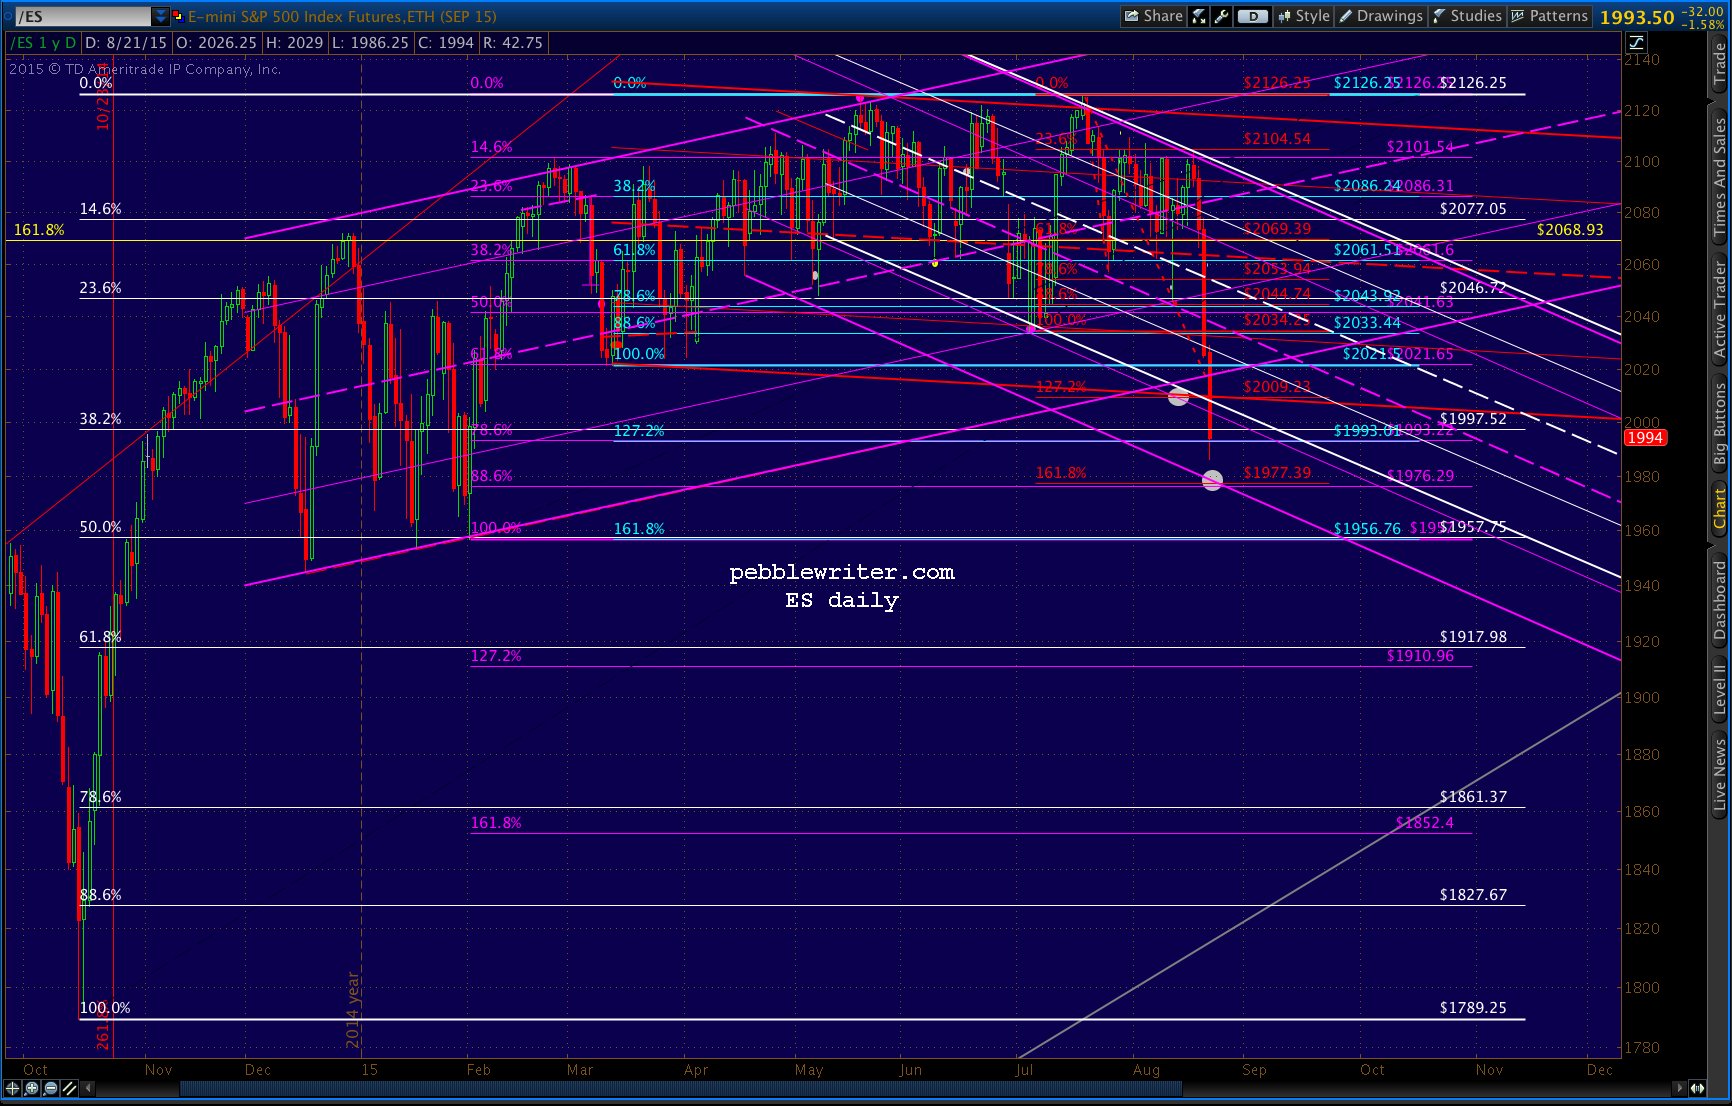 But, be cautious, as ES’ low could come after hours — and, SPX really needs to get back to 2010.40, and preferably 2034 (ES 2017ish) by the end of the day in order to keep the uptrend alive.
UPDATE: 2:53 PM
Apparently not waiting… NKD breaking down again, and ES heading toward 1976/1977. Again, this points to SPX 1977-1981.
 If it reverses at 1981.46, the resulting H&S Pattern would target the white .786 at 1887 we pointed out earlier.
We’ve taken a lot of stabs at it already today, but hopefully folks are keeping their stops where they’re comfortable and keeping an eye on the indicators such as NKD, USDJPY and VIX. This looks like another good place to try a long position.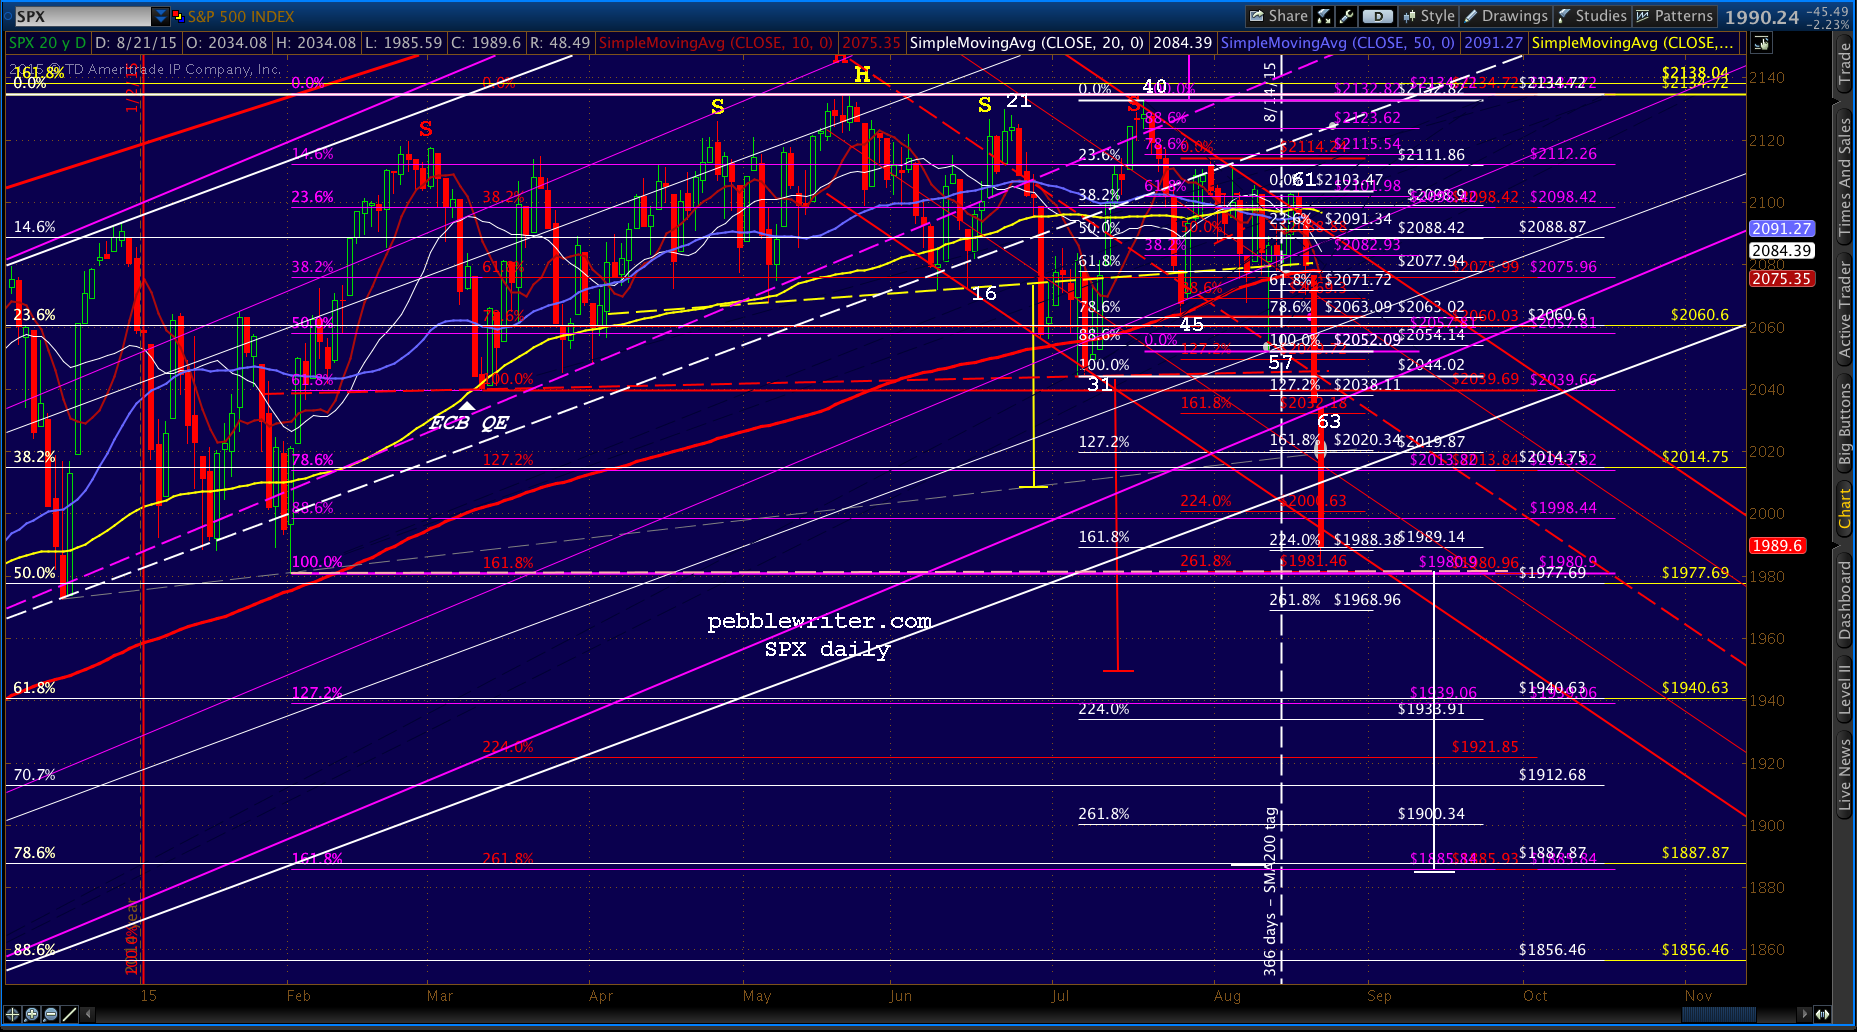 UPDATE: 3:16 PM
Comments
2 responses to “End Days”
Pebble,
Is there any reason we shouldn’t be looking at the drop from 2134.28 as an expanding leading diagonal? All five waves look to be abc wave moves. The declining trend line across the lower highs and the trend lines under the lower lows are well contained with very few breaches with a pretty good uniformed look to it. If it is wouldn’t it be followed by a deep retracement challenging the highs? Thank you for your response.
My first advice is to never take Elliott Wave advice from me. Having said that, your suggestion is completely consistent with our analog. The only potential disagreement between the two is regarding the “deep retracement.” The analog suggests that today’s meltdown is a means to an attempt at (and possibly achieving) new highs, not just a deep retracement.