

NEW PROMOTION !
Following our recent results, several members (as well as a few lurkers) have inquired about another annual membership promotion. We got a great response to the last one, so we’ll give it another go.
From August 25-29, we’re offering Charter Annual Memberships at $950. It works out to about $2.60/day, less than most of us spend on a cup of coffee.
It’s $550 off a regular annual subscription, and a whopping $1,150 off a monthly subscription at the current rate of $175/month (slated to increase to $200/month at the end of the year.)
Best of all, your rate will never increase for the life of the site for as long as you remain a member. As one of our long-time members who recently renewed at $600 would tell you, this aspect alone makes this a great offer.
Note: If you’re already a monthly/quarterly/semi-annual member, we’ll add your new year to your existing membership. Your annual price will still be locked for life.
We are also increasing referral incentives during this promotion. Send a friend our way, and we’ll credit you $250 when they subscribe to an annual membership.
If you’re a new member, ask a friend to join too and split the savings. There’s no limit, so if you have at least a few friends you could end up with a free membership.
* * * * *
If there were any doubts about the relationship between the USDJPY and SPX, yesterday’s price action should have laid them to rest.  As we’ve maintained for the past couple of years, the yen carry trade is the single most powerful influence on stocks’ unending rally and has been since October 2011.
Knock the ever-depreciating yen out of the equation, and — as we saw yesterday — the “markets” start behaving like real markets. They actually begin to reflect the deteriorating fundamentals underpinning over-inflated prices.
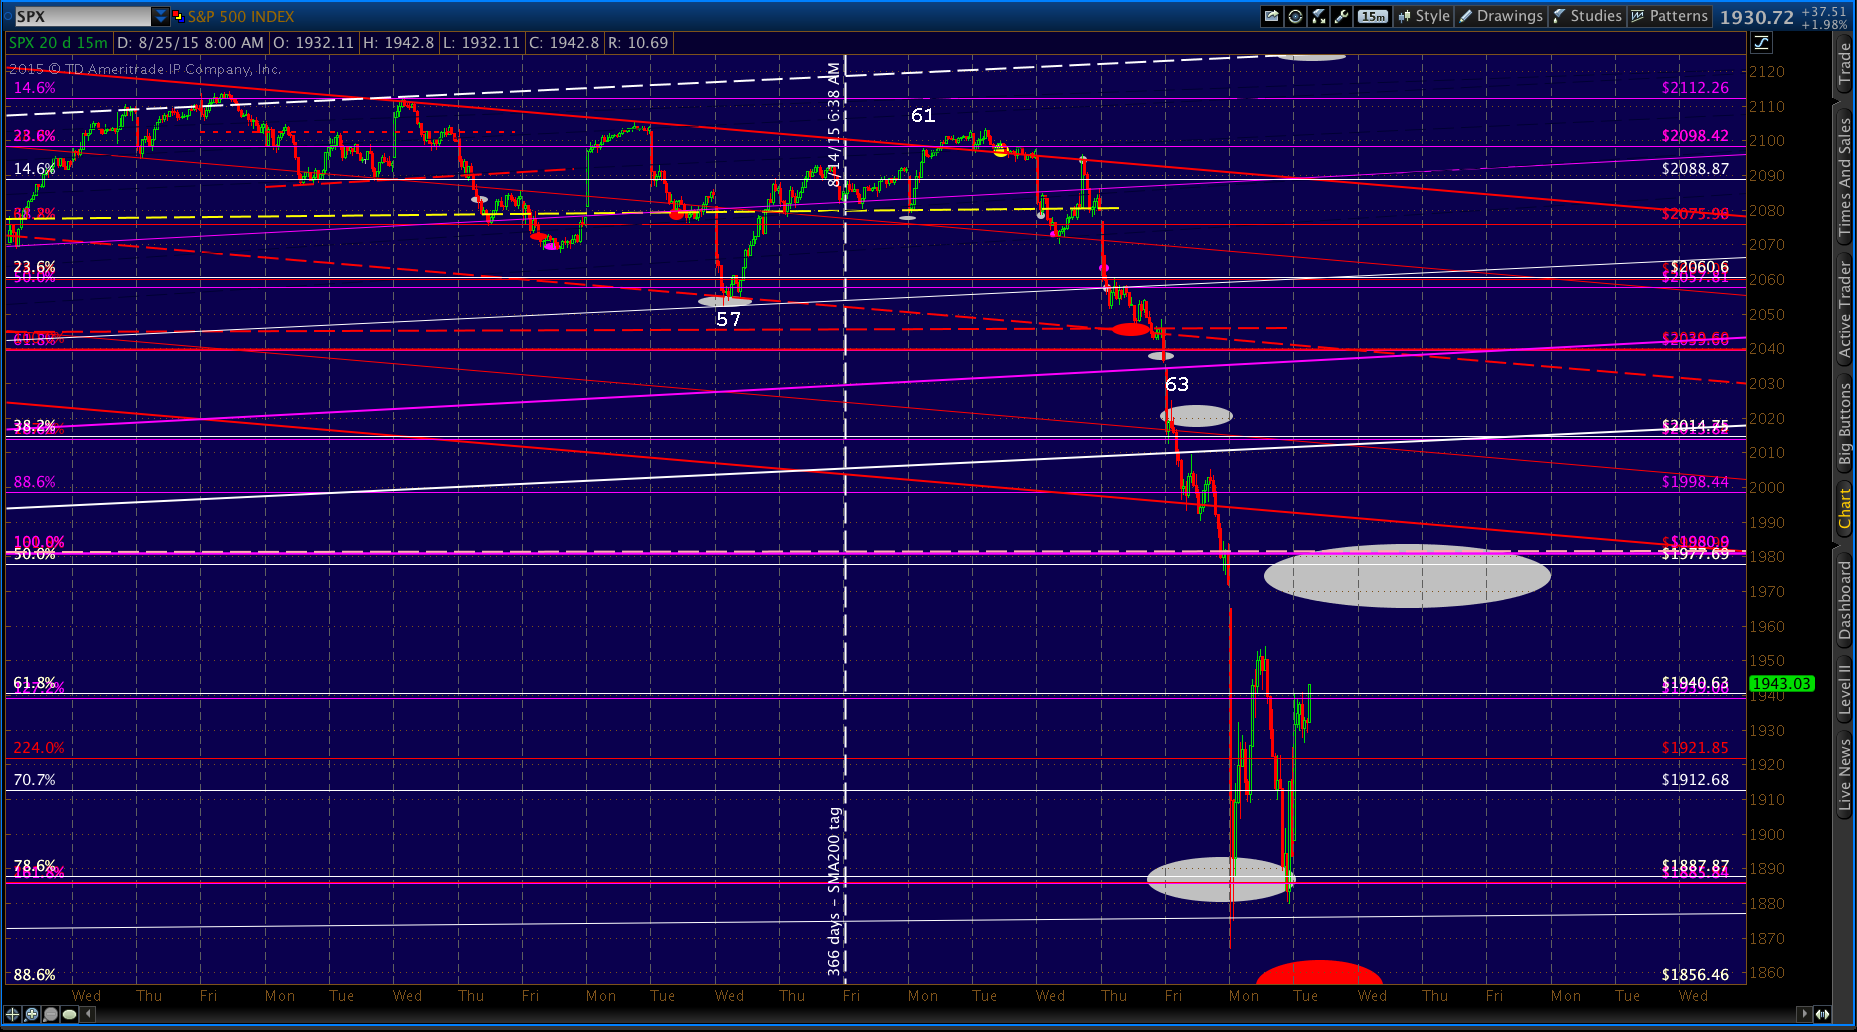
We could leave it at that. But, it’s important to note that yesterday’s mini-flash crash was no less scripted than the past five years’ rally. The opening plunge took SPX slightly past our initial downside target of 1887.87, and landed NKD and USD JPY just shy of our targets for them. continued for members…
As the chart below clearly shows, SPX made no major moves higher without the support of a rising USDJPY (depreciating yen.) We’ve provided detailed charts in the past that demonstrated how USDJPY breakouts and bounces off support helped SPX overcome key technical resistance.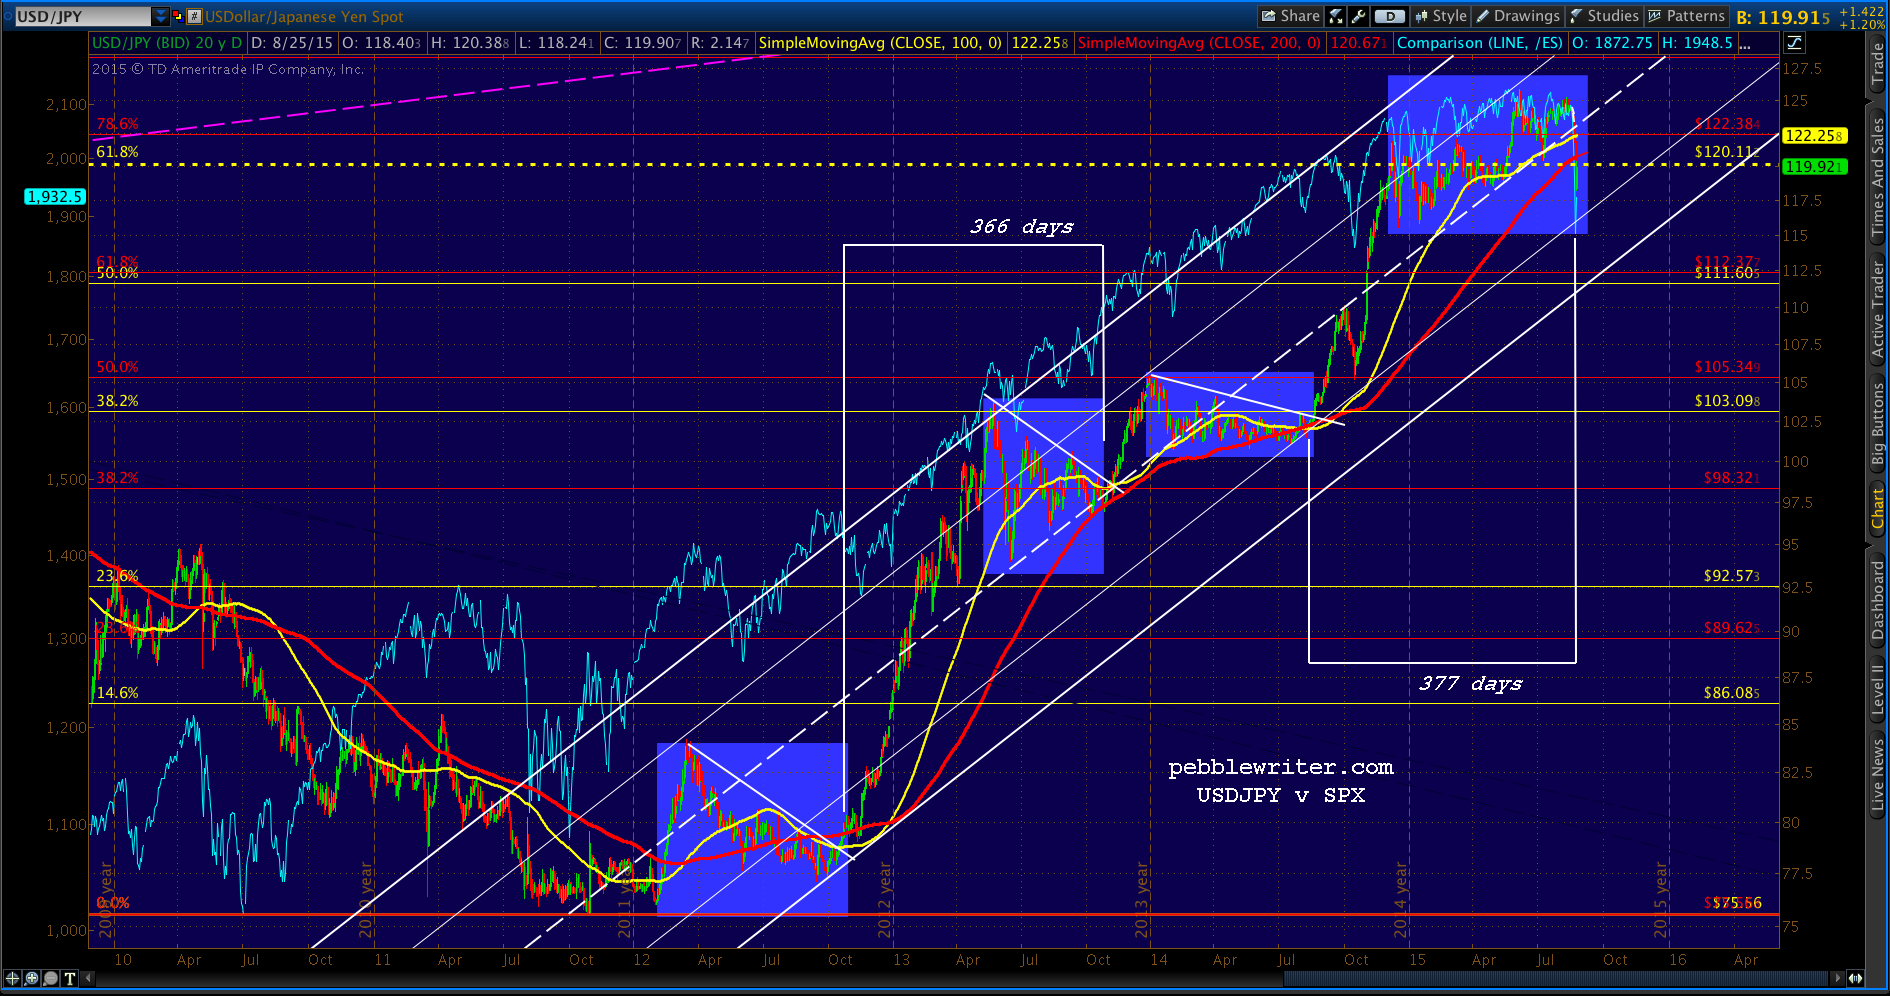 Our recent analog helped us refine that understanding of the relationship, demonstrating that it was moves through USDJPY’s 200-day moving average that accompanied the breakouts and gave stocks the all-clear. The timing of these breakouts was so similar as to suggest a pattern, which became the backbone of our analog.
In the 2012-2013 version, it took about 366 days for USDJPY to retest the SMA200 after initially breaking out. This time, it took 11 days longer at 377 days. The extra time involved made for a more severe decline than if it had happened as scheduled on Aug 13. Note that there were virtually no bounces along the way down — a very unusual occurrence.
The other phenomenon, which initially earned me plenty of sideways glances from my more traditionally-minded fellow analysts, was the relationship between USDJPY and CL. I’m working on a new post focusing solely on this, as it believe it’s a key to the way forward for all markets. Here’s a taste: Bottom line, what’s next for our analog? The initial timetable indicated a breakout for SPX 21 days after USDJPY tagged its SMA200, which would be September 3. The most significant breakout on our radar would have to be a push through SPX 2138. This would mean a 205-pt (10.6%) move from current prices (1933) in the next 7 sessions beginning tomorrow.
That’s 29 points per day, very reasonable given recent developments. Should we get a central bank easing (from someone other than the PBOC) it could happen much faster than that.
On the other hand, that doesn’t take into account the fact that yesterday’s SMA200 tag was 11 days late. Should we start counting from yesterday, adding 21 days takes us to Sep 14, it has the added benefit of including Labor Day, Sep 7, when cash markets are closed. Holidays have been very commonly used to help SPX get past strong resistance (e.g. New Years for SPX 1823.)
The extra time would obviously also make for a less frenzied rebound — equating to about 16 points/day.
My hunch is that we’ll probably see SPX split the difference, with a return to within striking distance of 2138 rather quickly, and the Labor Day holiday being used to leap past it. Sep 11 looks like a key date on several of my charts, which is close enough to Sep 8 to make that week look like a likely prospect.
This all presupposes, of course, that the BoJ sees fit to announce an expansion of QQE, or at least begins to devalue the yen sometime soon. The next Monetary Policy Meeting starts on Sep 14; but, as we saw in Aug 2014, they can start devaluing the yen at any time — with or without additional QQE.
If they don’t…well, we just got a very good taste of what that would be like, didn’t we? I have no problems whatsoever with the idea of a serious correction. But, I have a very hard time imagining the BOJ, FOMC, ECB, BOE and SNB not stepping in to prevent it — whatever that entails.
More later.
* * * * *
SPX’s upside targets today include a backtest of the .618 at 1940.63, followed by a close of the gap at 1970.89. USDJPY has reacted to the meltdown by returning to the safety of the key .618 Fib at 120.11.
 And, even CL has bounced off the white channel bottom, offering additional support.
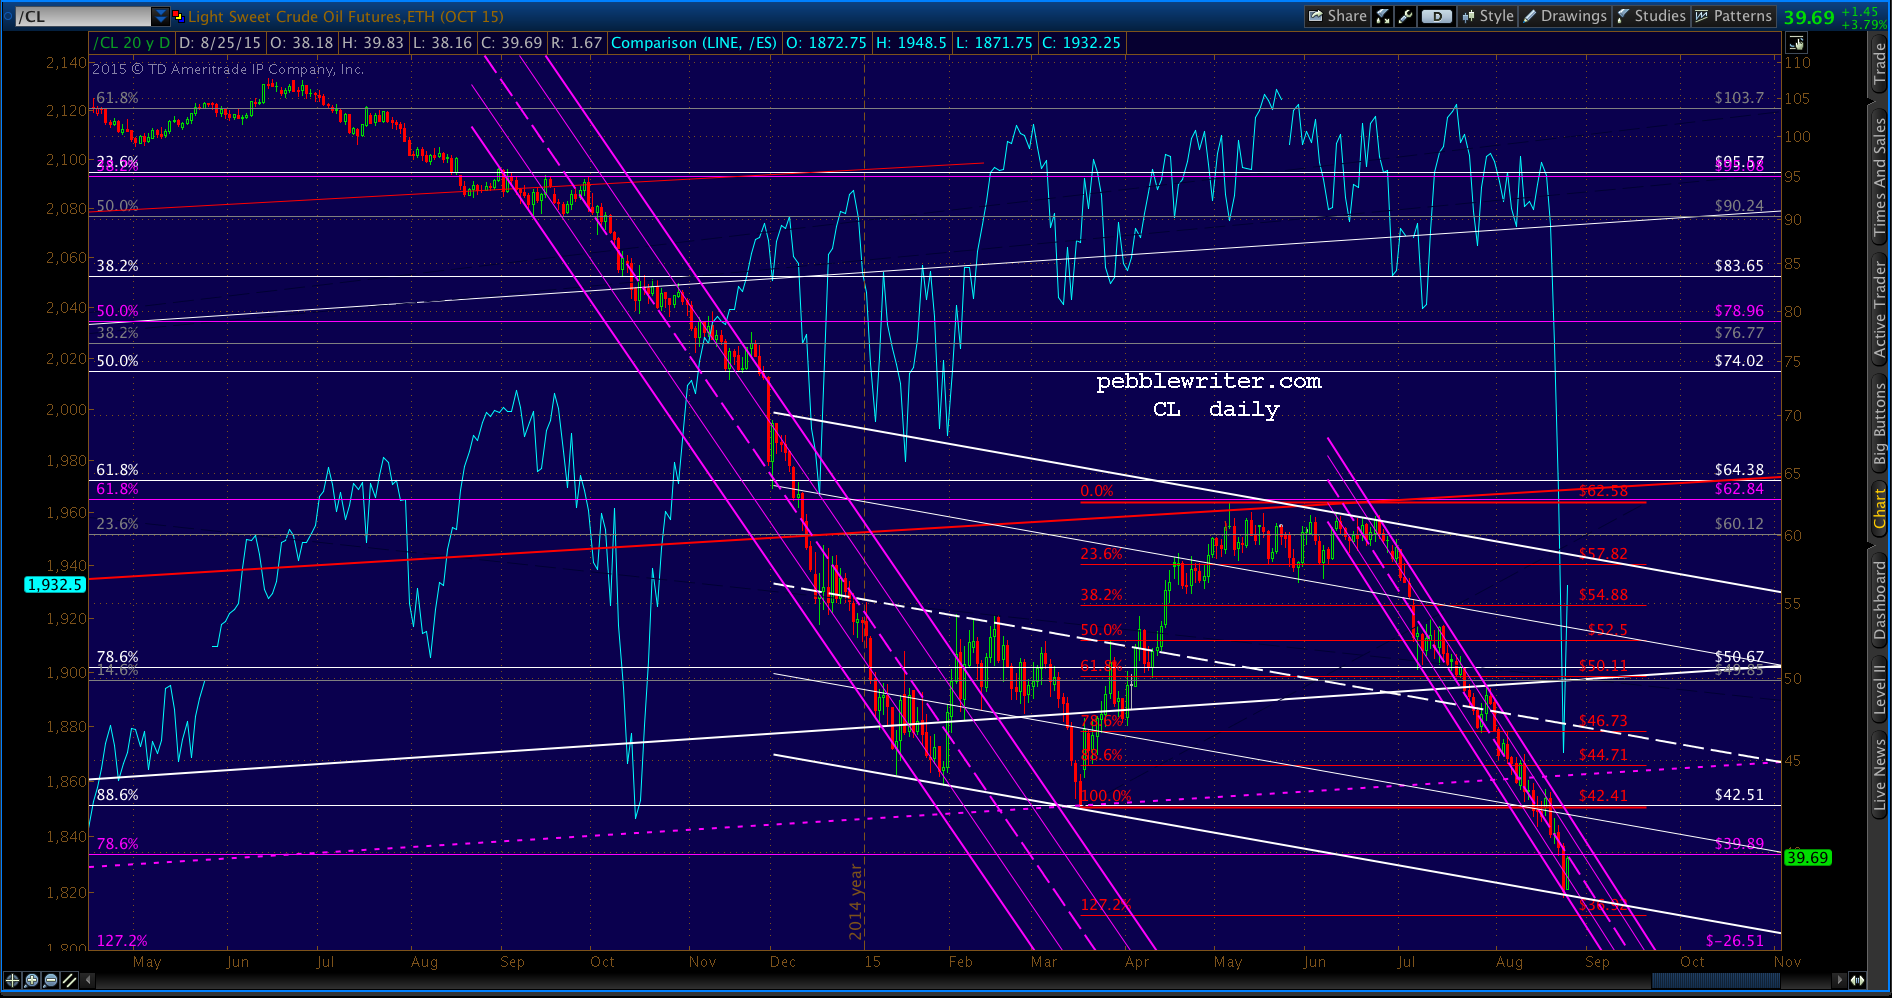 The platform I use for charting – ThinkorSwim – is running as slow as molasses today. So, I’m having a great deal of trouble getting charts posted as quickly as I would like. Bear with me, and I’ll try to get more posted shortly.
UPDATE: 9:47 AM
SPX has successfully backtested the .618 — the first potential turning point. If it reverses here, then the .886 at 1856.46 is on the table. If not, then we should see a continuation up to close the gap and potentially backtest the bundle of key Fibs and horizontal support at 1980ish.
I’d take a shot at a short, but keep an eye on USDJPY and NKD for signs of a reversal.
 UPDATE: 11:05 AM
The algos continue to direct the action, with USDJPY and NKD still in recovery mode. We’ll need to see a breakdown of USDJPY’s channel and/or NKD’s triangle before 1856 becomes anything more than a possibility.

 I see no signs of either breaking down at this point, so presume that we’ll at least see the gap closed as discussed above.
UPDATE: 11:14 AM
 Be aware, however, that neither USDJPY or NKD has truly broken out — merely threatening. So, we could be reversing this long position at a moment’s notice.
 This is getting tedious, waiting for USDJPY to decide. I’ll not keep on posting buy/sell recommendations based on which side of 1940.63 SPX bounces on next. Above it, the target is 1970.89 – be long. Below it, the target is 1856.46 – be short. Follow USDJPY and NKD for indications.
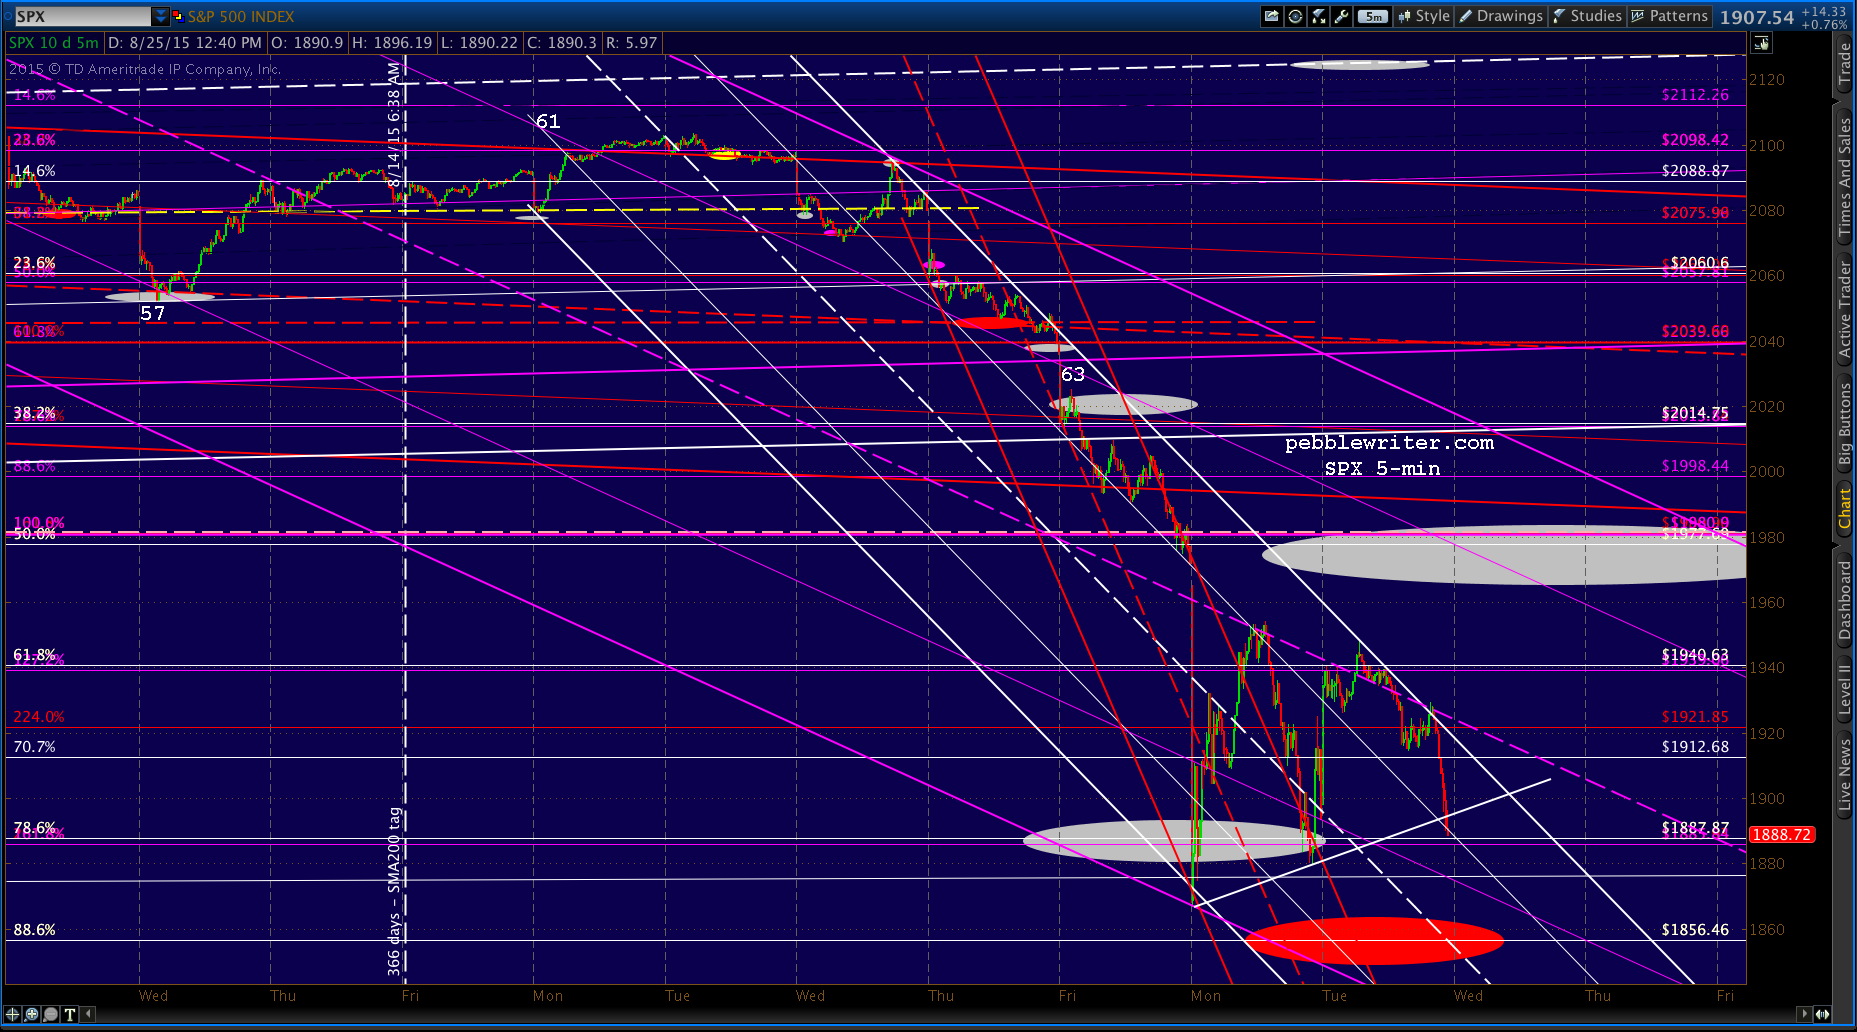
UPDATE: 1:40 PM
Quick update: things are picking up to the downside. But, NKD is bouncing (for now) on the rising TL… …while USDJPY broke down from and is backtesting its channel…
 …and, SPX has reached 1920 so far. Note the presence of a TL from yesterday’s lows. It could provide support at 1887ish around the end of the day, with a gap down to 1856 in the morning. A drop straight to 1856 today would be cleaner and neater, but things are rarely that simple these days.
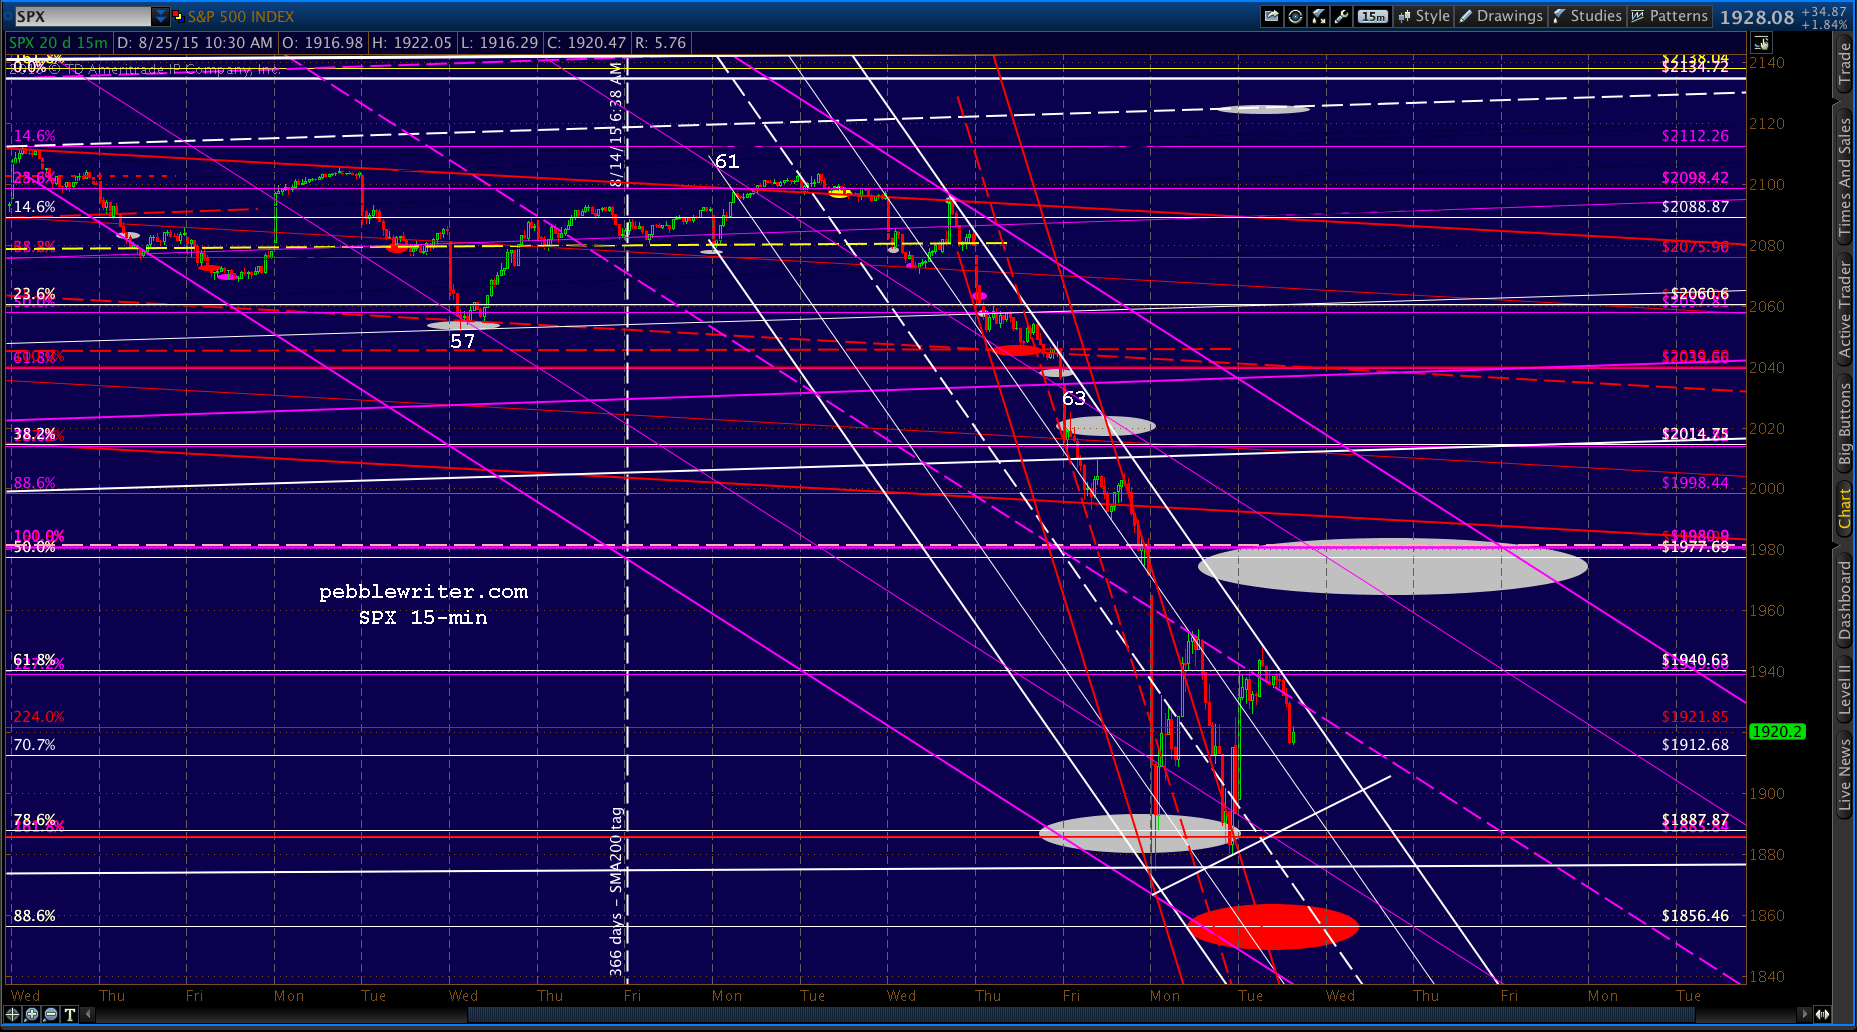 UPDATE: 3:44 PM
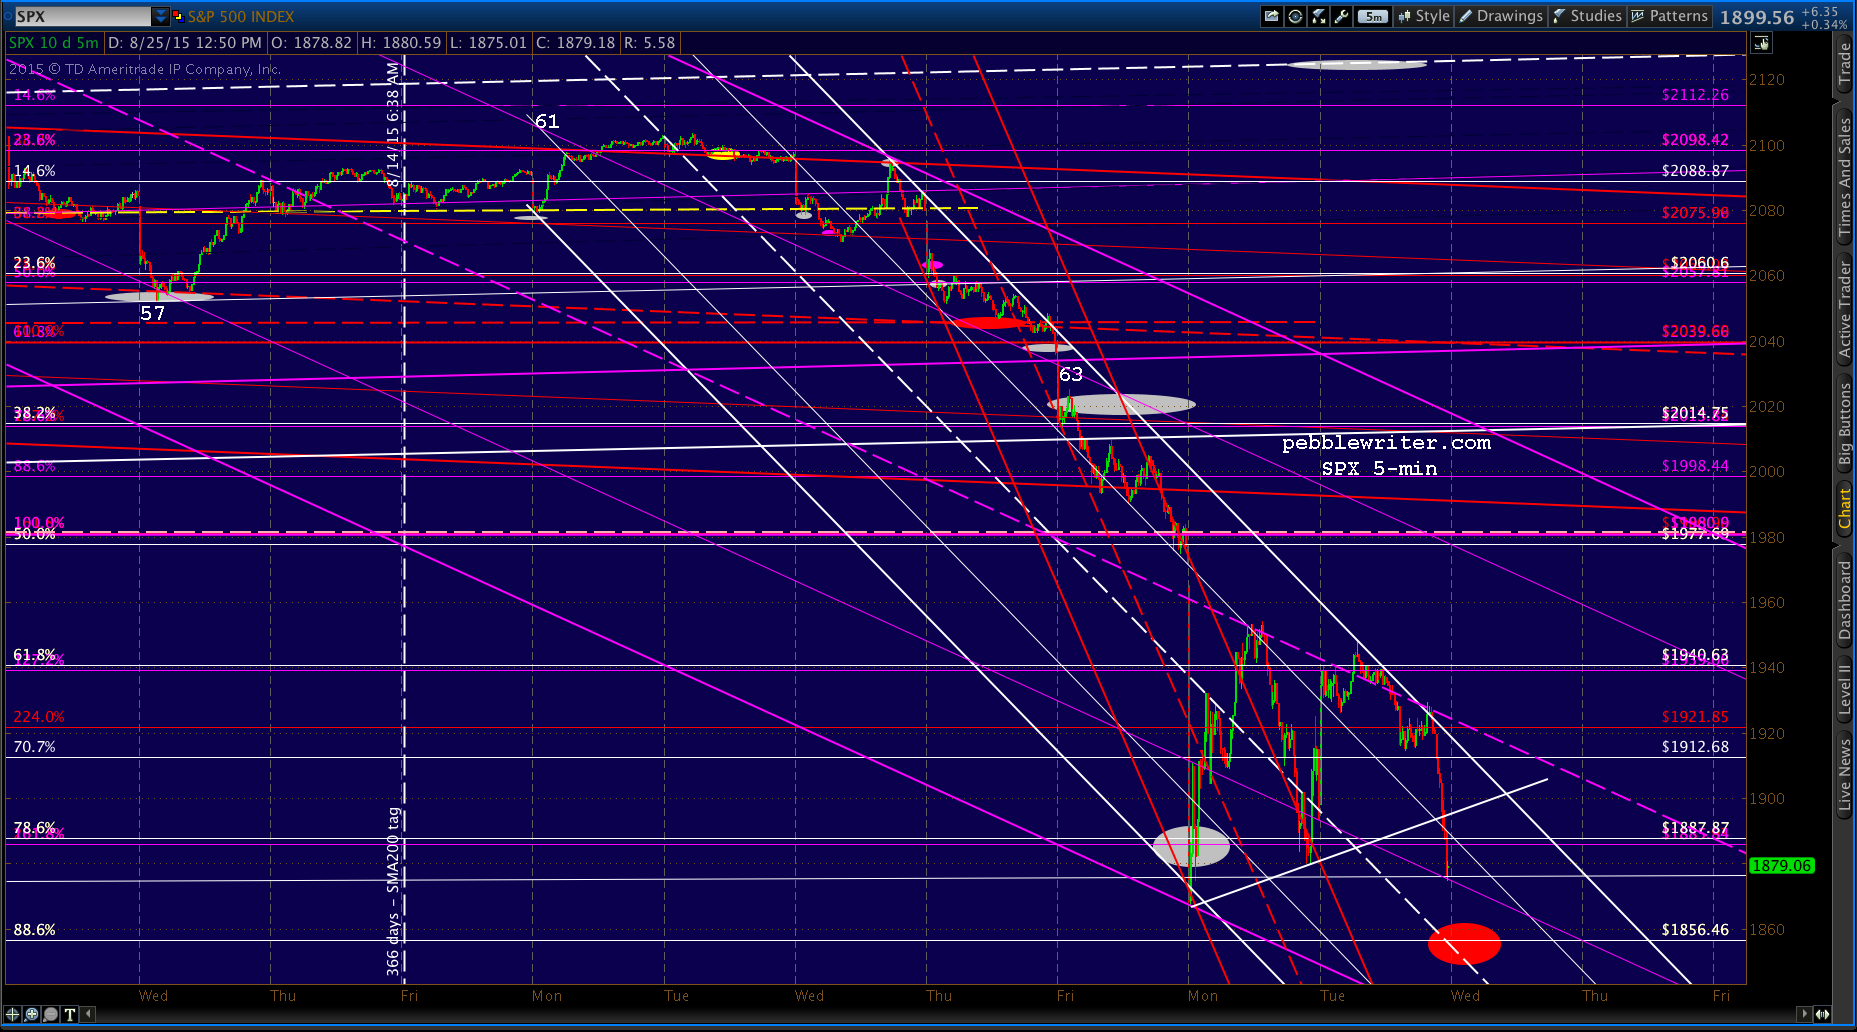
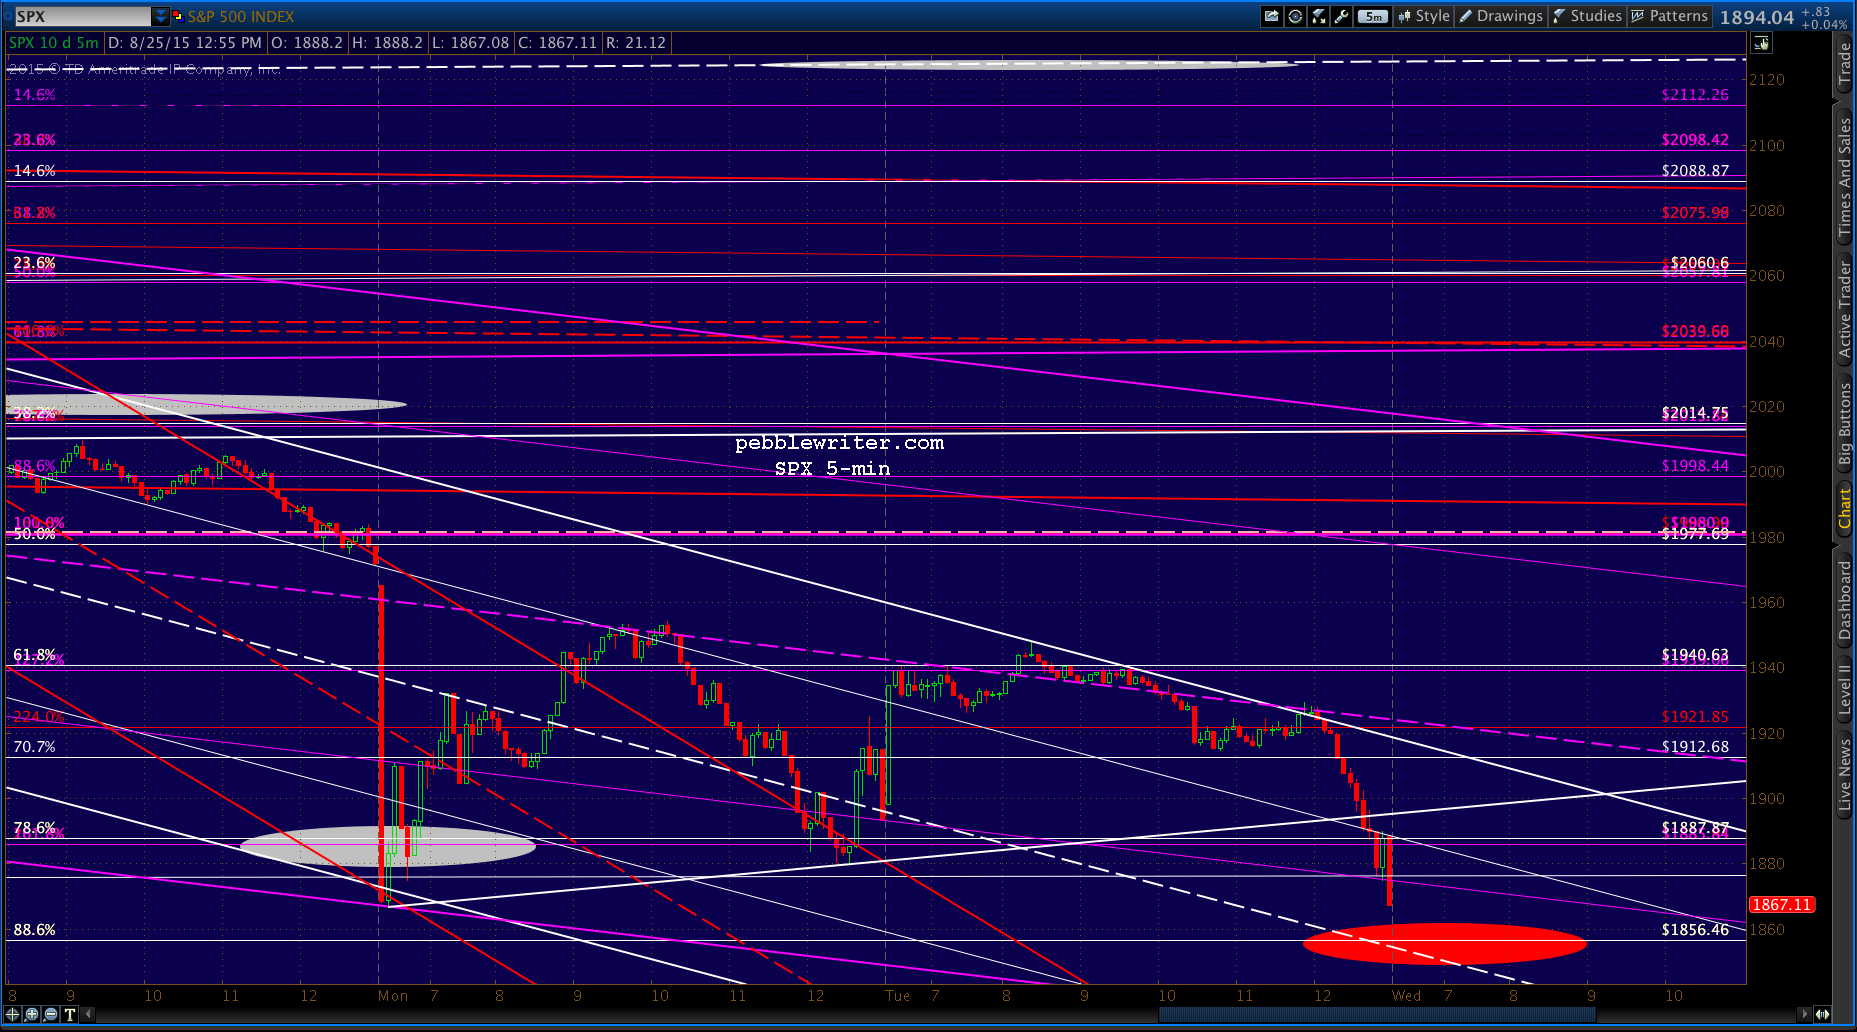
SPX has reached the rising TL and is approaching the .886 Fib. Looks like it might just close at or below 1887.87 as we discussed earlier. Next lower support, again, is 1856.46.
 UPDATE: 3:52 PM
 UPDATE: 4:00 PM
Comments
15 responses to “What Next?”
Thanks for offering the charter annual again. Paid for it many times over with your outstanding calls today. Don’t know how you do it, but please keep it up.
True, we’ve had a pretty good run. Spread the word!
You must have quite a few members by now.
It’s growing gradually. Frankly, I’d love to get it closer to what I’d make by going back to Wall St. No desire to do that commute again; but, with 2 college educations and 3 weddings somewhere in my future, it’s hard not to think about!
Understood, would hate to lose you again :->
Really loving the site, will spread the word.
Please offer your thoughts on a potential mega H&S formation that “fits” with your PTB upcoming “rescue” attempt via QE4 and BOJ announcements:
Markets fall to the ~1820 level in coming week to establish a mega neckline with the Oct 2014 low. Then the Fed/BOJ “rescue” propaganda leads to a major bounce into late September forming the RS top well below the May 2134 top. And then the bottom falls out into 2016?
Love the poetic justice of it, but I’m unclear as to where the ponzi runs out of steam. The charts definitely support the idea, but have central bankers become too powerful? Maybe.
would you rephrase your comment “but have central bankers become too powerful?” Does that mean you don’t think they have the tools to push the market up high enough to form a mega-RS in the next month? Or does that mean they have all the control and won’t let it collapse?
Please understand this is uncharted territory. Never in our lifetimes have central bankers been so actively involved in the day to day movements of “markets.”
Their tools are formidable, but we won’t know whether they’re up to this or any other task until they try. I have no issues with the idea of a right shoulder being formed here. But, I’m sure you’ve noticed that almost all of them over the past few years have busted and resulted in new highs.
This 1.618 at 2138 might be the one Fib that they can’t surmount as easily as the rest. It should be. In an unrigged market, we’d be facing at least a 500-pt drop.
However, nothing has stopped the CBs yet. And, I’m pretty sure they’re not going to give up just because it costs too much or is too much trouble. They’re all-in on this scheme, and will either succeed or take us all down with them.
Mitch,
You talk like it’s a viable option to continue a ponzi scheme indefinitely and that’s their plan. They’ll make more money on the downside than they’ll make on pushing it up to another extreme. They know we are living on borrowed time and this isn’t a sustainable “system”. They know at some point (like in 2008) the Big Dogs will exit the “market”. The Big question is “IS THIS THE FRACTAL EXTREME WHERE THEY CLOSE RANKS AND PROTECT THEIR OWN $$$ AND EXIT? I can’t see why they’d try to push for another bubble (with limited tools) when the easy money is them letting go. Anybody with a brain knows this won’t last so the “bet” is when does it end…now or later?
IMO, it is a viable option to try. I’d be shocked if they didn’t. But, I’m a lot less certain re whether it will work for very long. It’s NOT sustainable. It WILL fail eventually. Maybe 2138 is it. Or, maybe they can keep it going longer. There’s no way to know because, as stated above, this is uncharted territory. IMO, the past offers no sufficiently analogous events.
Let’s talk about who “they” are. Hedge funds are on one end of the spectrum, just as happy making money on the downside. Central banks, who are tasked with saving the world, would likely not be. As misguided and damaging as their actions might be, I doubt many of them are ambivalent about another financial collapse — at least not as institutions.
I don’t think they intentionally painted themselves into a corner. I believe most of them probably thought growth would come from ZIRP and the wealth effect. Now that it’s faltering, we have to guess as to what they’ll do. Since Japan is the bell cow, and Japan is beyond hope, I believe they’ll act out of desperation and go for broke.
Just my 2 cents.
Pebble,
I think you meant to say 205-pt to get to 2138 from 1933 or 10.6% not 105-pt and 5.4%
Yes! Thanks for the heads up.
Since “they” haven’t accomplished their goal of more QE by BOJ or backing off the Fed, yet, I think we see your downside target hit with an announcement by the BOJ that night or the Fed rolling someone out to a microphone. I mean, no one really believes the move by China last night moves the needle there at all, right? It’s going to take massive QE to float that turd…and that’s probably what gets us to some outlandish SP targets
Correct. China is an excuse that might even have been instigated by TPTB in order to induce Japan to further depreciate the yen. As to whether any amount of QE can get SPX over 2138, we’ll find out. But, I’m fairly confident they won’t go down without a fight.