Month: June 2015

  • Update on XLF: Jun 30, 2015

    Last December we noted that XLF, like many indices, had regained a trend line which it had lost.  It was the third time in a row for the ETF that focuses on banks and insurance companies — which kinda made sense.  As we wrote then:

    I suppose it’s to be expected, as no sector has benefited from the Fed’s largesse so greatly as have financials.

    It would all be amusing were it not for the fact that XLF just closed below a major TL again.

    2015-06-30 XLF daily 1300Will it bounce right back as though nothing happened, or will this plunge leave a mark?

    continued for members(more…)

  • Update on Nikkei 225: Jun 30, 2015

    Only one chart worth showing at this juncture.  The daily chart shows NKD breaking the rising red channel from October 2014 just yesterday.

    Recall that was the month when Bullard (on the 15th) and Kuroda (on the 31st) teamed up to push stocks through heavy resistance. In NKD’s case, it was able to slice through the .886 Fib (a completed Bat Pattern) and go on to make new highs.

    2015-07-01 NKD daily 0600
    Updated July 1, 2015

    Could NKD bounce back into the red channel as though nothing ever happened?  Sure.  In a centrally planned “market” anything is possible.  But, today’s backtest of the broken channel bottom should at least give one pause.

    GLTA.

  • Update on NDX: Jun 30, 2015

    The Nasdaq-100 Index hasn’t played nicely with respect to Harmonics or chart patterns — except those that manage to push the index higher.  It plunged 83% when the 2000 bubble popped and, after 15 years, has finally managed to retrace 88.6% of those losses.

    The most prominent feature in the long-term chart is the white channel — almost all of which has been irrelevant as the index spent the vast majority in the top half (and, most of that in the top 23.6%.)2015-06-30 NDX wkly 1130Interestingly, the rise from 2009 has was fairly orderly until this past October.  NDX plunged below the bottom of the red rising wedge after reversing just past the white .786 at 3955.

    But, as we all remember, Fed President Bullard went on TV to promise more QE, and the BOJ actually did roll out more QQE.  NDX was suddenly back in the rising wedge, zipping right along like nothing ever happened.  2015-06-30 NDX daily 1130So, it’s especially intriguing to see it lose the support of that wedge yet again.

    continued for members(more…)

  • Update on COMP: Jun 30, 2015

    In last quarter’s update on COMP, we suggested its immediate upside potential was to the 2000 top at 5132 [see: Mar 23 Update.]  The timing looked like late May.

    2015-0323 COMP daily 1300

    All it took was a Fed president hinting at additional QE, and the BOJ greatly expanding their already enormous QQE.  After a close call on Apr 27, the actual tag occurred Jun 18 — a little over 15 years after the previous bubble popped.

    2015-06-30 COMP wkly 1130Will those who rode the NASDAQ down nearly 80% be interested in sticking around now that they’re back to even?  Will new money find its way to this, the most volatile sector during the two previous crashes?

    continued for members(more…)

  • Update on RUT: Jun 30, 2015

    The big picture shows a break out of the white channel top, but not the yellow.

    2015-06-30 RUT wkly 20yr 1030continued for members(more…)

  • Update on DJIA: Jun 30, 2015

    Last November,  we noted the Dow’s breakout from a long-standing rising wedge and megaphone pattern to new highs following the BOJ’s huge Oct 31 expansion of QQE [see: Nov 20, 2014 update].  2015-06-30 DJI wkly 0700It knocked the yen from 107 to 122 to the greenback, thus giving the flailing yen carry trade (and, of course, the Dow) a much-needed shot in the arm — enabling it to rebound from the broken purple rising wedge and go on to new highs.

    2015-06-30 DJI daily 0800We set a new upside target for DJIA at 18,274 — the completion of a Crab Pattern based on the 8.6% drop from 17,350 to 15,855 in October.  We noted at the time:

    The megaphone pattern is severely dented — which was, of course, the whole point of Kuroda’s action.  Whether or not the breakout is maintained will be revealed in the coming weeks, and will depend largely on whether USDJPY reverses at 118-120.

    As expected, USDJPY spiked to the critical .618 Fib level at 120.11, taking stocks along with it.  But, instead of reversing, it went essentially nowhere for several months.  Stocks initially sold off sharply after 120.11 was reached, but constant bounces to just above 120.11 kept them from falling too far. 2015-06-26 USDJPY v SPX

    Finally, in early March, USDJPY broke out to above the 120.11 level.  DJIA dutifully followed along, reaching our 18,274 target.  It didn’t last, however, slipping  back below 120 between mid-March and mid-May.

    But, on May 26, USDJPY rallied not only above 120.11, but the March highs as well. It enabled DJIA to reach new highs, too (while breaking several chart pattern rules along the way.)  As we suspected, this move would also fail.

    continued for members(more…)

  • All That Matters

    The S&P 500 has plunged precipitously many times since the 2009 lows.  Yesterday’s 40-pt swoon not only reached our downside target range, but tagged the channel bottom from May 2009.  A reversal here would allow the appearance of an ever-improving market to continue.  So, that’s exactly what we’ll get today.

    2015-06-30 SPX daily since 2009As we noted in yesterday’s Big Picture, SPX’s low yesterday tagged the target we first set on June 1 [see: Sell in May, Go Away] and made official on June 8 with this chart:SPX daily CU 0745Without last week’s fakeout breakout, the timing would have worked better for a tag of the intersection between the purple channel bottom and the SMA200 (thick red line.)  Yesterday’s close definitely broke the channel bottom by a tick or two.

    2015-06-30 SPX daily 0601 CU Given that USDJPY has now backtested the December/March highs…

    2015-06-30 USDJPY daily 0600…and, CL has rebounded off the lowest possible point that would permit us to consider the white channel midline intact…2015-06-30 ES daily 0600…we’re left with two important questions.  How big a bounce will we get today?  And, is sell-off over?

    continued for members(more…)

  • The Big Picture: Jun 29, 2015

    It was nearly a month ago that we first suggested a drop to the SMA200 in late June.  We posted an iffy target in this chart on Jun 1 [see: Sell in May, Go Away.]2015-06-01 SPX daily 0712The question marks matriculated to a full-blown target on Jun 8 [see: June 8 CIW.]

    To get to 2050 would require a break in TL/channel support.  So, I hesitate to consider it “likely.”  For now, we’ll just call it a likely target should the support at the SMA100 not hold.

    SPX daily CU 0745Things seemed to go cattywampus on Jun 15 when rumors that Greece was fixed sent SPX sullied the rising red channel (and falling white channel) that suggested the Jun 22 timing.

    It required some serious charting gymnastics and patience (and a small measure of blind faith); but, it turns out that the Jun 1 forecast didn’t suck all that much.

    2015-06-29-SPX daily 1341Score one for charting.  The next step is to square the speed of today’s move with our analog from March.

    Stay tuned.

  • Coming Undone

    MerkelAnd, just like that, the ability of The Powers That Be to control the markets is once again called into question.

    Classic Rock fans might wish to enjoy a little Guess Who whilst reading this morning’s post and picturing Angela Merkel’s expression upon seeing the markets awash in red this weekend.

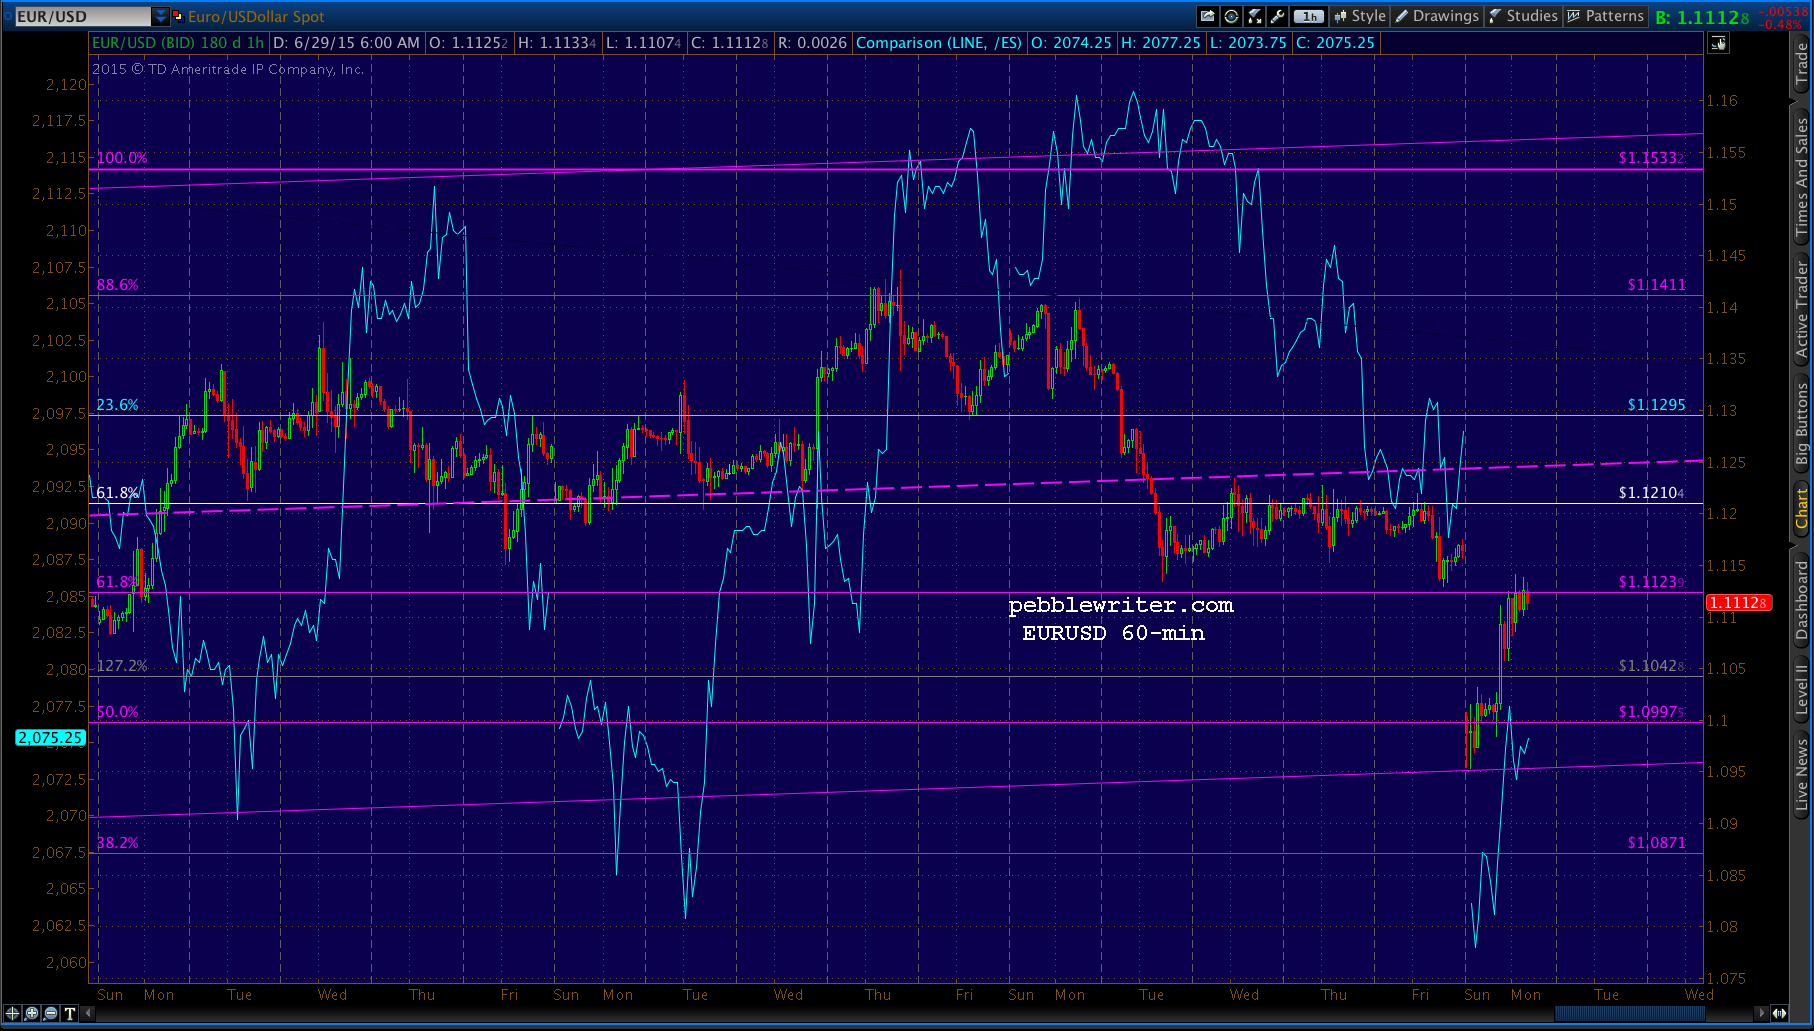
    With Greece seemingly irretrievably broken, the euro took a huge dump over the weekend.  The SNB swooped in and propped it up, less the carnage be worse than it already was.  The daily chart looks fairly benign…

    2015-06-29-EURUSD daily 0616…but, the hourly chart shows just how dramatic Sunday’s plunge (and, the subsequent prop job) was.  Still — only a gap close, and nothing more.  And, there’s plenty more downside potential to our 1.07 target.

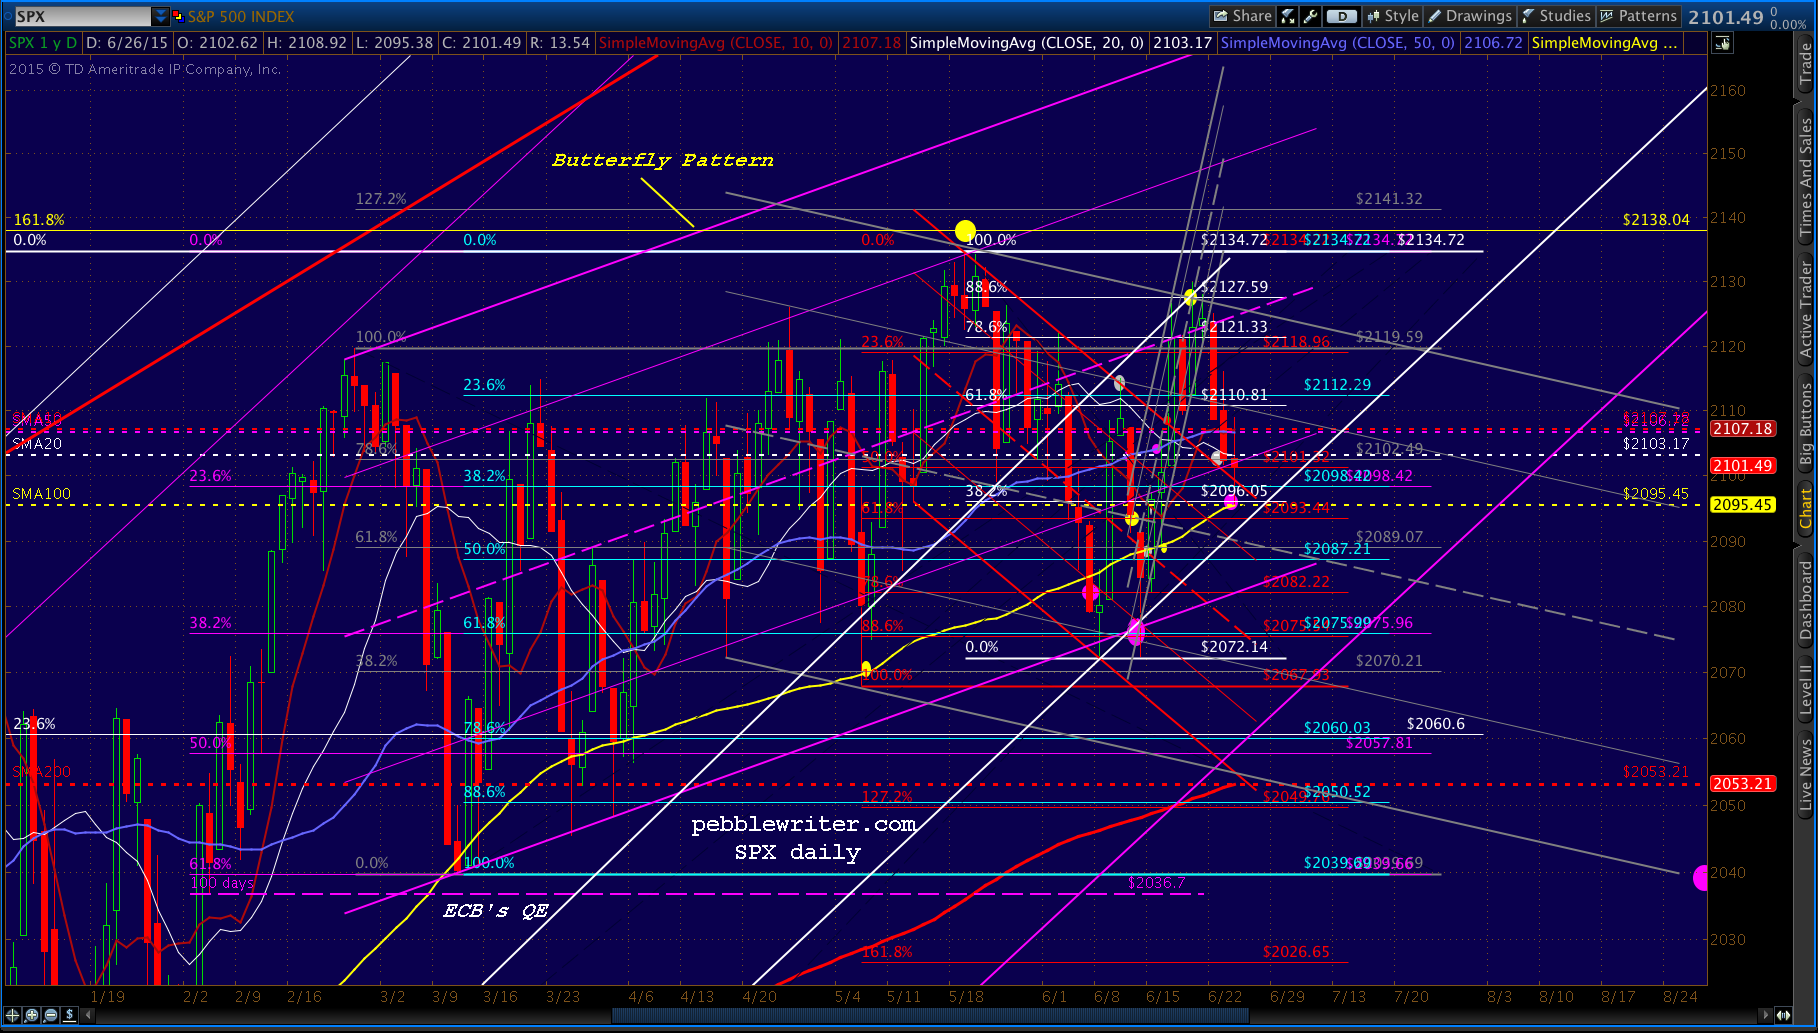
    2015-06-29-EURUSD 60 0616Friday saw SPX reach the SMA100 as we anticipated [Friday’s post]:

    2015-06-29-SPX daily 0617And, today should see our next downside targets come into play, especially since USDJPY and CL have both clearly broken trend.  USDJPY has broken below the red channel midline…2015-06-29-USDJPY daily 0615…and, CL has officially dumped the purple channel and is shacking up with the white channel we proposed on June 19.  From Time to Pivot:

    However, I believe the CL’s purple channel is about to fail.  I expect the entire advance to pivot to the less aggressive slope illustrated by the rising white channel in the chart below. If so, the next stop should be a tag of the white midline (red dot.)

    2015-06-29-CL daily 0615Maybe it’s just us.  But, doesn’t it feel like “The Powers that Be” have inched a step or two closer to “The Powers That Were?”

    Not to worry, today’s move — and the subsequent drops we’ll see in the coming week — are all in keeping with our analog from this past March [see: A New Analog Mar 27, 2015].  We’ll explain.

    continued for members… (more…)

  • Charts I’m Watching: Jun 26, 2015

    SPX nailed our downside target yesterday with a solid backtest of the broken red channel at 2101.78.   2015-06-26 SPX daily 0600From yesterday’s member section:

    SPX just tagged 2105.  Since the decline was pushed out a few days, there’s a good chance it’ll continue lower and make a proper backtest to the falling red channel…look for a bounce between 2000 and 2102, but be cautious re overnight ramp jobs or dips.

    The overnight ramp job was modest — up 4 points at the present time.  It’ll be interesting to see how it does with CL breaking down.  Oil has been instrumental in stocks’ rally.  How will they do with it breaking trend?

    2015-06-26 CL daily 0600continued for members(more…)