

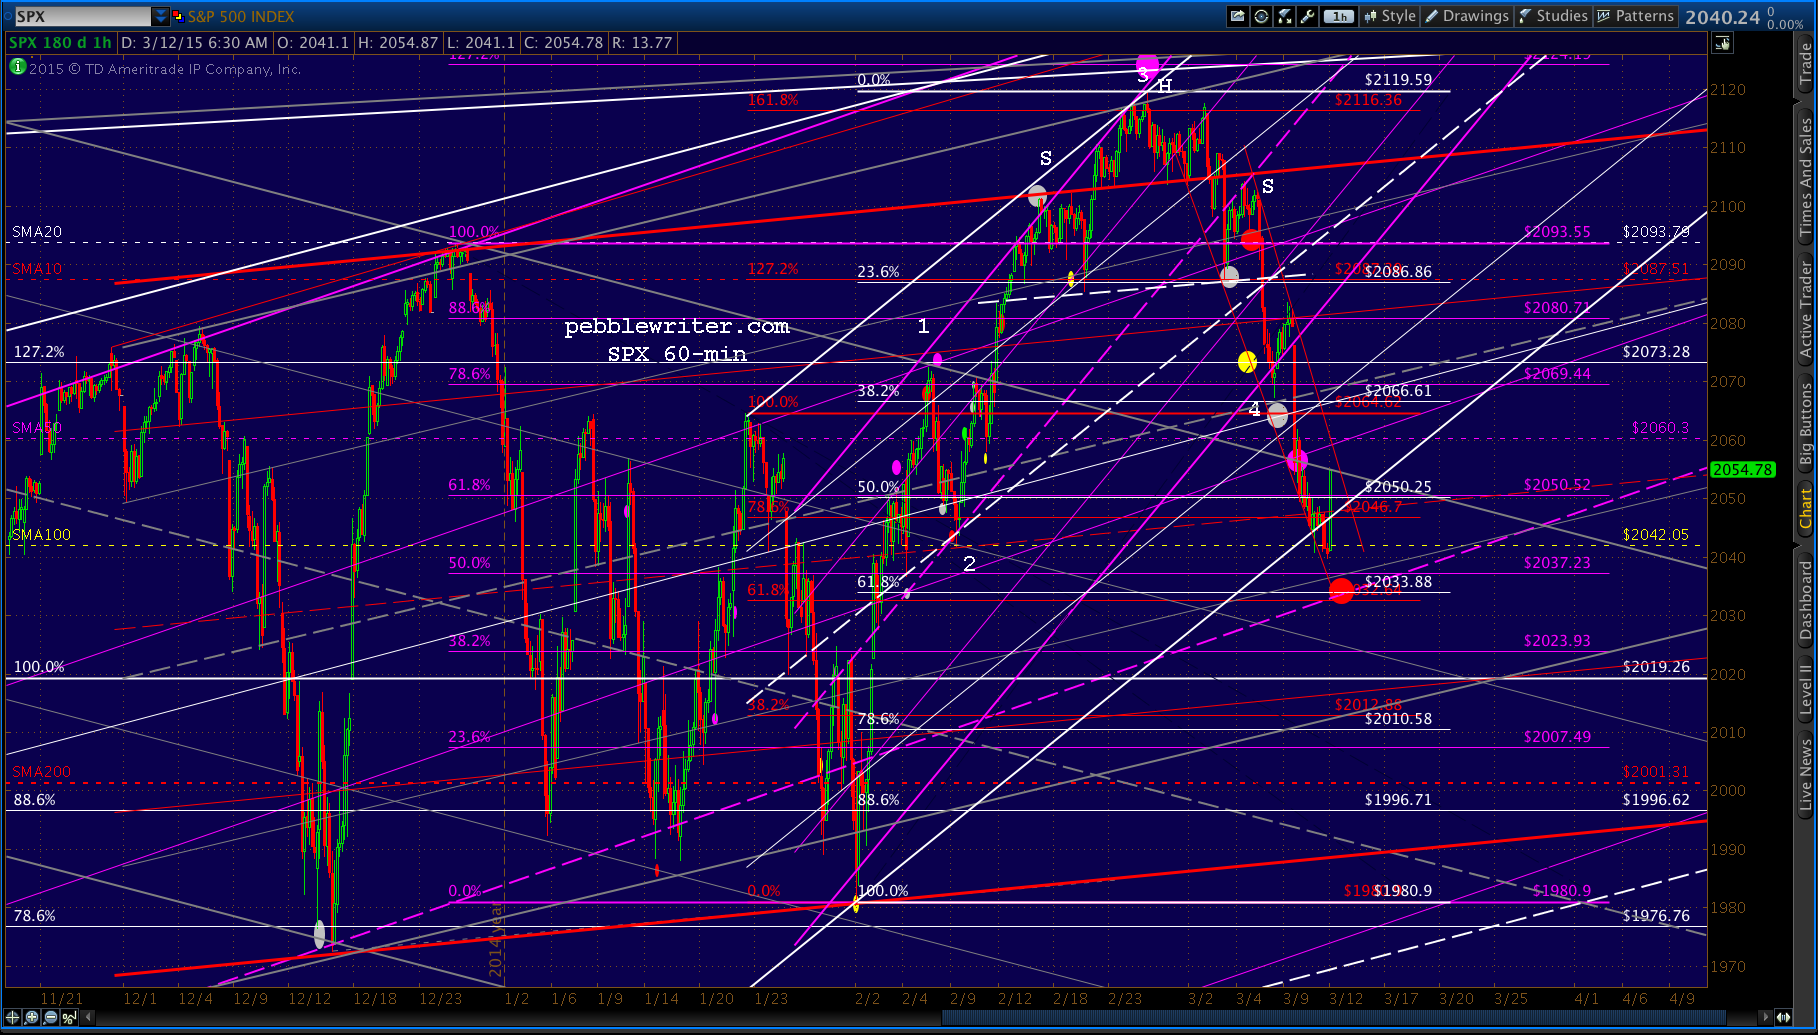
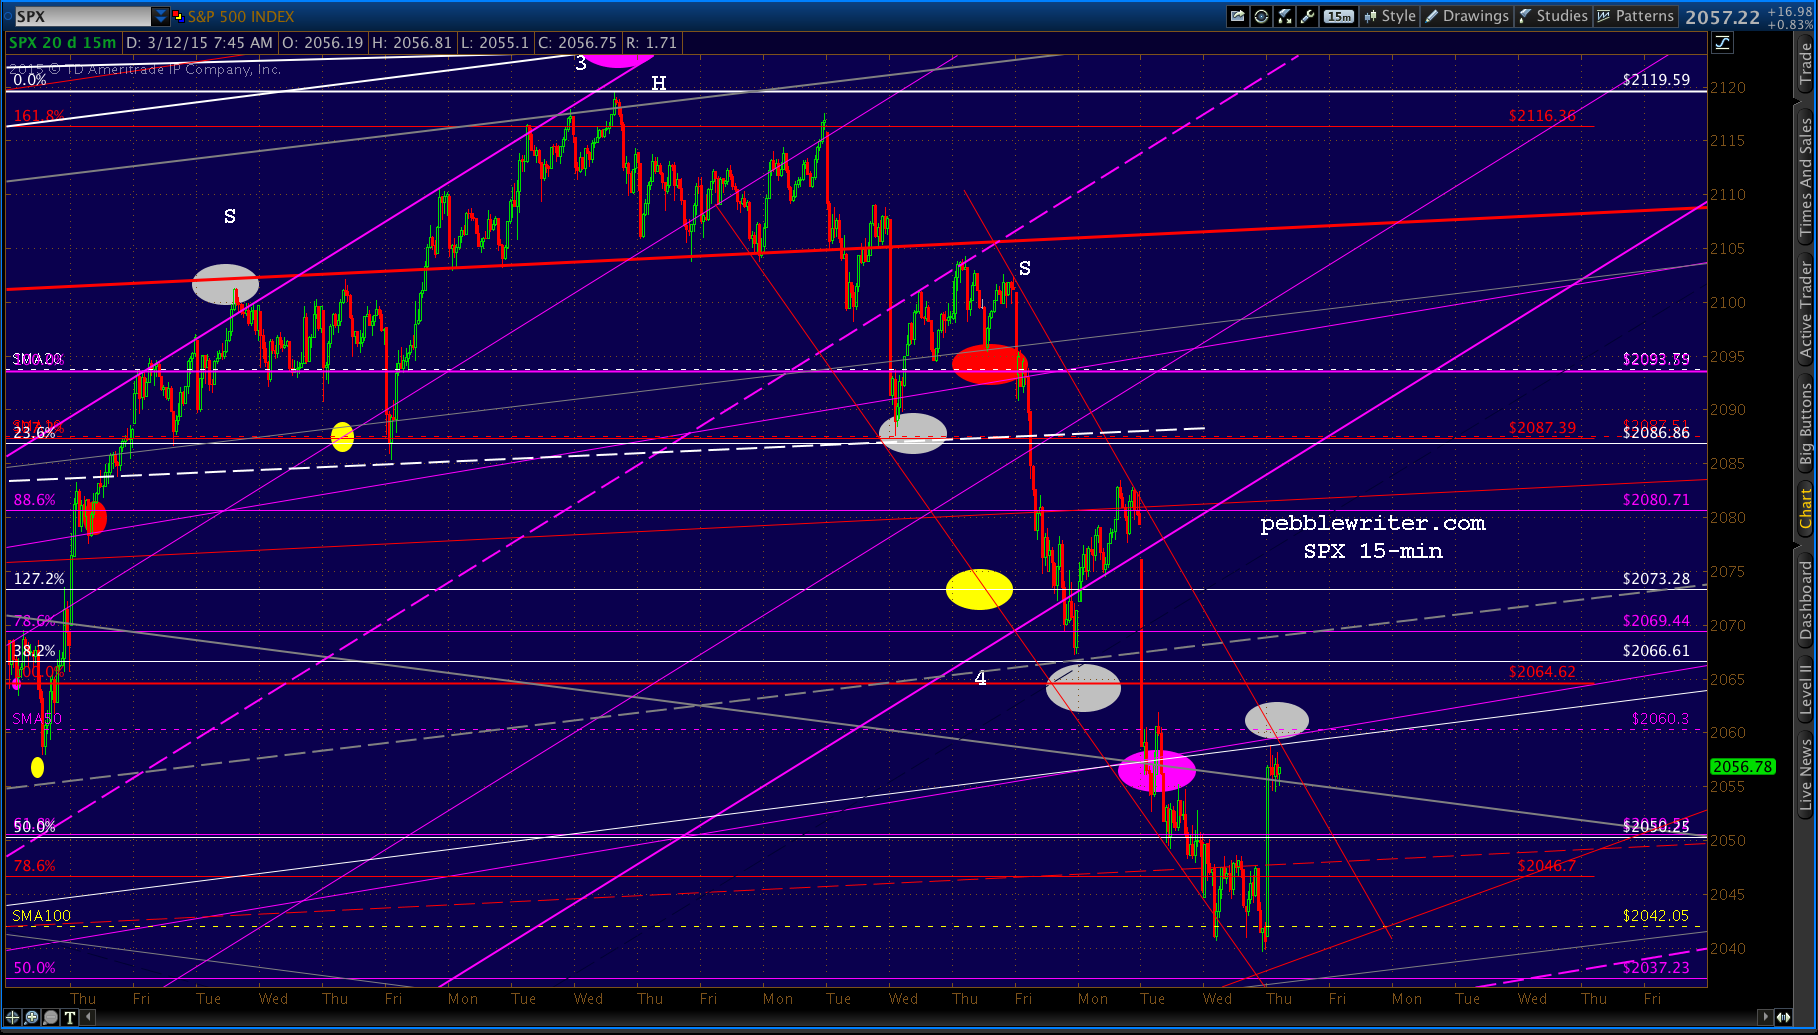
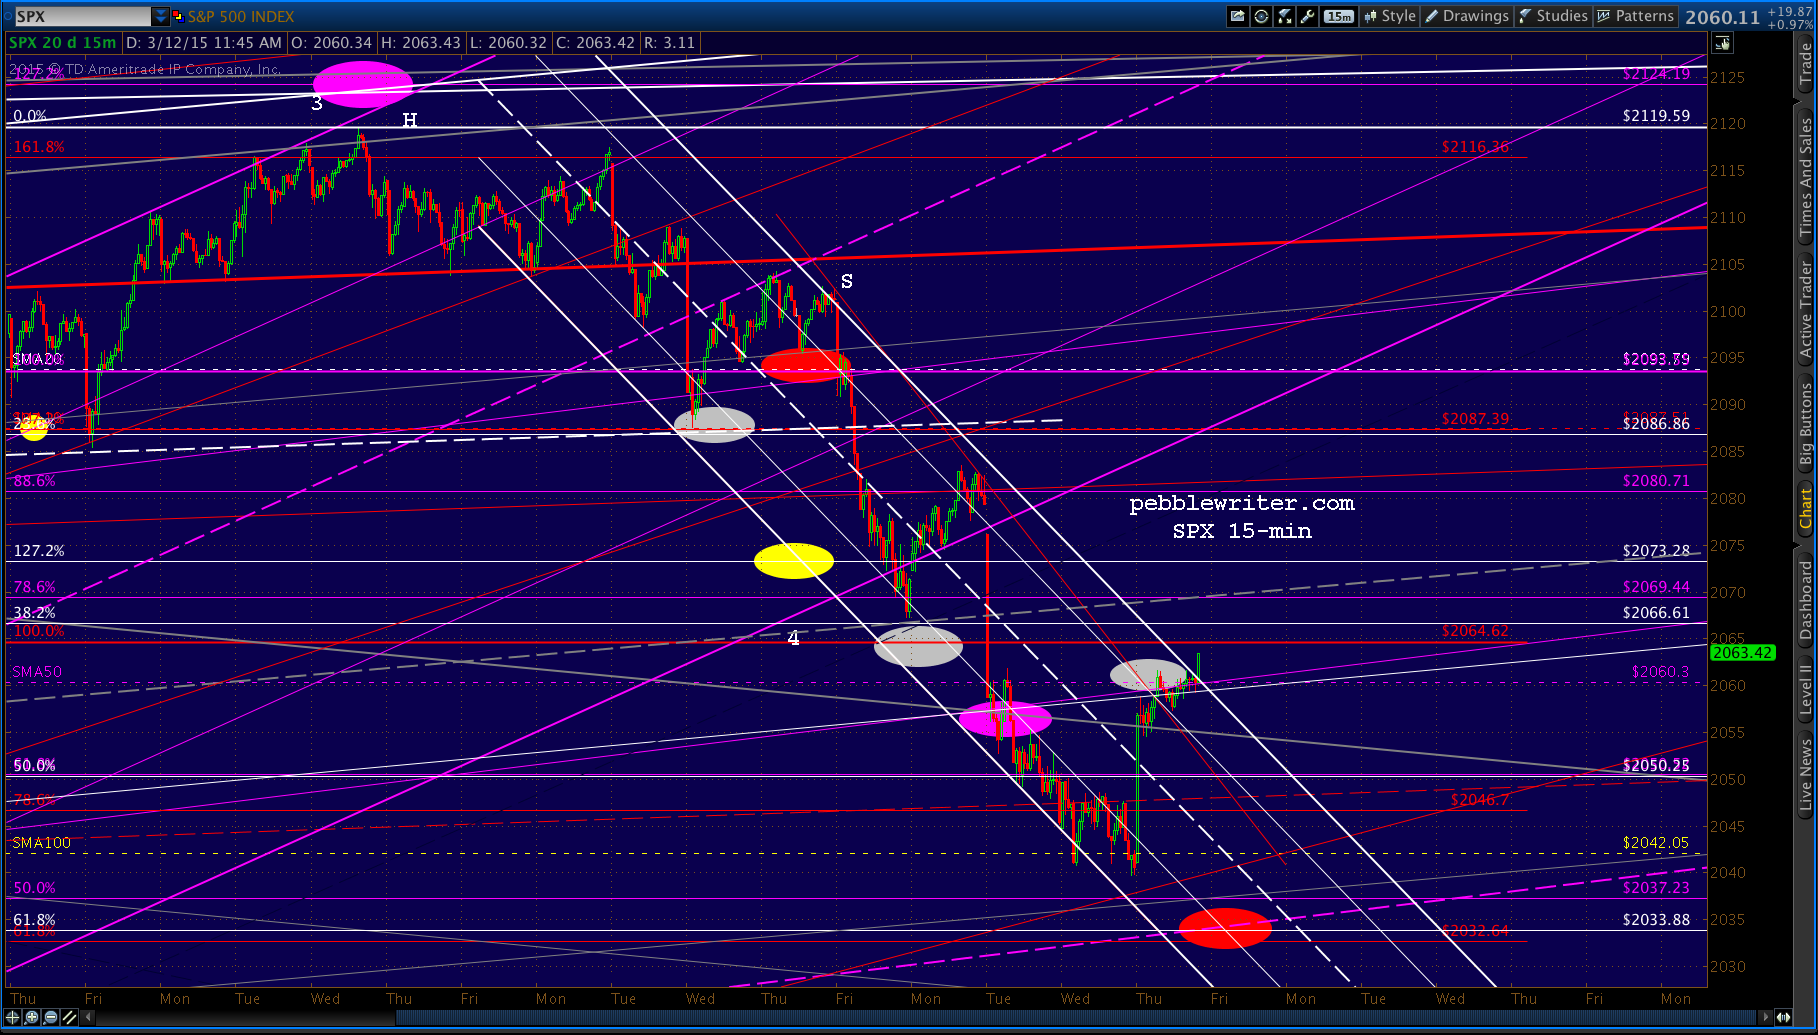
SPX reached the SMA100 yesterday, less than six points from our target of 2033.88 — but, couldn’t quite punch through. The target remains unchanged from Mar 4.
 We’re watching to see whether or not the overnight ramp job can hold, with futures currently up about 7.50.
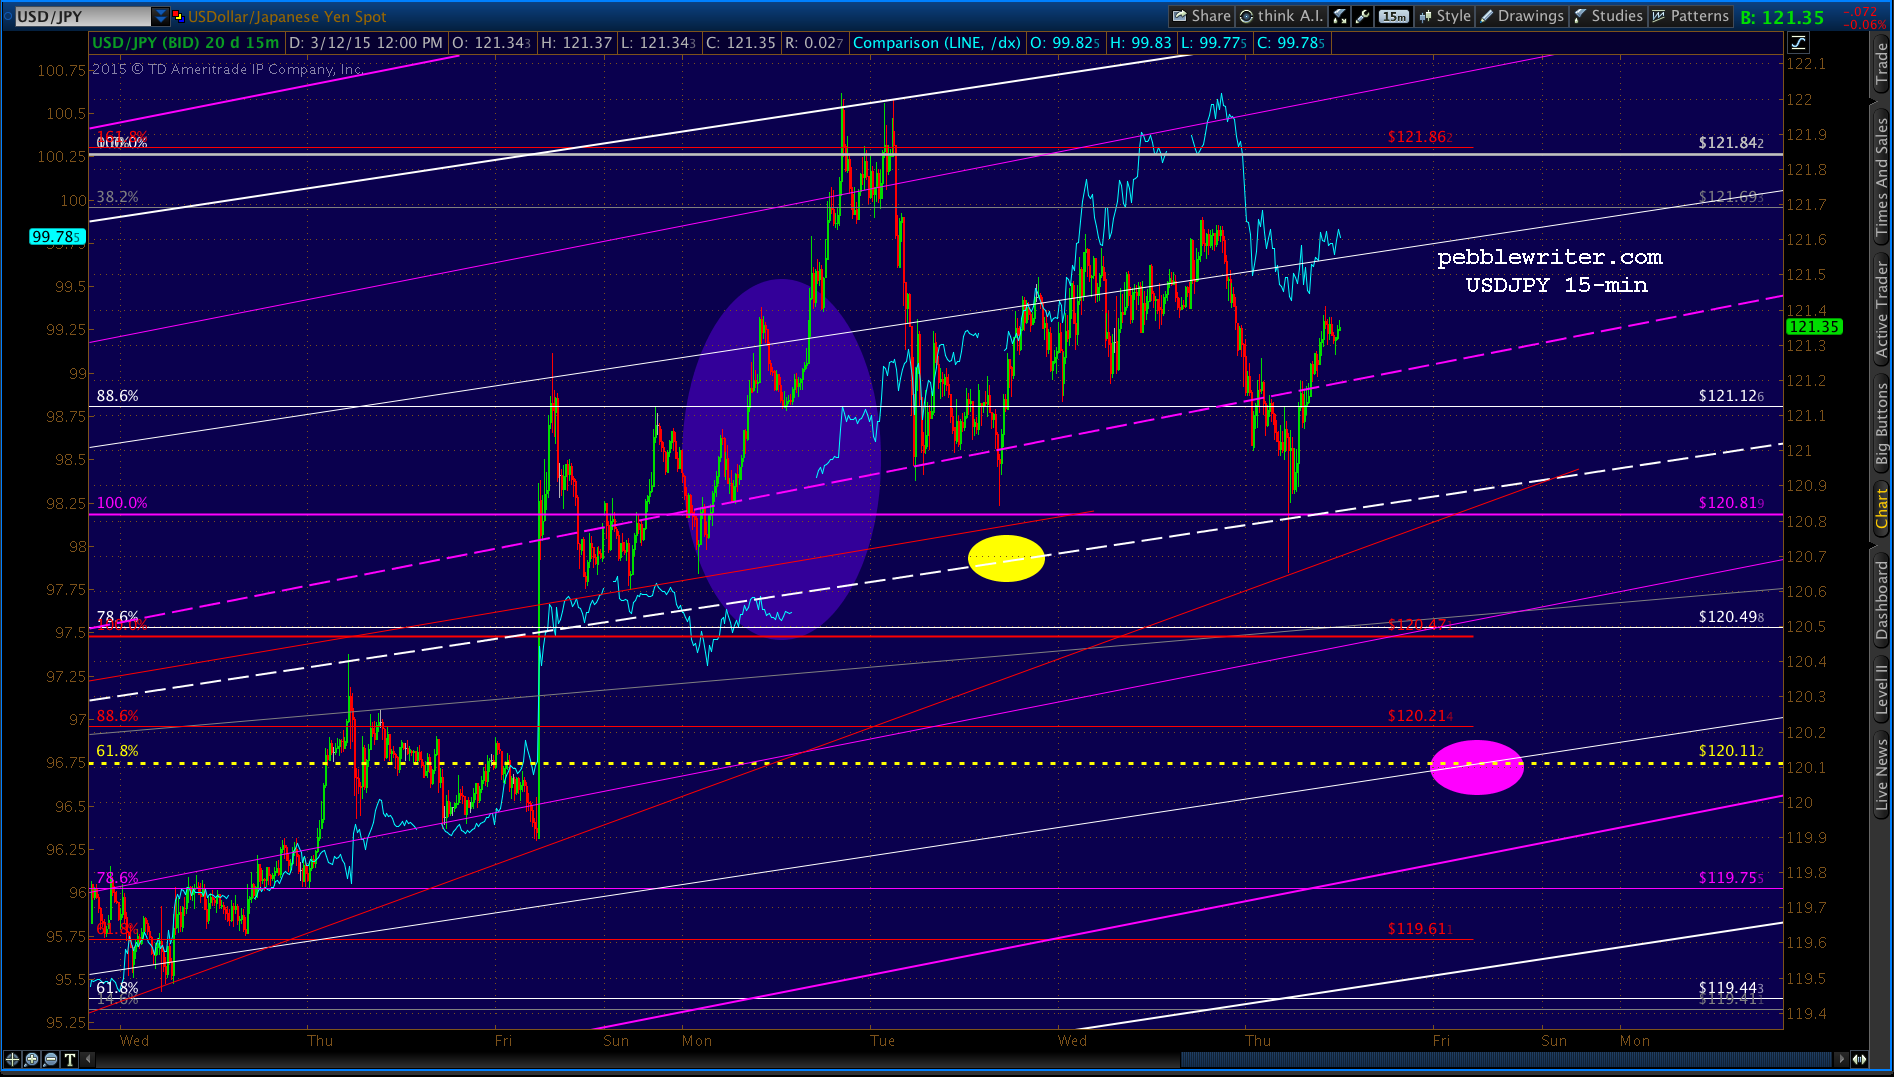
  USDJPY is being rather coy — bouncing off the easy initial red TL support after reaching our first downside target: the white channel midline. Had it happened during trading hours, SPX would have bagged 2033 by now. We’re still looking for 120.11.
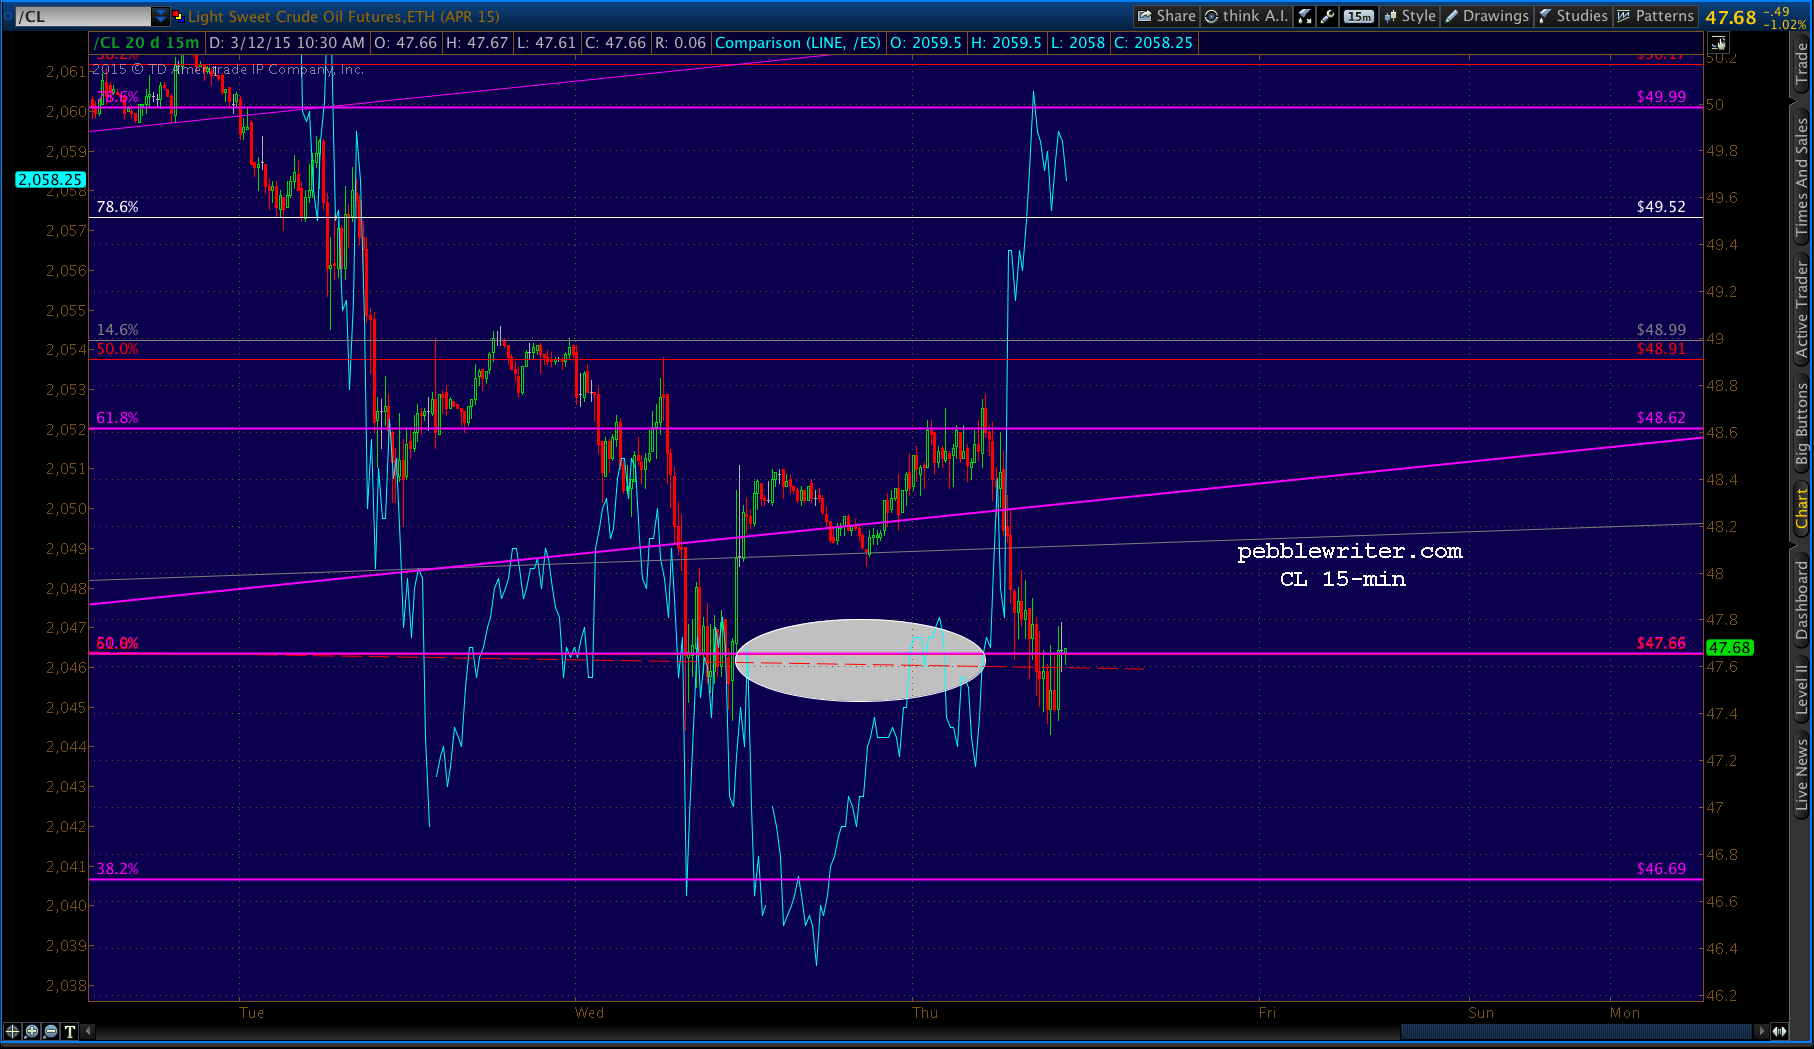
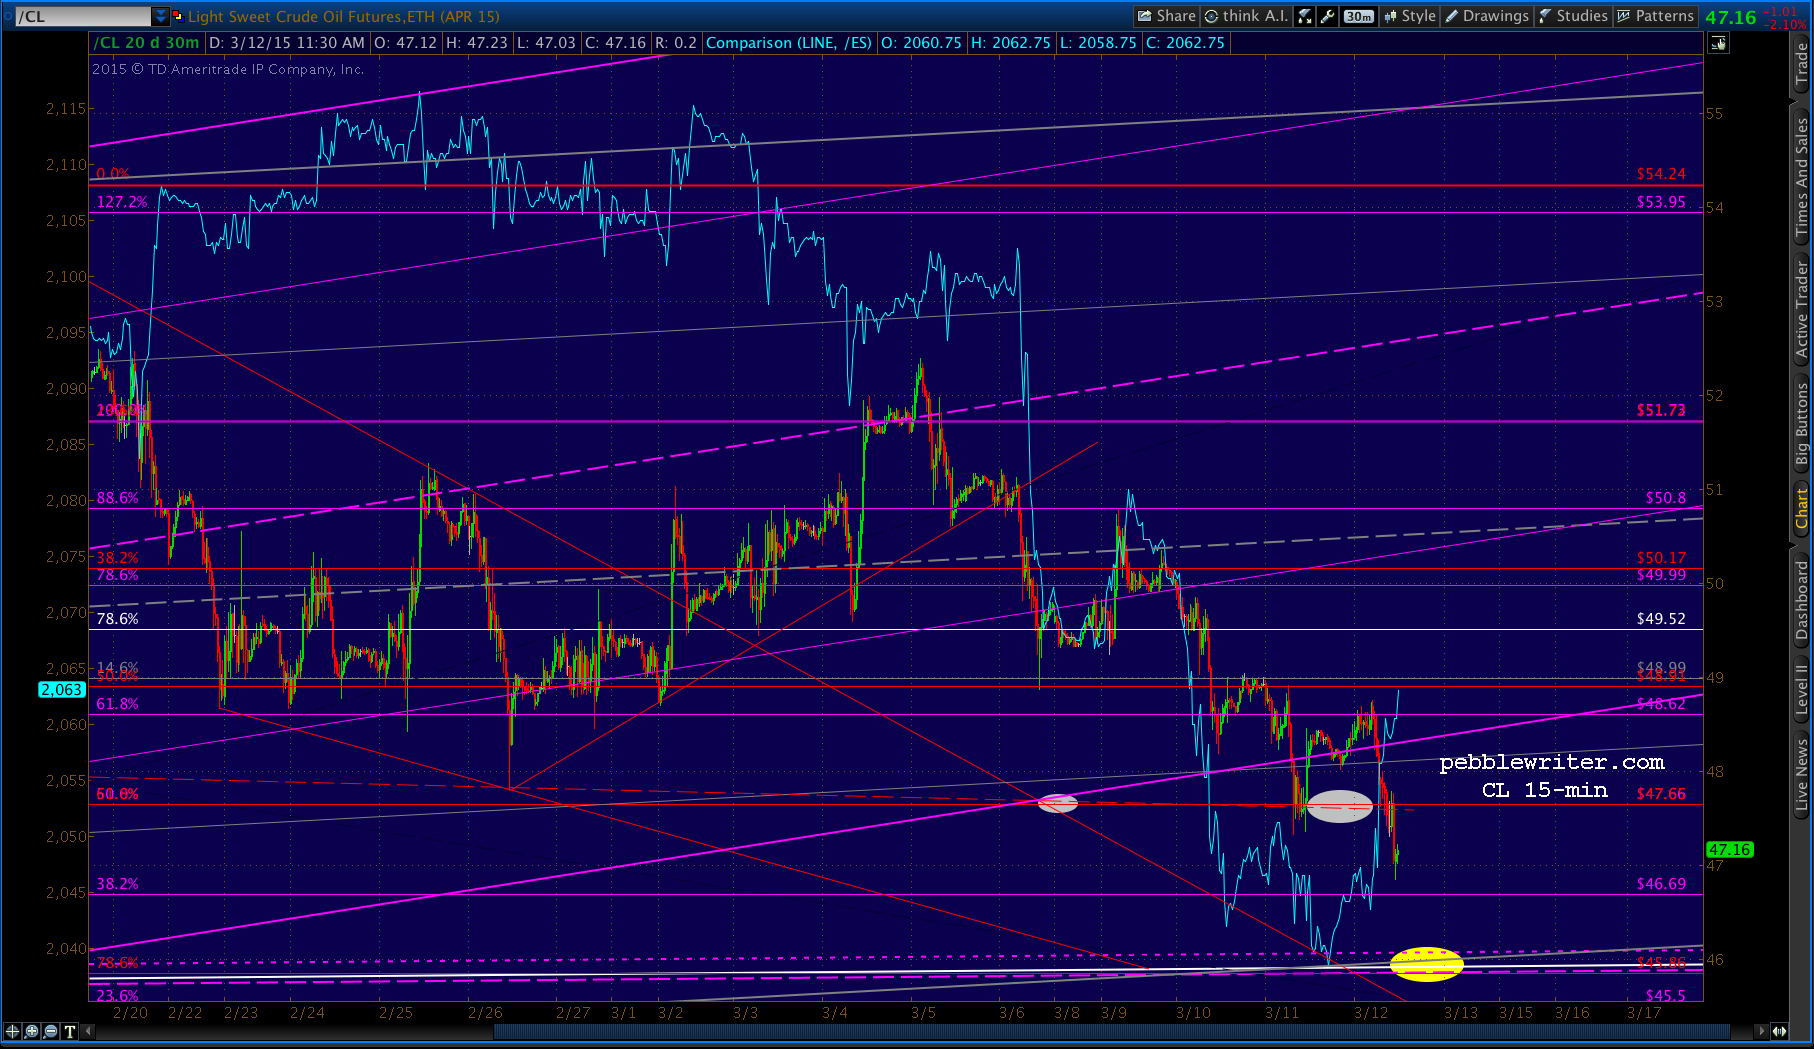
 And, CL — which reached our 47.66 target yesterday — is back in the rising purple channel (for now.) If it’s going to break down and tag our 45.86 target, today really is the day.
 The two most interesting charts are DX and EURUSD. Both are showing a bit of a reversal, which — when it occurs for real — will be the biggest potential game changer around.
continued for members…
DX is approaching our next target: the white .618 retracement of the drop from 121.29 in 2001 to 71.05 in 2008. It’s a big one.
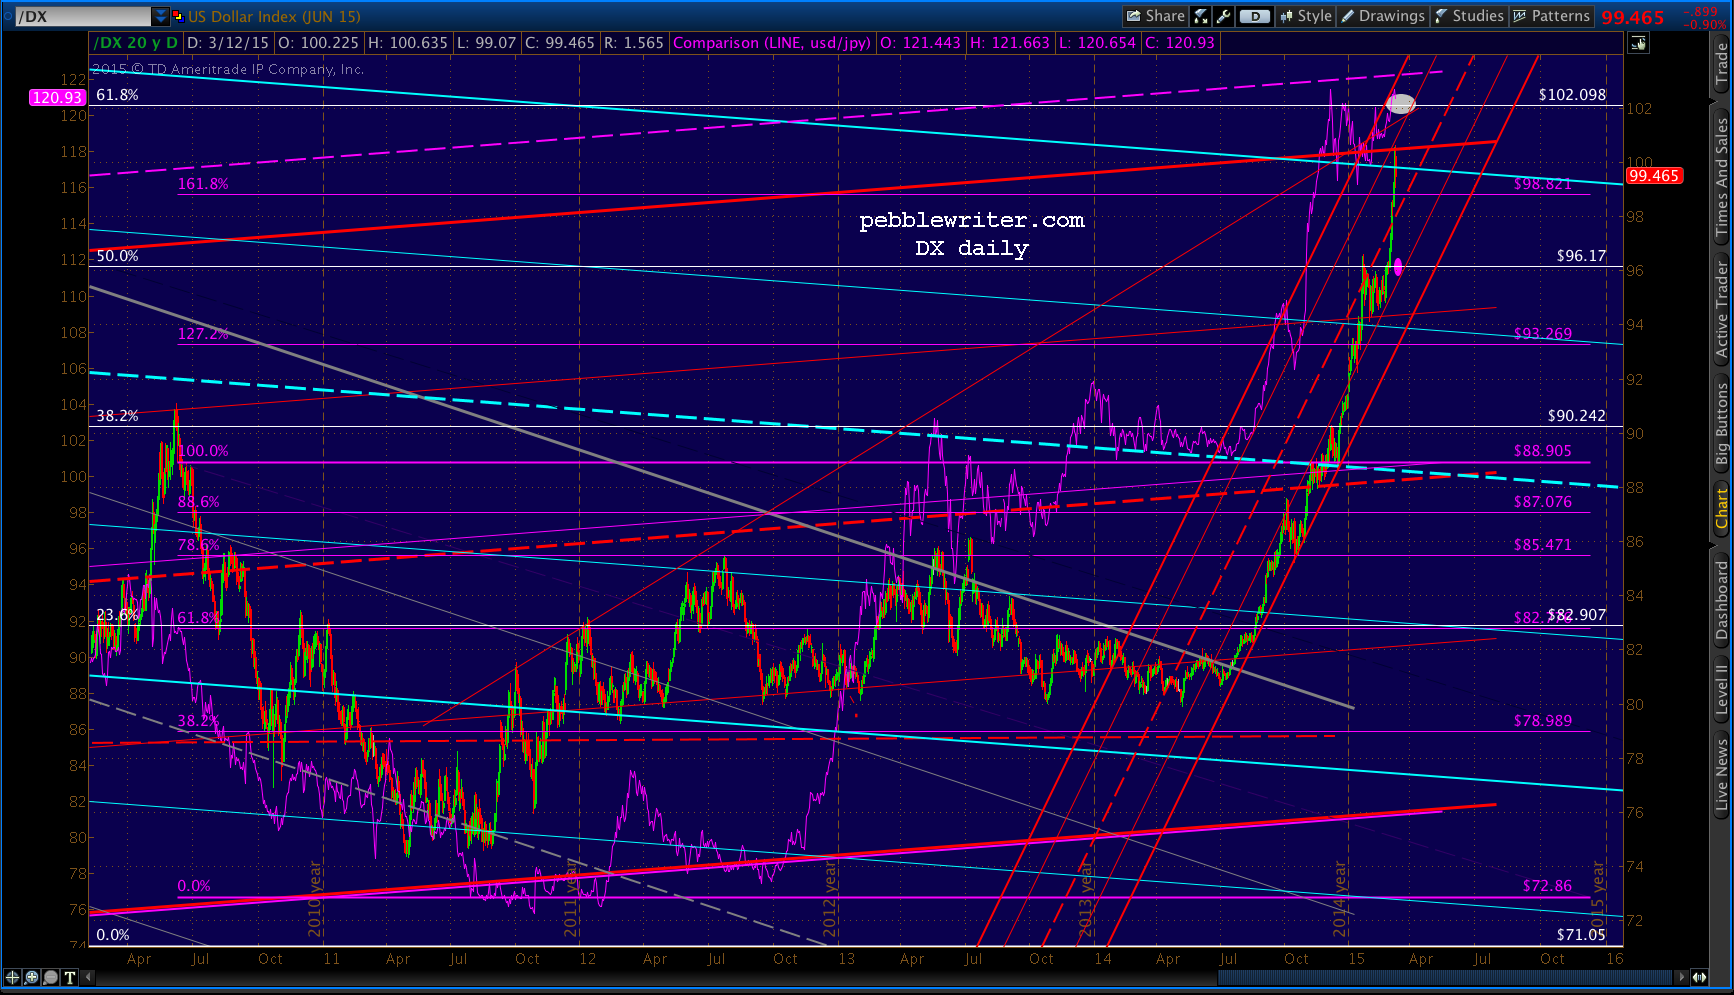 We originally thought we’d see more of a pause at the .500 Fib, and there’s a channel top of sorts at yesterday’s highs on the chart above.
It can be better seen below — the large red channel that contains the two most significant lows. It’s somewhat flimsy in my book, with no solid reversals on any level since the Aug 2011 lows.
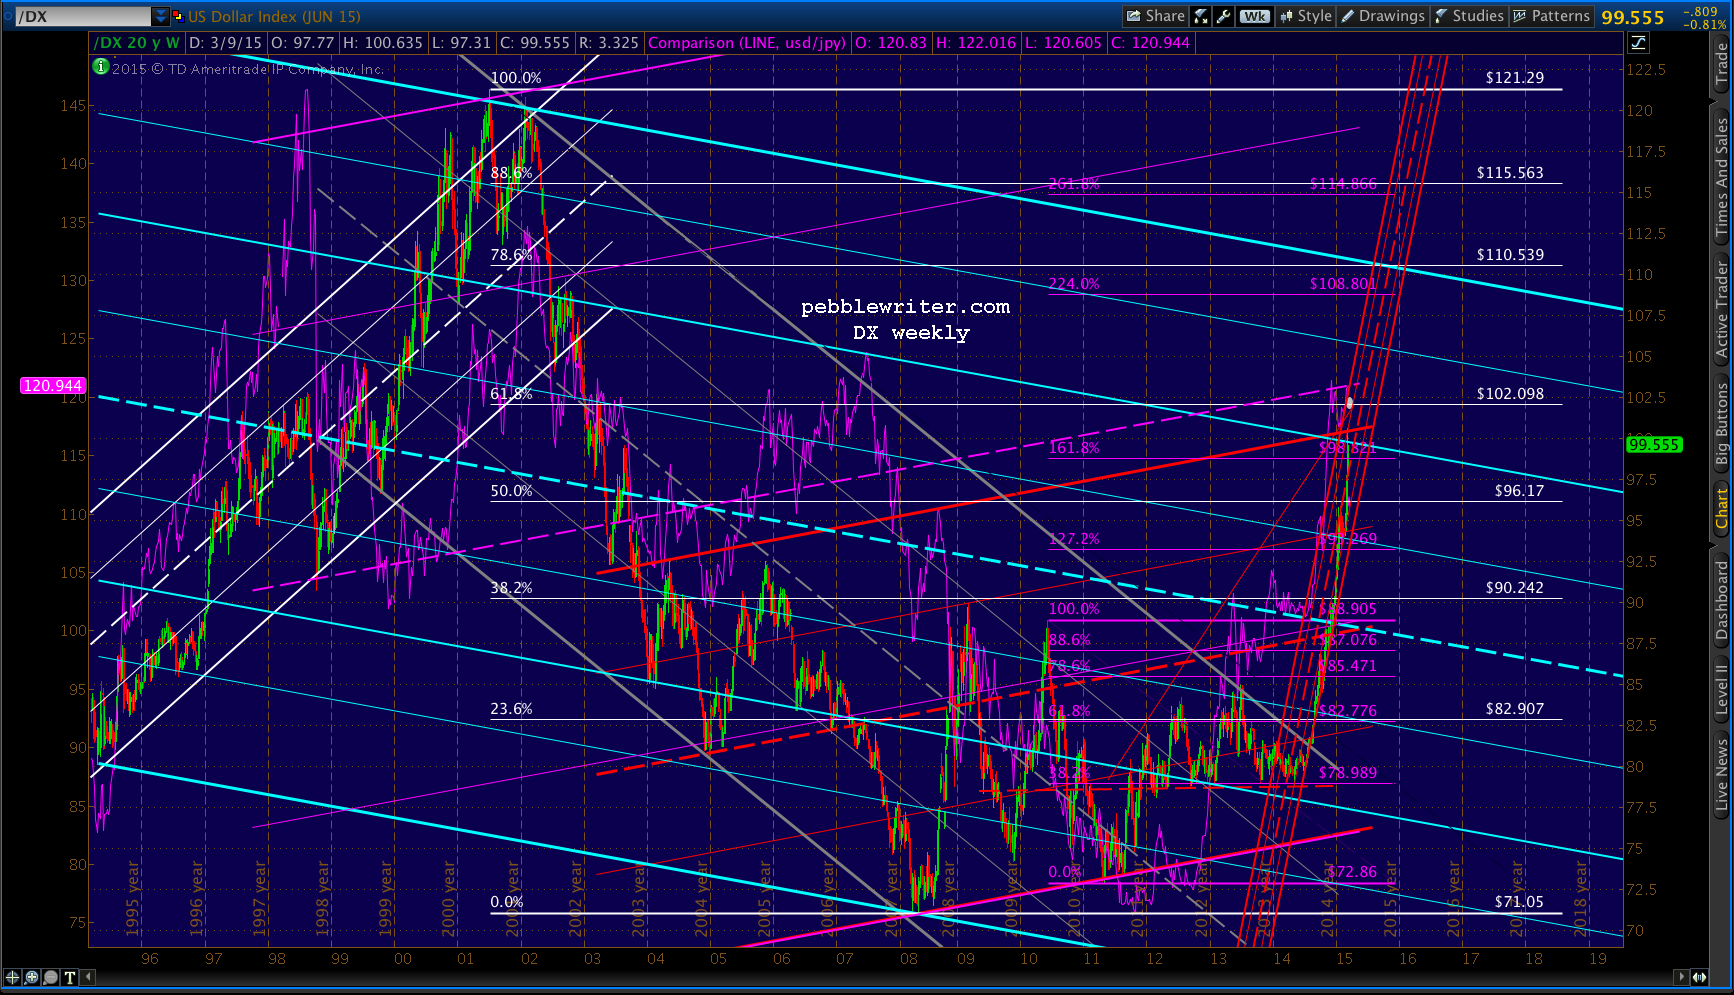 I’m looking for a backtest of the rising red midline (currently around 98) or the .500 Fib at 96.17.
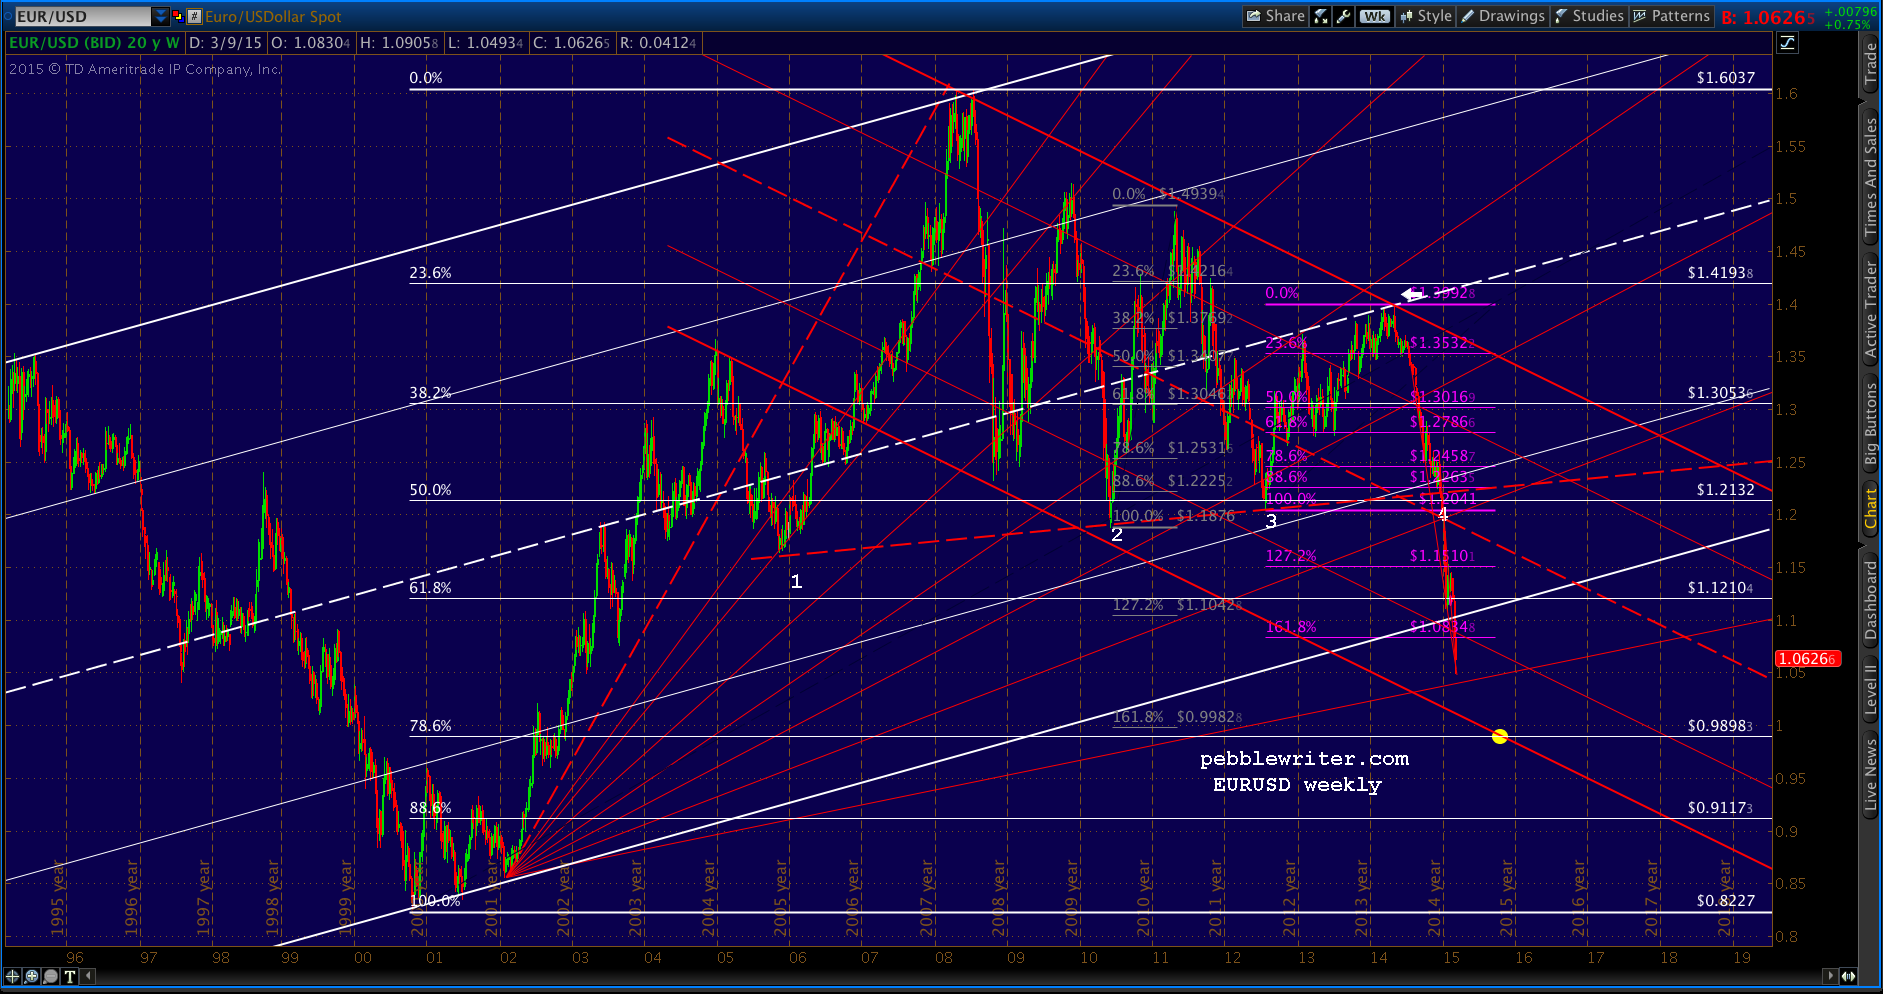
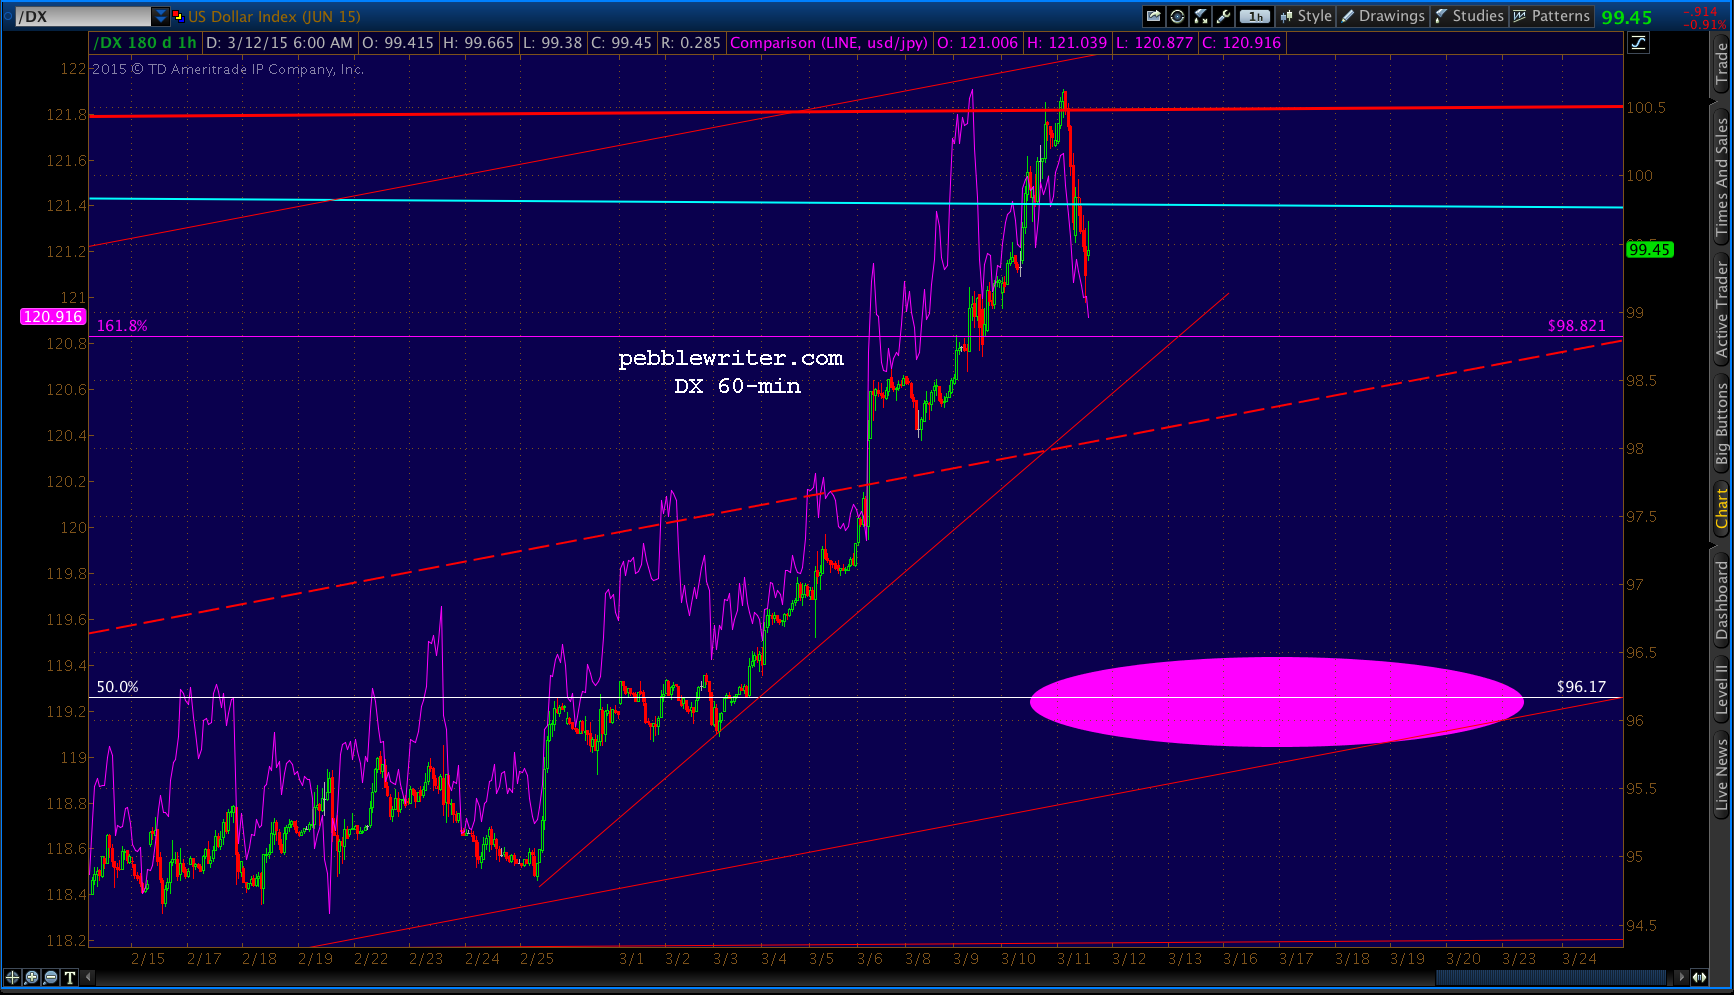 And, EURUSD reversed just a little bit off the TL we placed yesterday. It has been positively correlated with SPX since stocks turned down earlier in the month, so its bounce is helping stocks rally this morning.
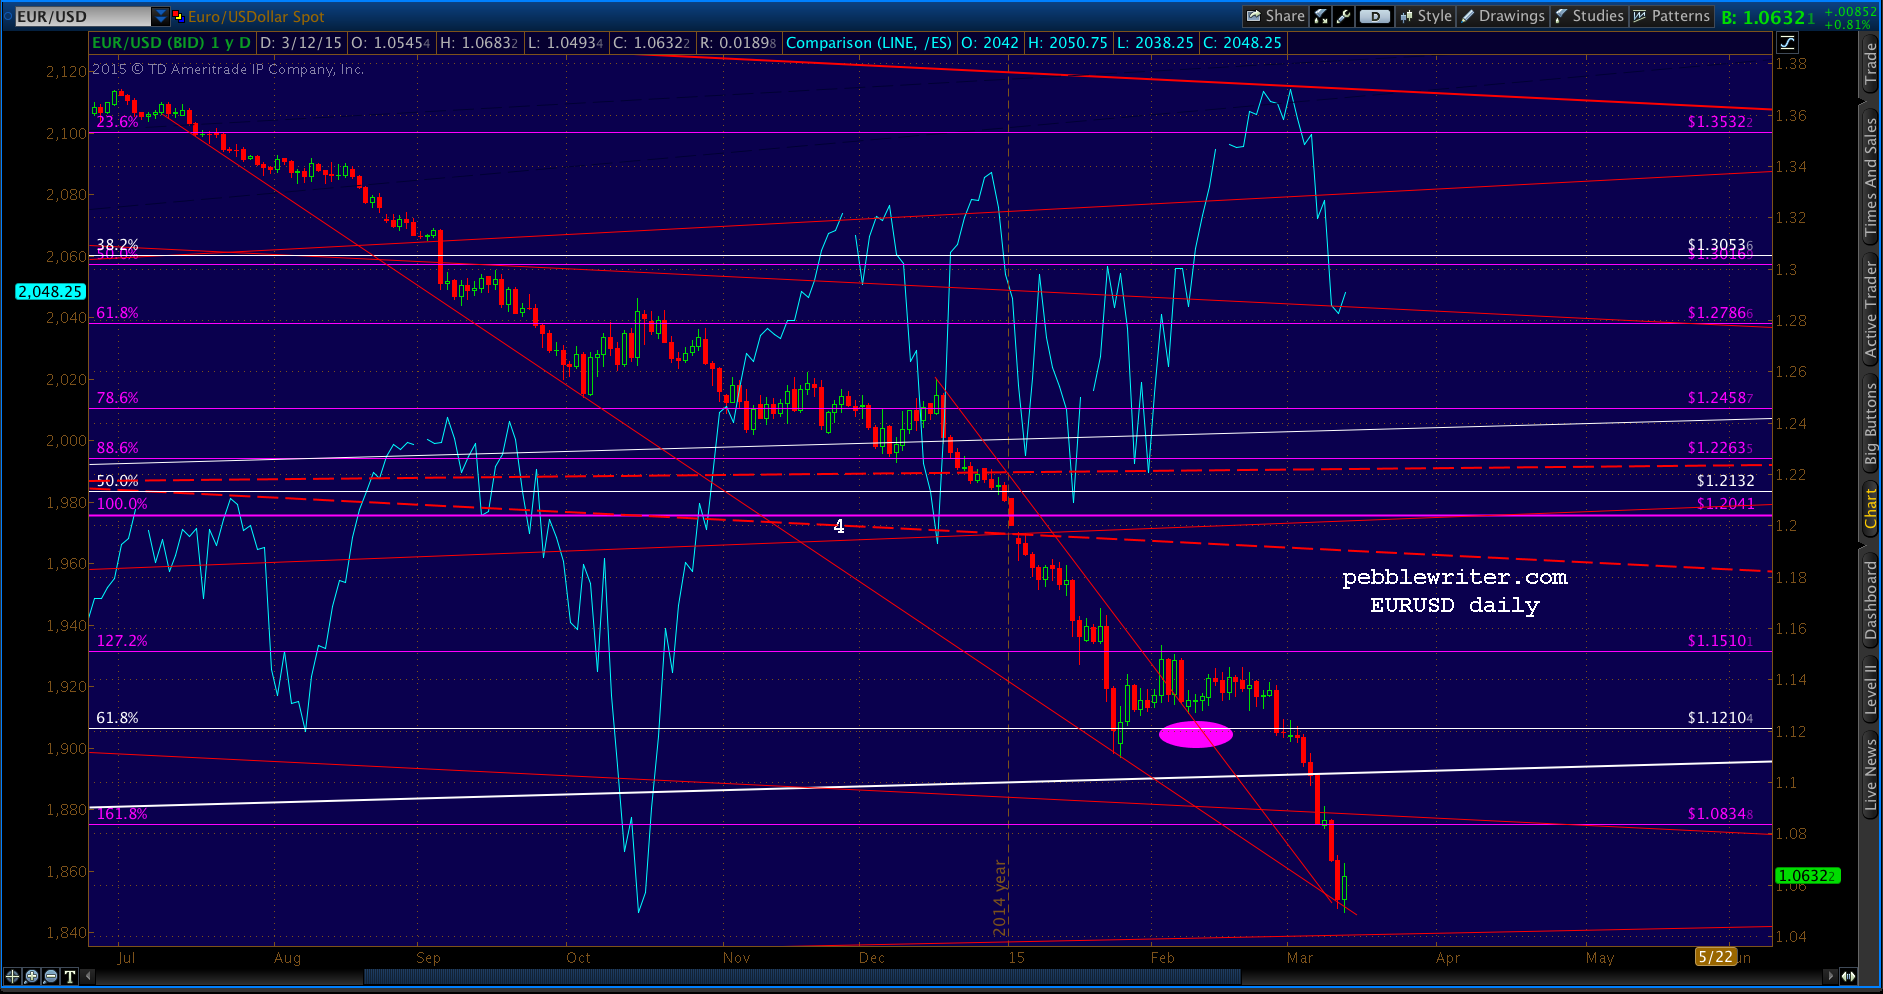 I think this is more short-covering than anything else, and don’t believe the bankers will let it stand. There is a much more appealing target down around 103.90 — a Fib Fan line off the 2002 lows — and, of course at the white .786 at .9898.
 UPDATE: 9:44 AM
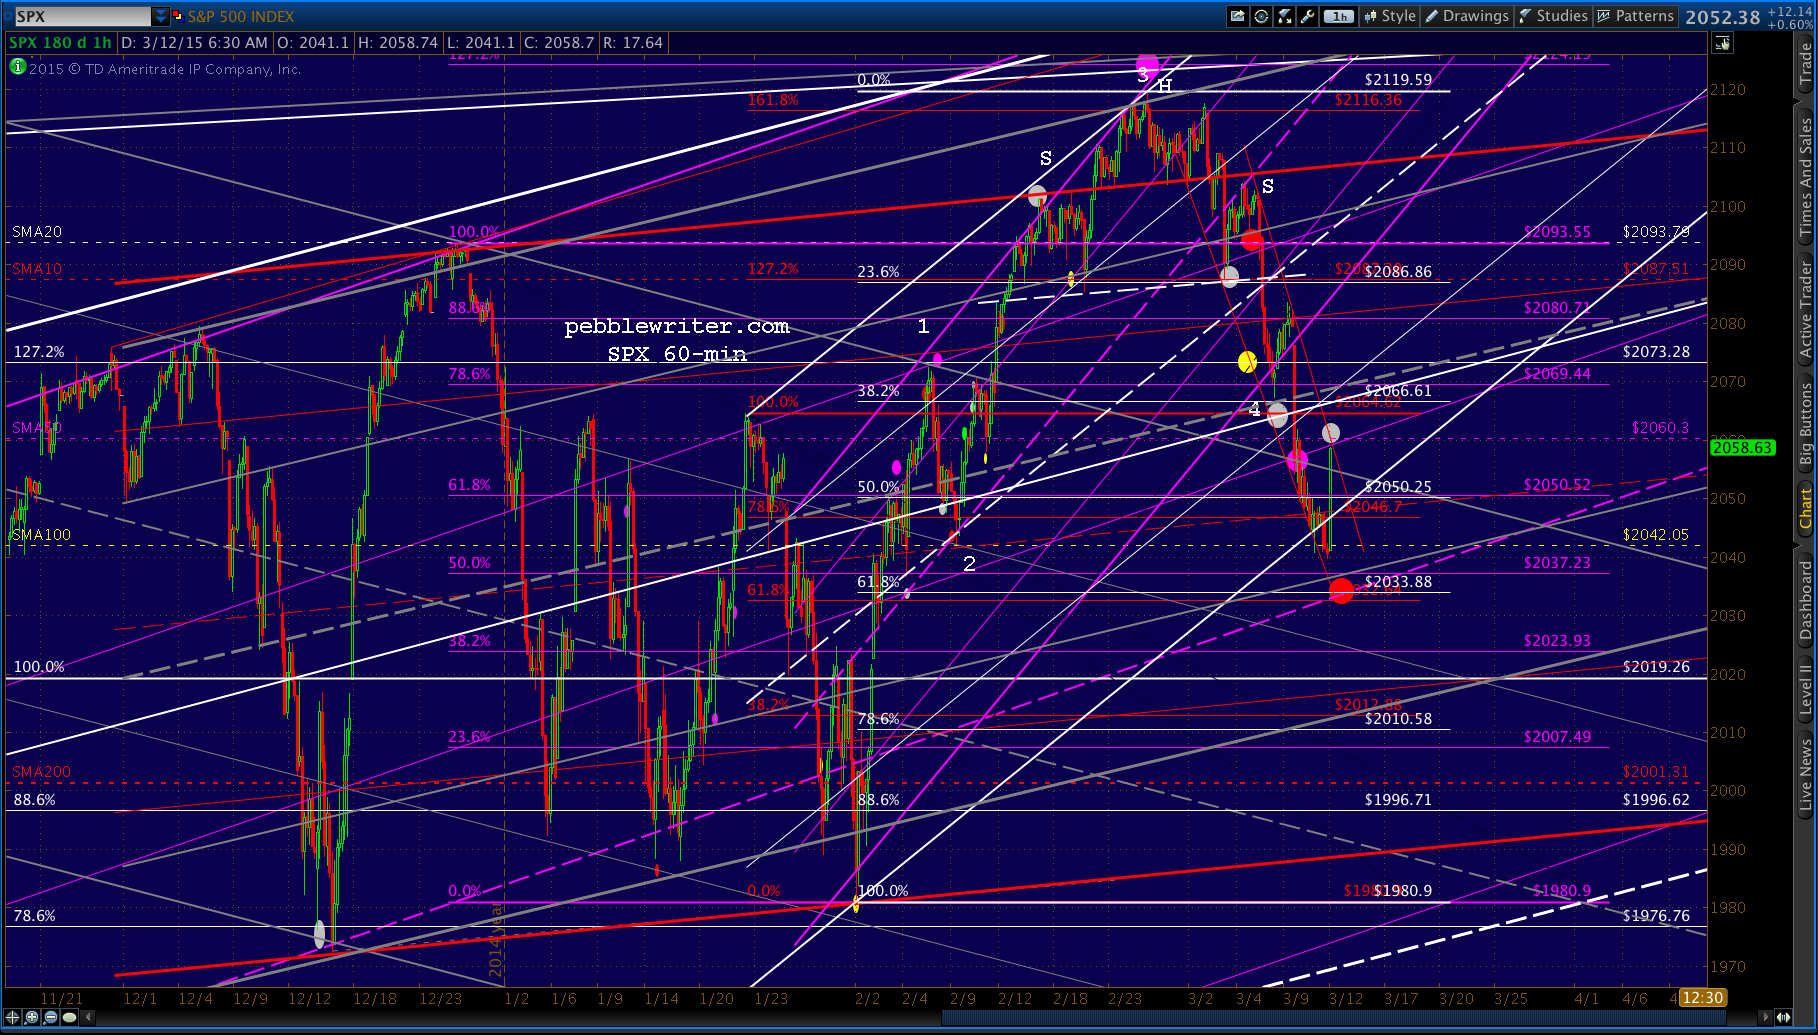
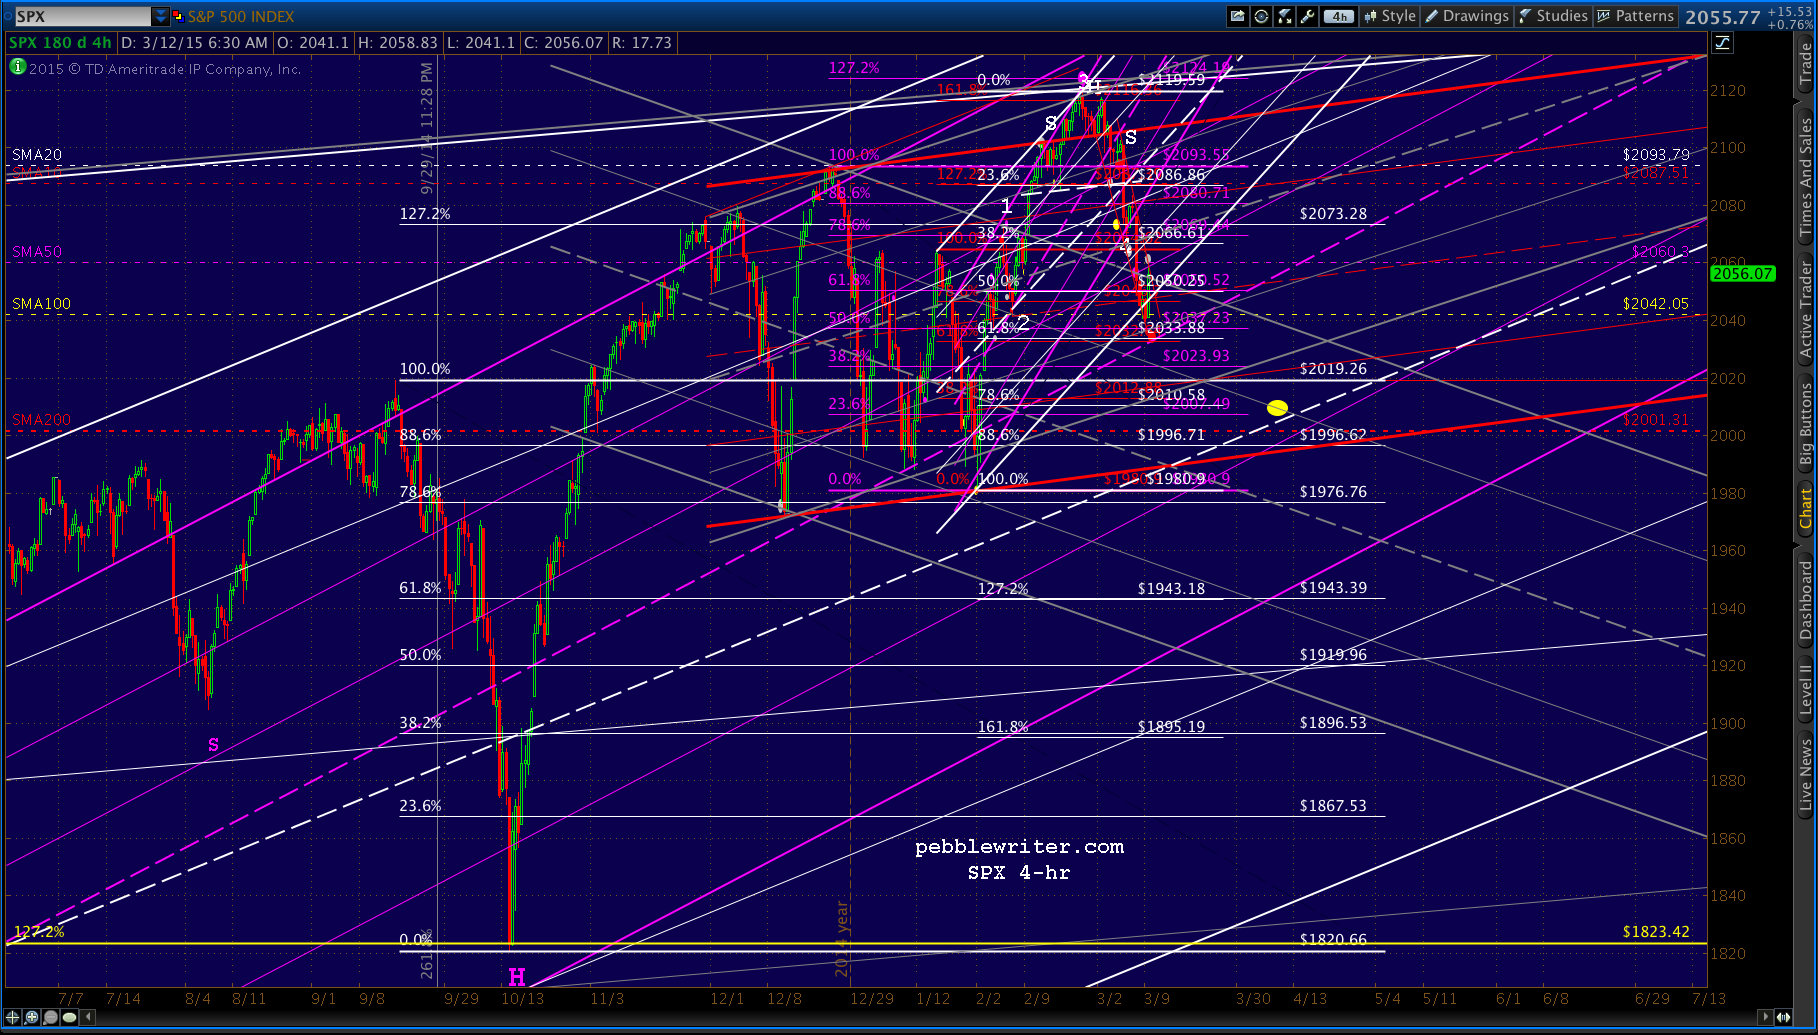
SPX just reached the top of the falling gray channel — a backtest of it and potentially the SMA50? I believe this move will likely run out of steam at 2060.30 — assuming CL and/or USDJPY make their move.
 Here’s an updated chart showing that 2060 would make a nice backtest of the rising purple channel’s .618 line (and the SMA50.)
 Am I positive the downside isn’t over? Not by a long shot. As well as the rising purple channel has performed, I remember all too well the 72-pt Jan 6 bounce that got started before even touching it.
This one, after tagging the SMA100 (actually closing below it yesterday,) could be a repeat. And, yesterday’s lows came within a few pennies of a TL that connects the Oct 15 and Feb 2 lows.
Bottom line, stay frosty and watch those currencies like a hawk. Any second now, we should see CL take advantage of stocks’ rally to make its move. If it slips below that red TL at 47.60 or so, we should get our SPX 2033.
Will USDJPY offset it or merely backtest the purple midline before heading lower?
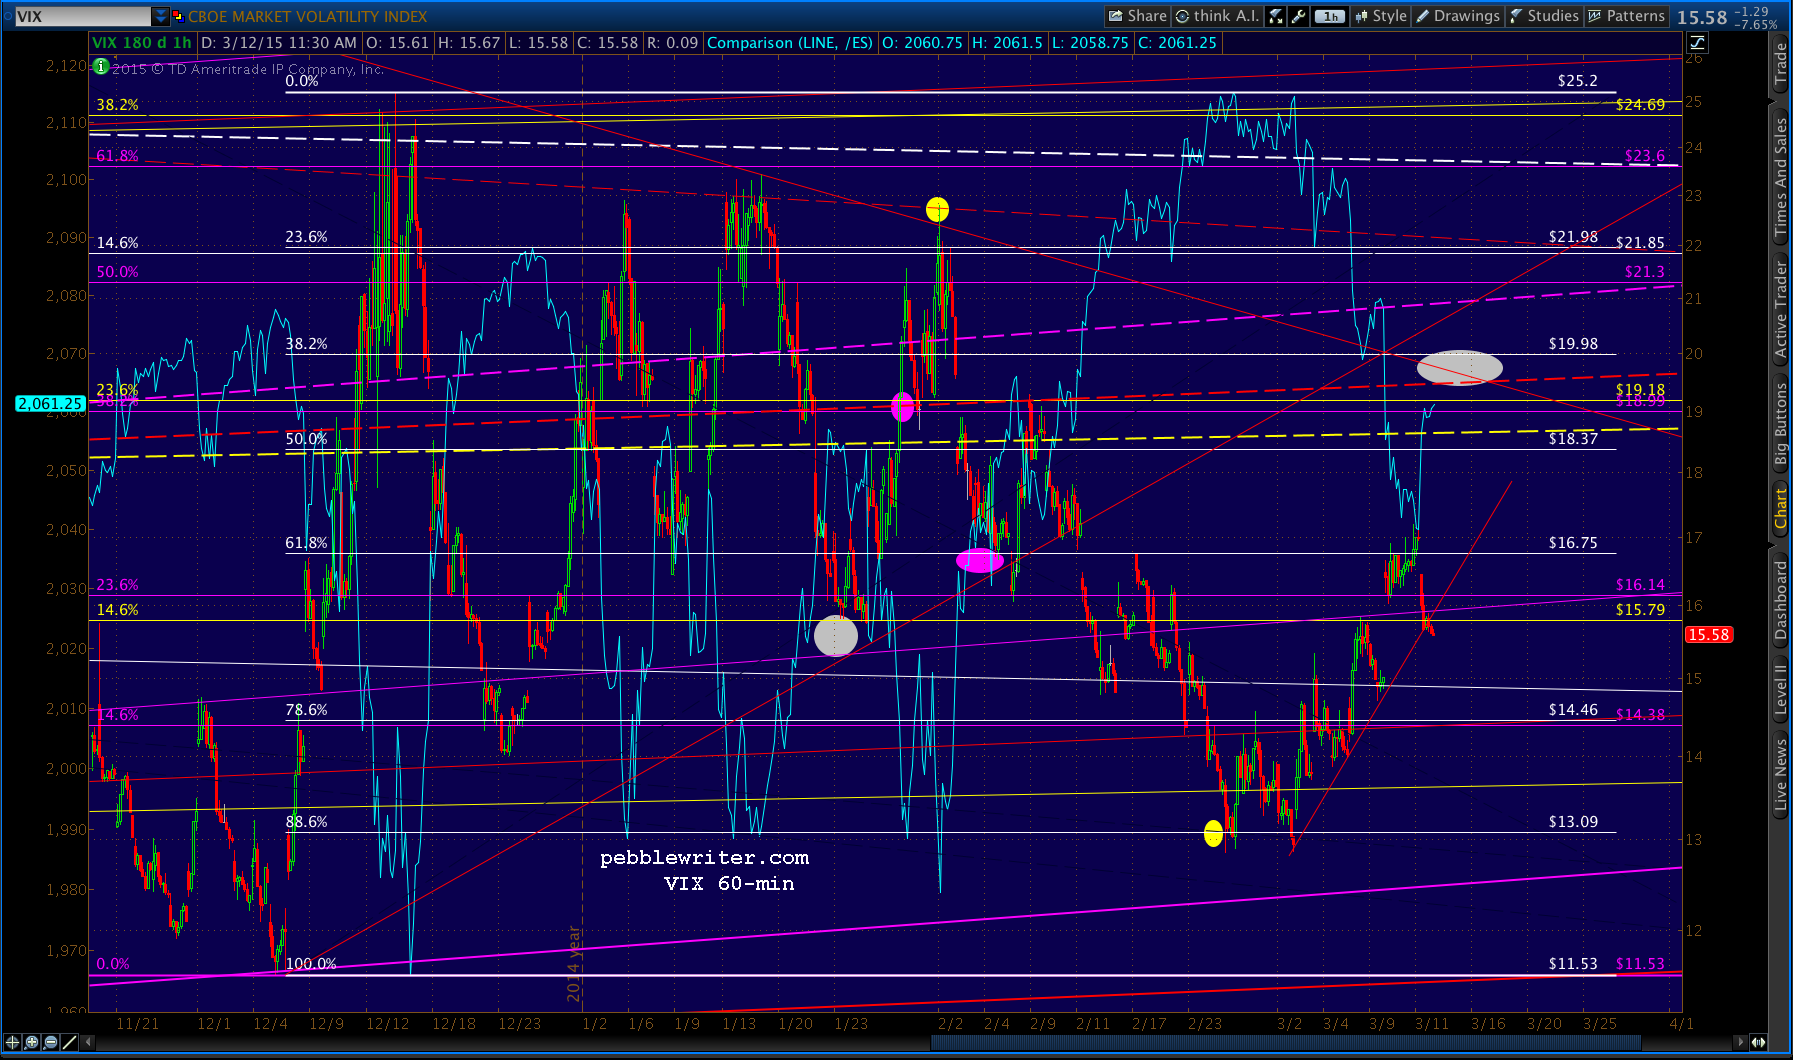
BTW, VIX — with a backtest of a rising purple channel line and possible closure of yesterday’s gap — says we’re going lower. 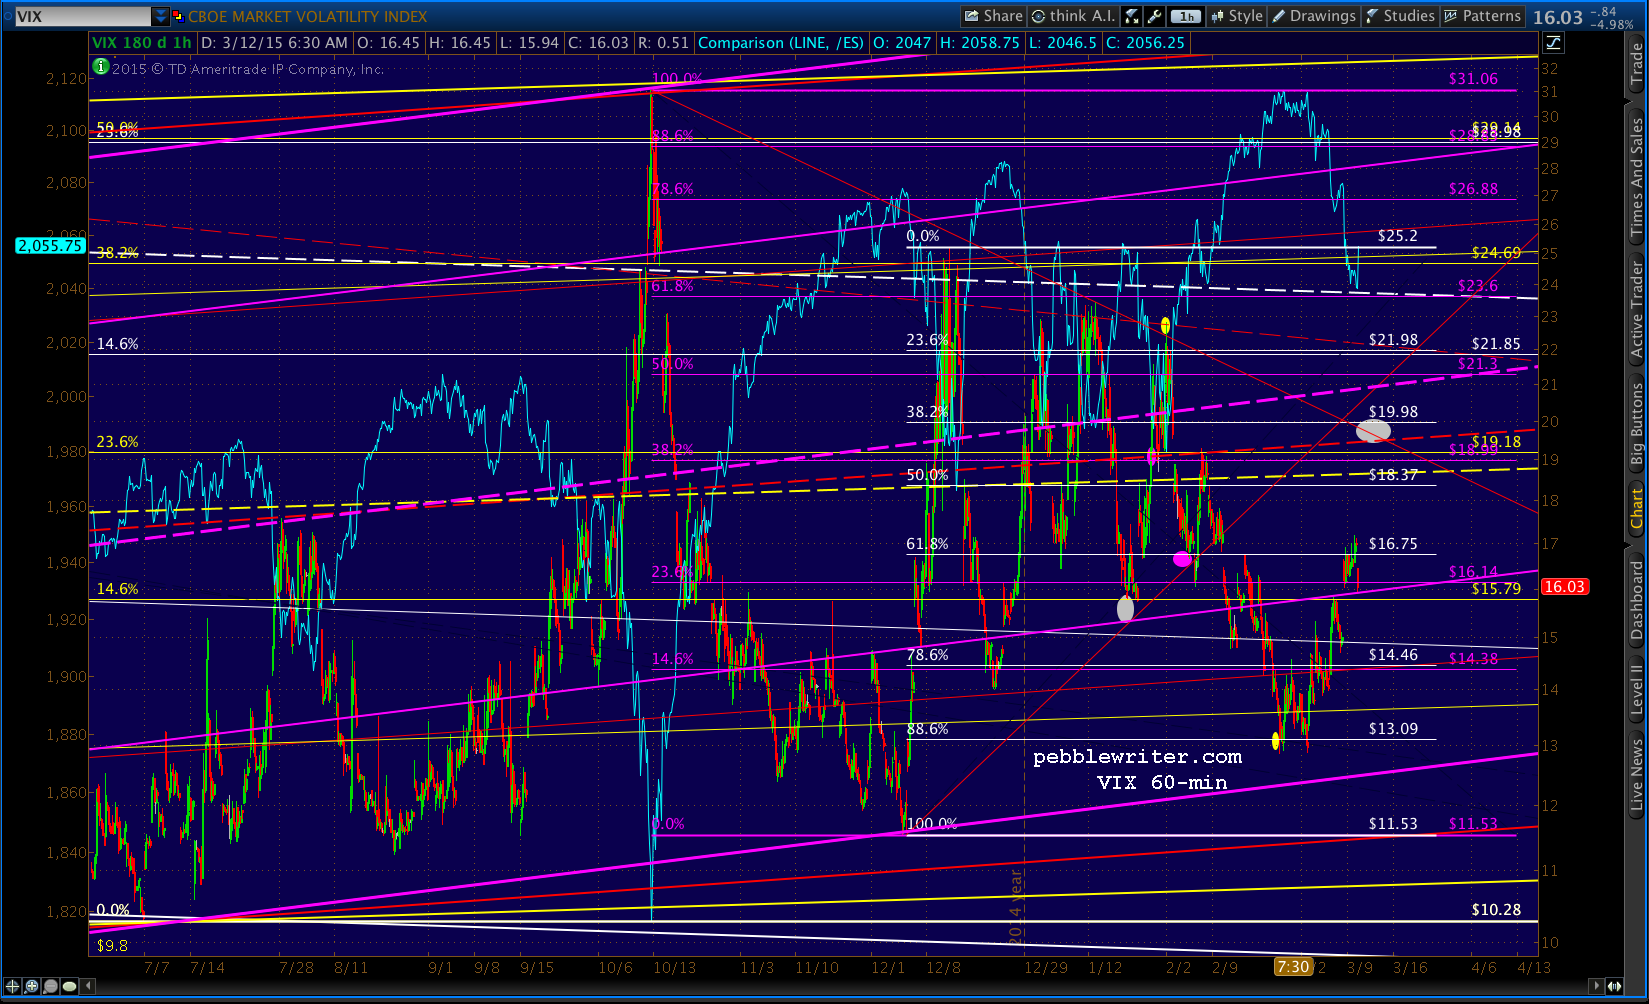 As does ES — which is backtesting the purple channel .236 line.
 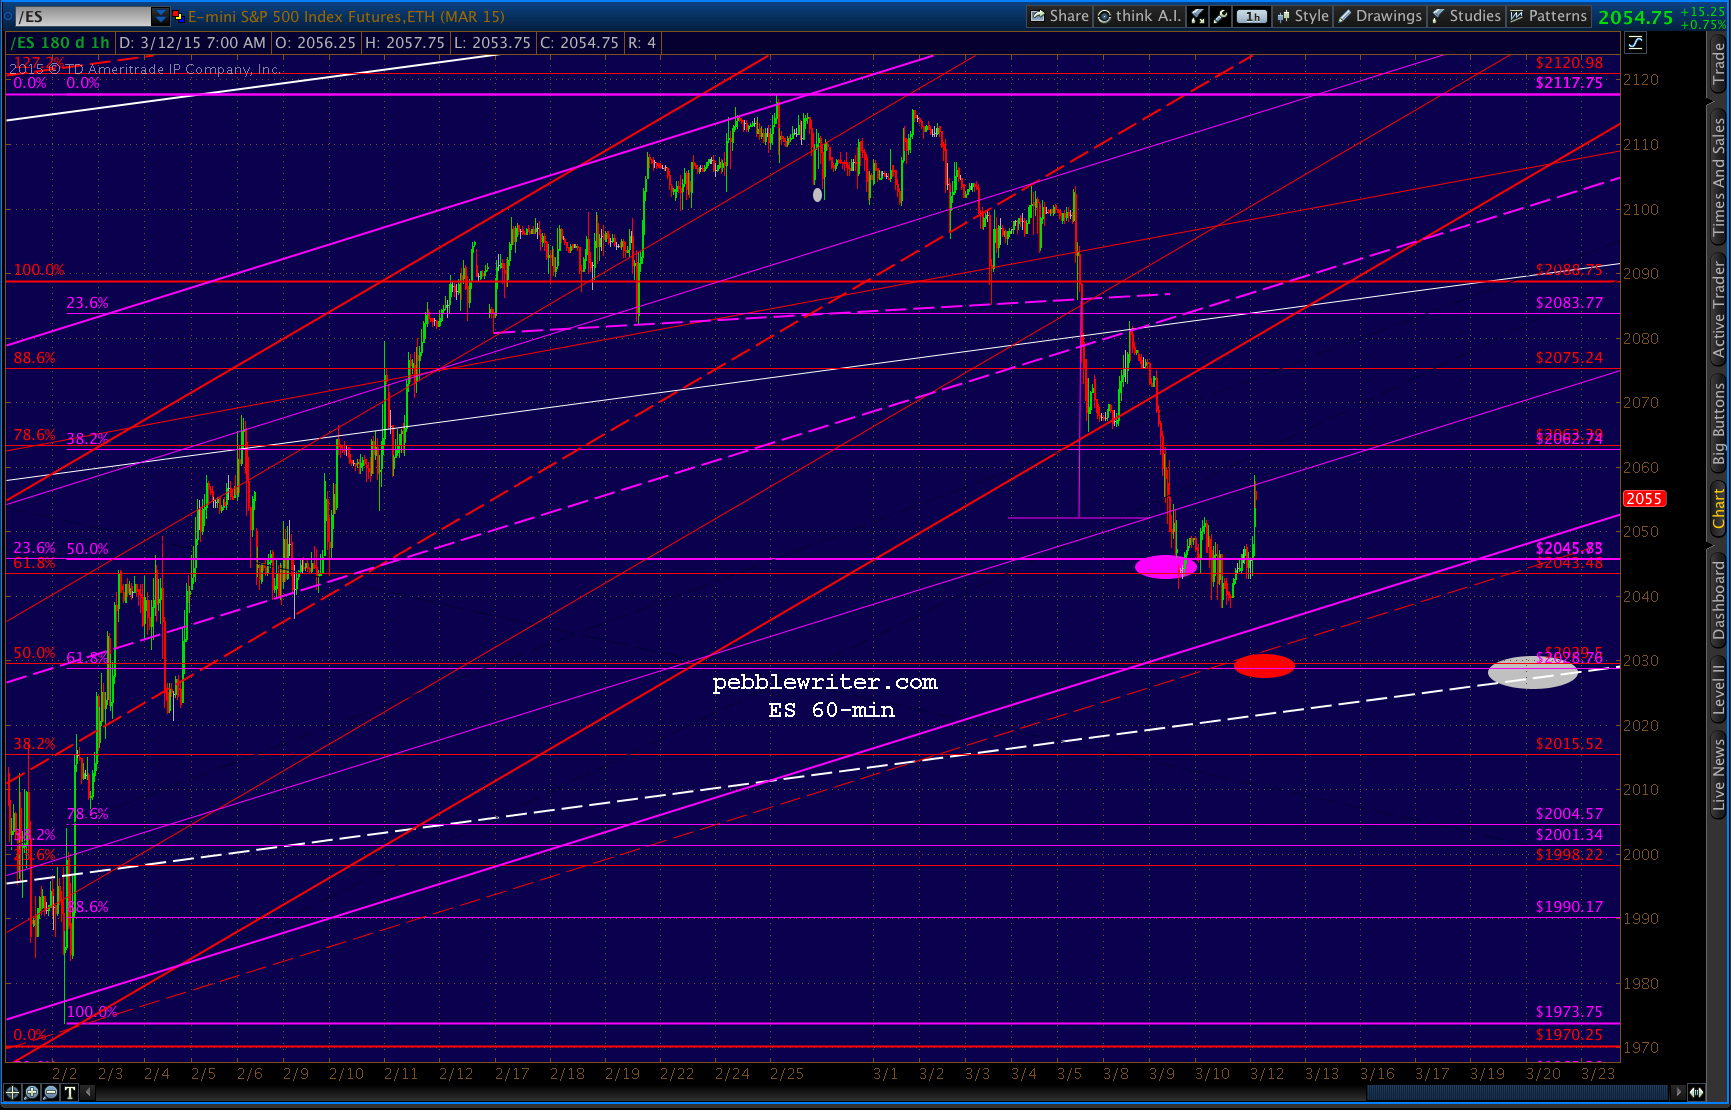 Another wave lower would also do the most damage to the traders playing the SMA100 bounce, so I’ll stick with my 2033 target.
Just thinking out loud, but tagging 2033 would set up a potential Gartley to the white .786 at 2010.58 somewhere in the next week or two when the SMA200 (currently at 2001 and climbing about 1 pt/day) crosses it. We’ll mark it with a yellow dot just to keep it in mind.
 At some point, TPTB really should be looking to tag the rising white channel midline. The purple channel, remember, is smaller and has been rising within the white one as seen on the daily chart below.
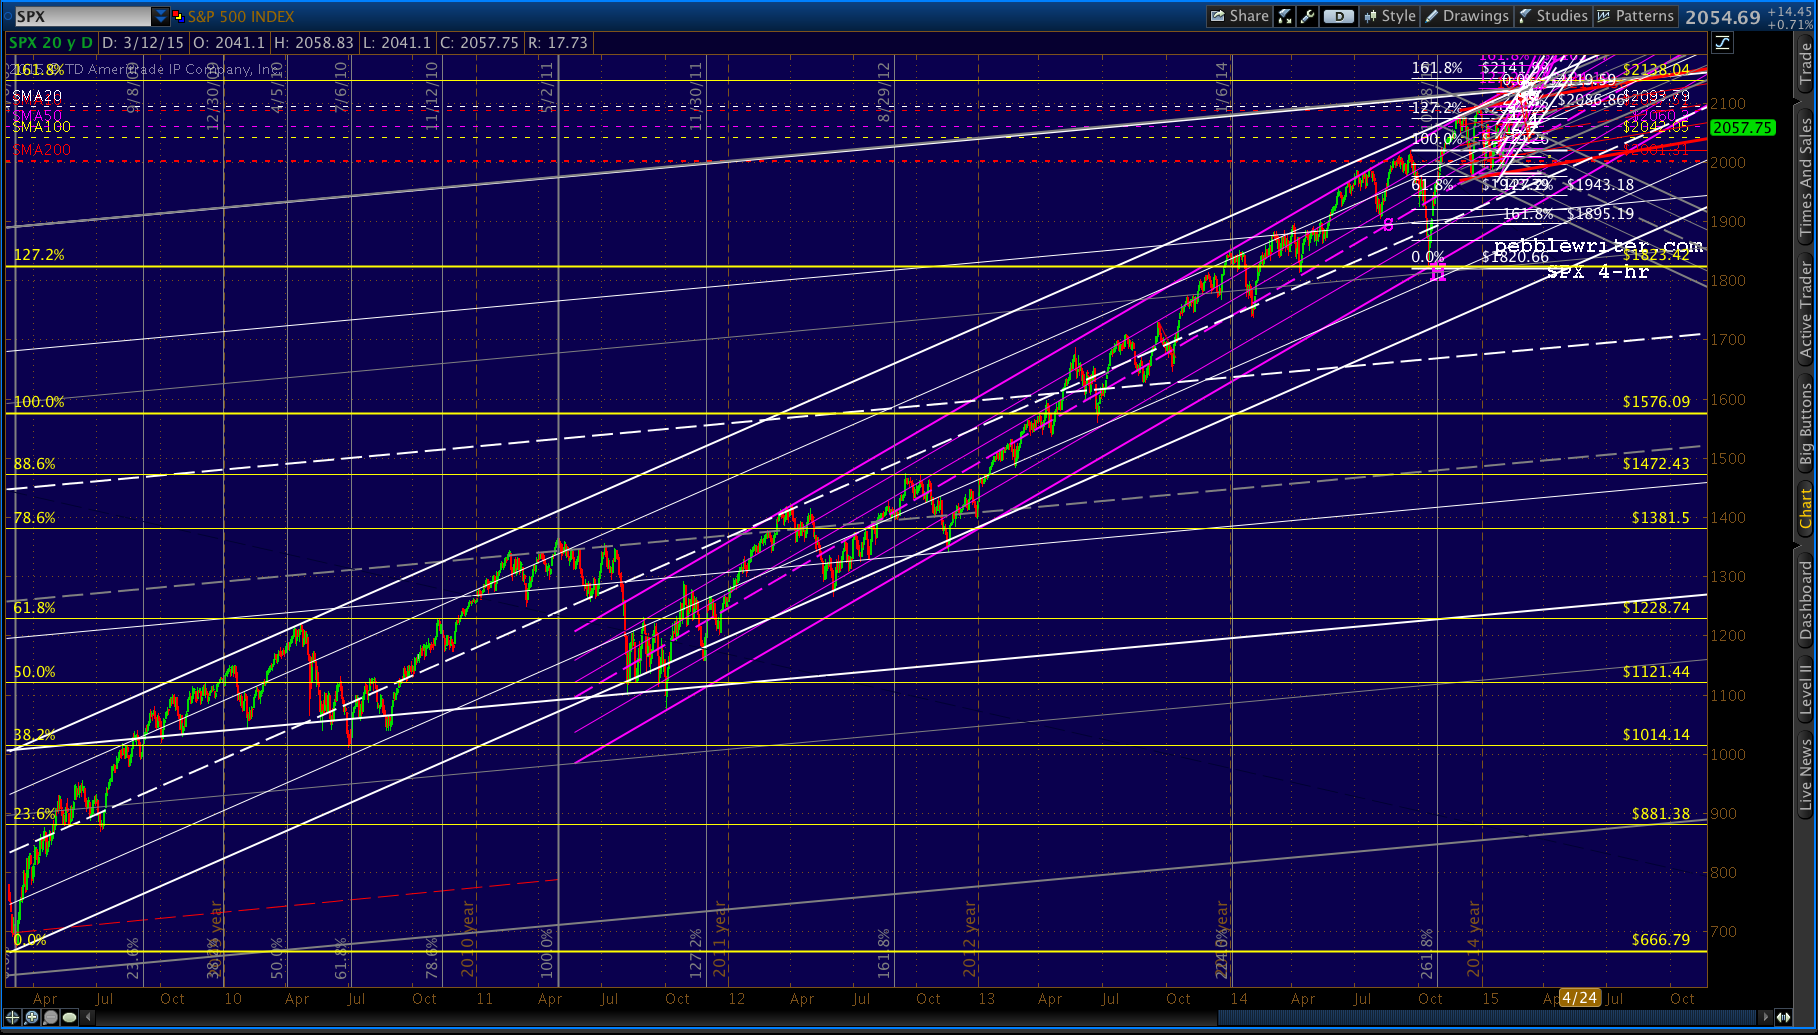 In my opinion, SPX’s chart since December is a true abomination. This is most definitely not a normal pattern of consolidation, but reflects bankers’ desperation to keep the crap game afloat.
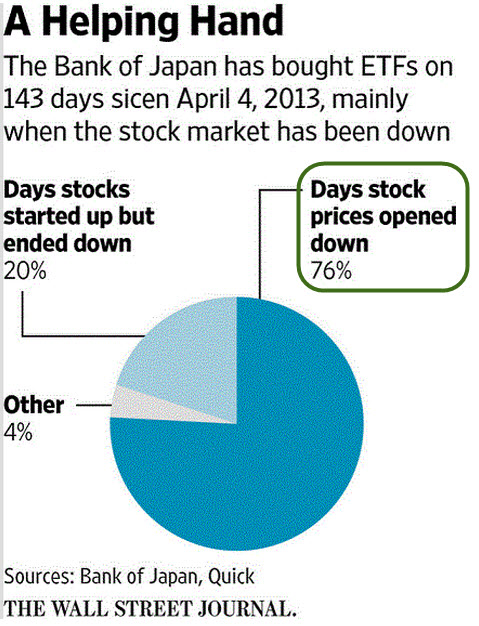
And, they’ve largely given up on trying to make it look legit in favor of actions that ensure every low and every high is just a little higher than the last. One of the most interesting articles I’ve seen in a while is this Zerohedge Article that cites this WSJ article (subscription required.)
The takeaway is that the BOJ — now the single biggest owner of Japanese stocks — has purchased stocks on 76% of the days when the “market” opened down over the past two years. To quote the WSJ:
BOJ officials used to be cautious about purchasing ETFs, worried that it could distort market activities and put the central bank’s own financial health at risk. But, under pressure from politicians following the global financial crisis, the bank changed its stance in late 2010.
“We led the cows to water, but they didn’t drink it, even though we told them it tasted good,” Miyako Suda, who was a board member then, wrote in a a 2014 book discussing monetary easing at that time. “So we thought we should drink it ourselves, showing them it was tasty.”
 As we’ve pointed out countless times, the yen carry trade has been the single biggest factor driving stocks higher since 2011. Propping up the Nikkei props up the USDJPY which props up ES which props up SPX. Thanks to the magic of algorithms and HFT, it really is that simple.
UPDATE: 11:10 AM
Ok, bears. It’s pretty much now or never. European close coming up in 20 minutes…
 UPDATE: 1:30 PM
Could the broken falling wedge be morphing into a plain ol’ falling channel? The algos have been able to prop up SPX at the SMA50 so far…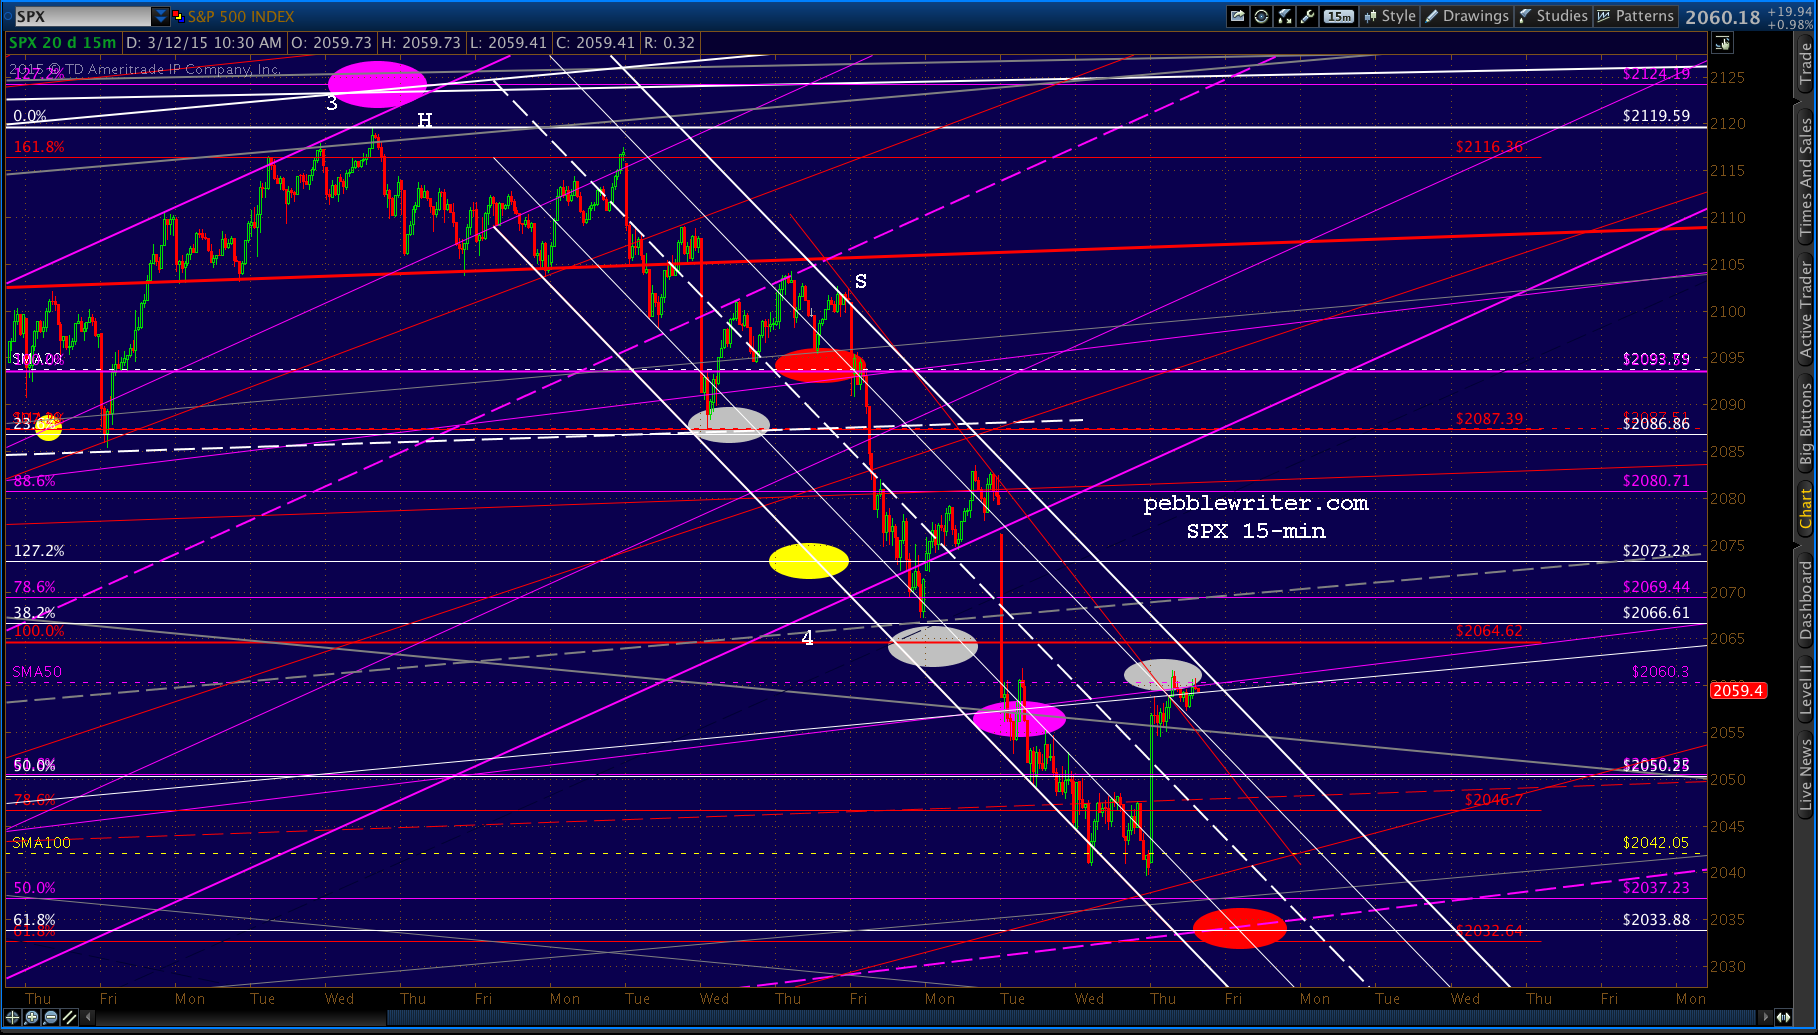 …relying mostly on the USDJPY…
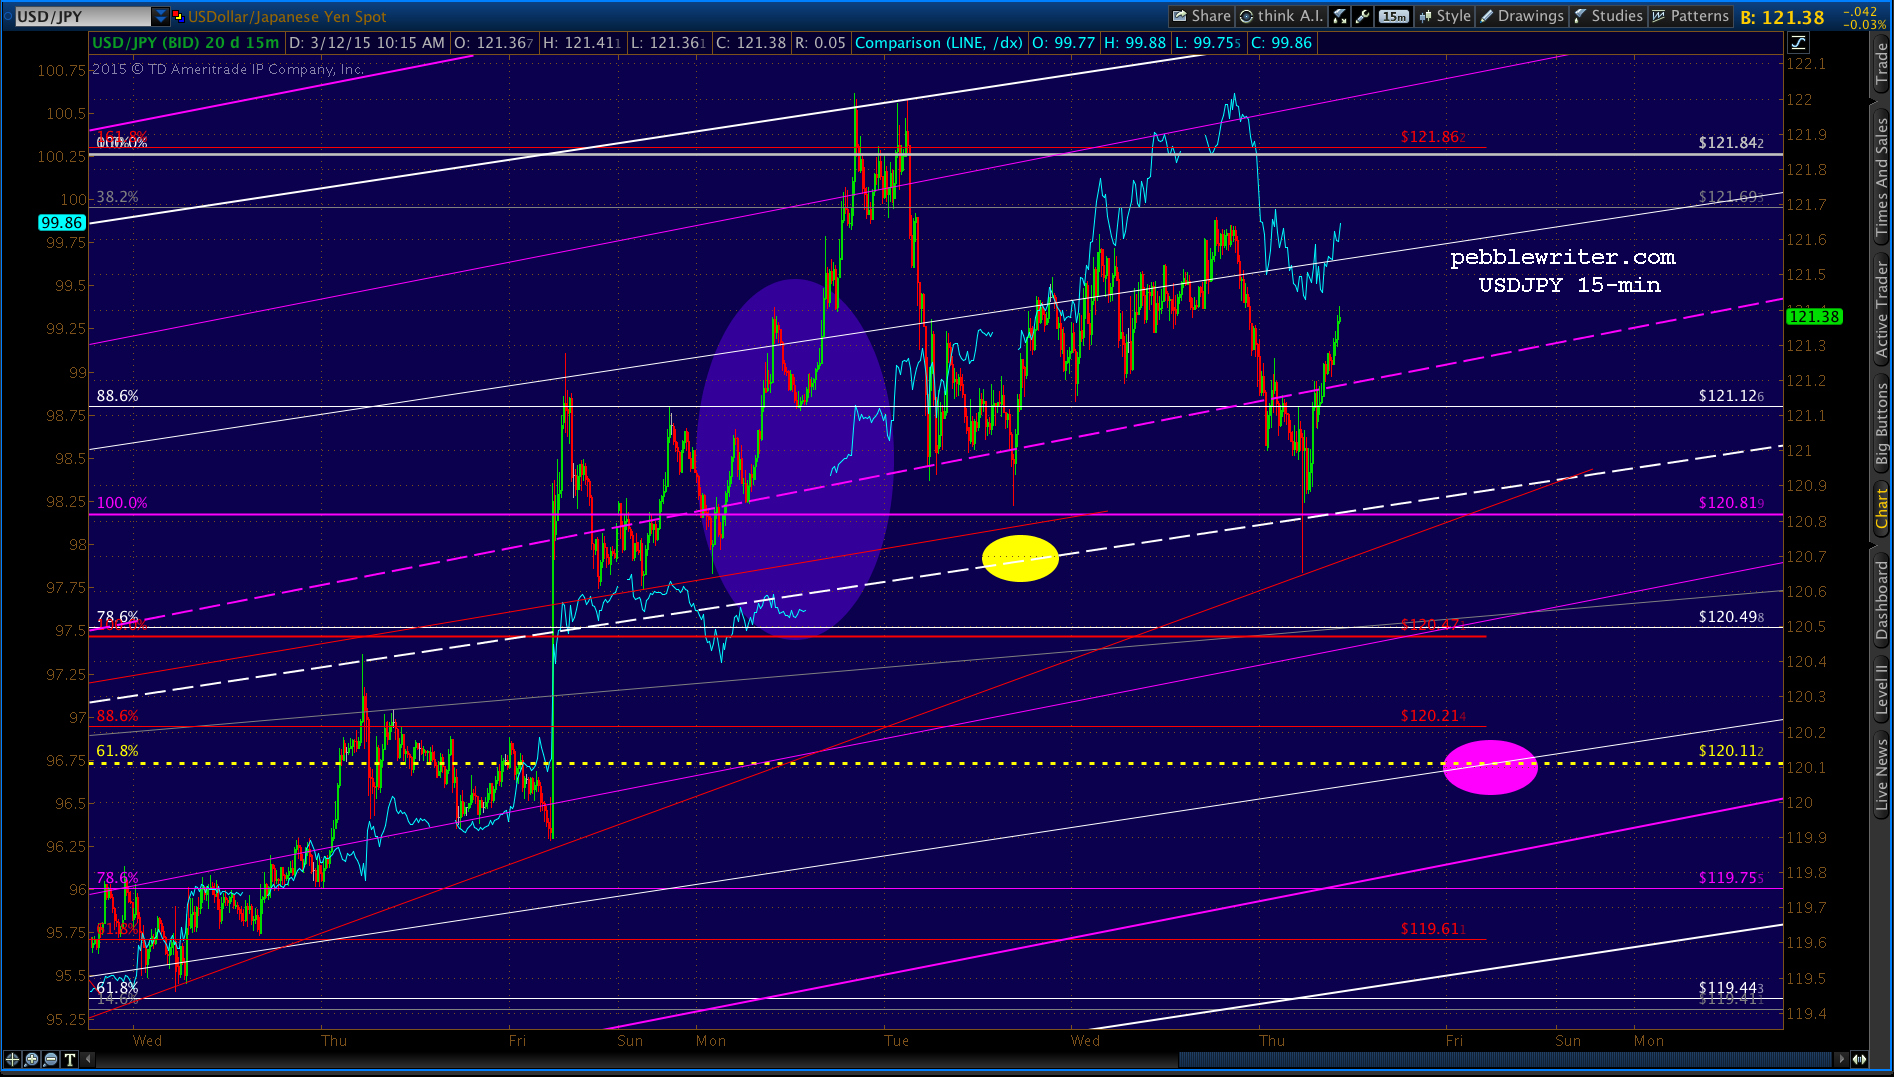 …and — in the last hour or so — CL.
 UPDATE: 3:00 PM
SPX is breaking out of the white channel. Nothing wrong with chasing it, as long as you keep your stops where you’re comfortable.
 CL is falling towards our yellow target…
 …but, as we discussed earlier, is being out-influenced by USDJPY…
 …and, VIX.
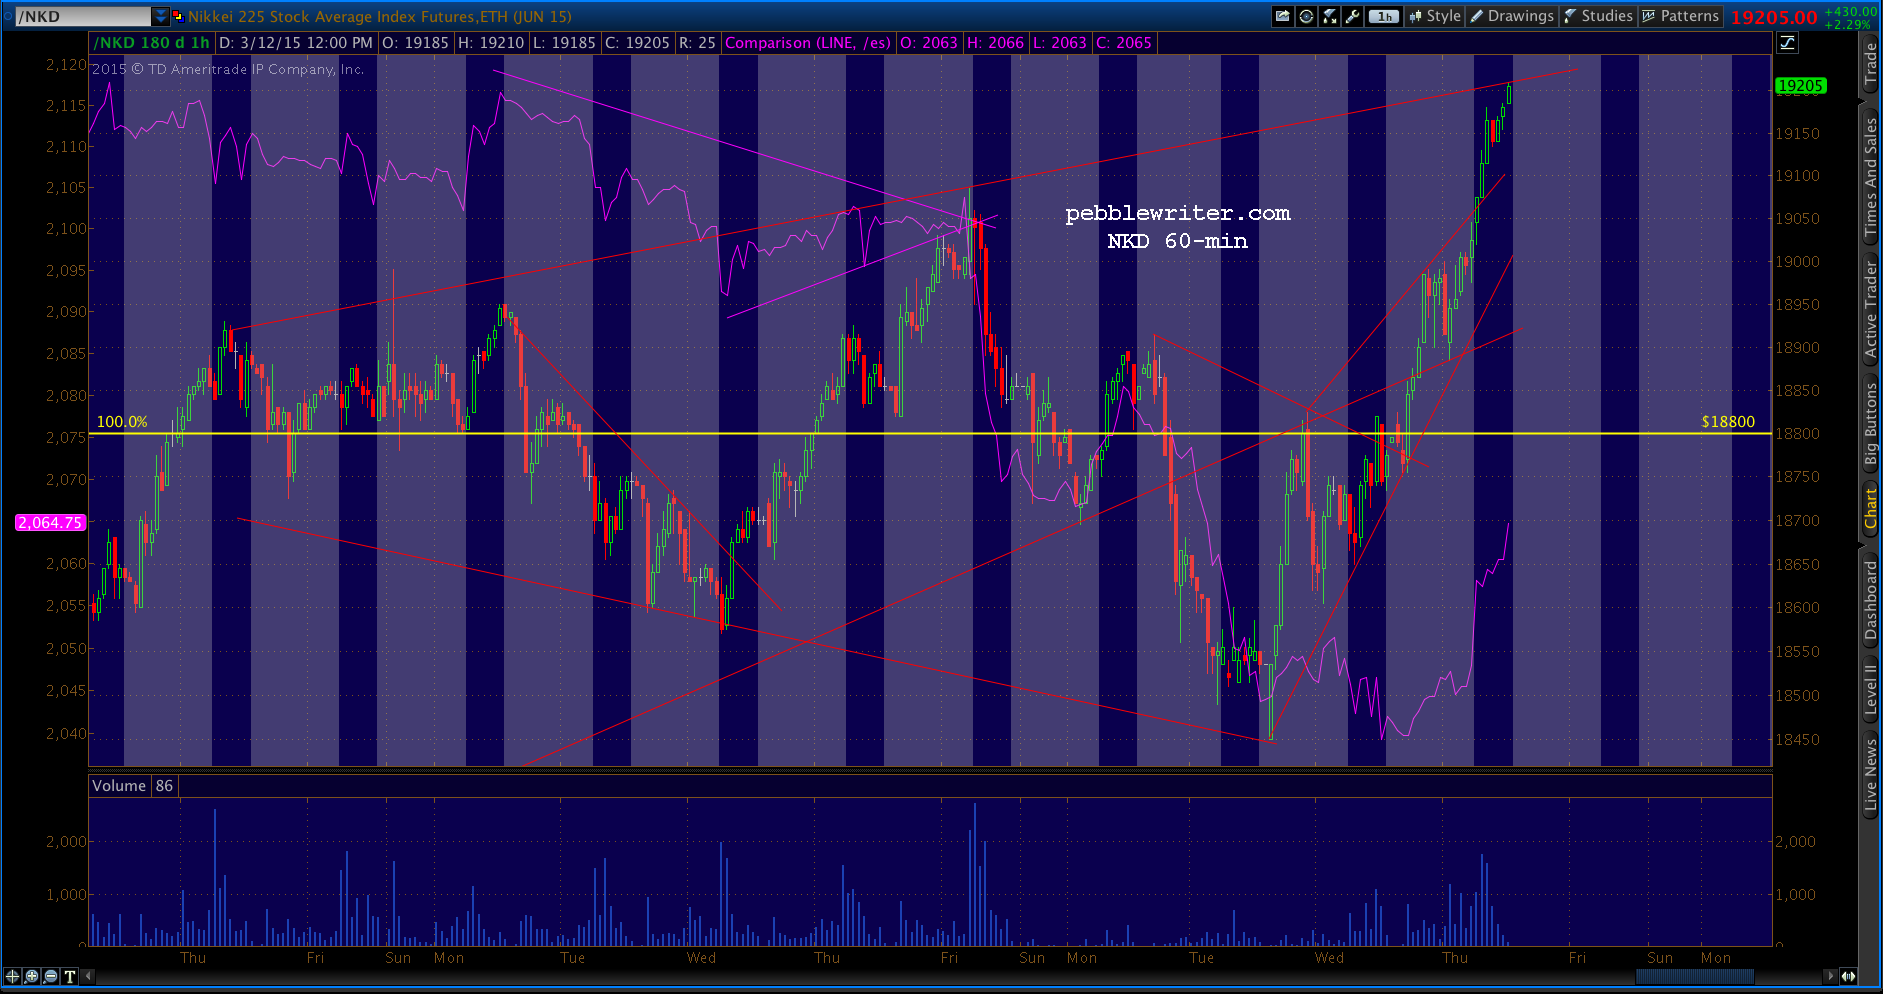
 NKD is, of course, getting in on the act — breaking above its 2007 high for the sixth time in eleven sessions. Interestingly, though, NKD has hit a TL of resistance that indicates a possible head fake to stocks’ breakout.
 We’ll watch to see what happens to CL and USDJPY over the last hour of trading (though, as regular readers know, most of the really good manipulation occurs in the after hours.) IF this is a head fake, look for SPX to close around 2069.44 and USDJPY to reverse near the white channel .786 line around 121.5.
If it’s the real deal, then this morning’s targets for CL and USDJPY could easily be tagged after the cash markets close without doing any damage to SPX.
The tricky close would be if SPX drops to 2060 in the final hour — leaving traders to decide whether it’s a backtest or ??? If it’s really off to the races, the next upside target is 2083-2086.