

Last Friday, we updated SPX’s price targets to reflect the completion of the H&S Pattern we had originally forecast back on March 4.
If the H&S should play out, it would target around 2060 — which is coincidentally (or not!) the SMA50 and might allow a backtest of the broken falling gray channel.
Ultimately, I think we’ll see backtest of the falling gray channel as we suggested last Wednesday.
With the e-minis off as much as 20 points earlier this morning, the stage is indeed set for our target — the SMA50 — to be tested.
 As we discussed in yesterday’s members’ section:
…at this point I’d have to go with more downside before the big bounce gets started in earnest. The SMA50 at 2062 would be a good starting point, though the gray channel backtest at 2055-2057 is more appealing.
From there, the “market’s” next moves might surprise a lot of traders.
continued for members…
Today’s SPX chart shows the original white dot we placed at the SMA50 (2062.) But, we’ve retained the purple dot at the gray channel upper bound due to the bullish implications of a backtest.
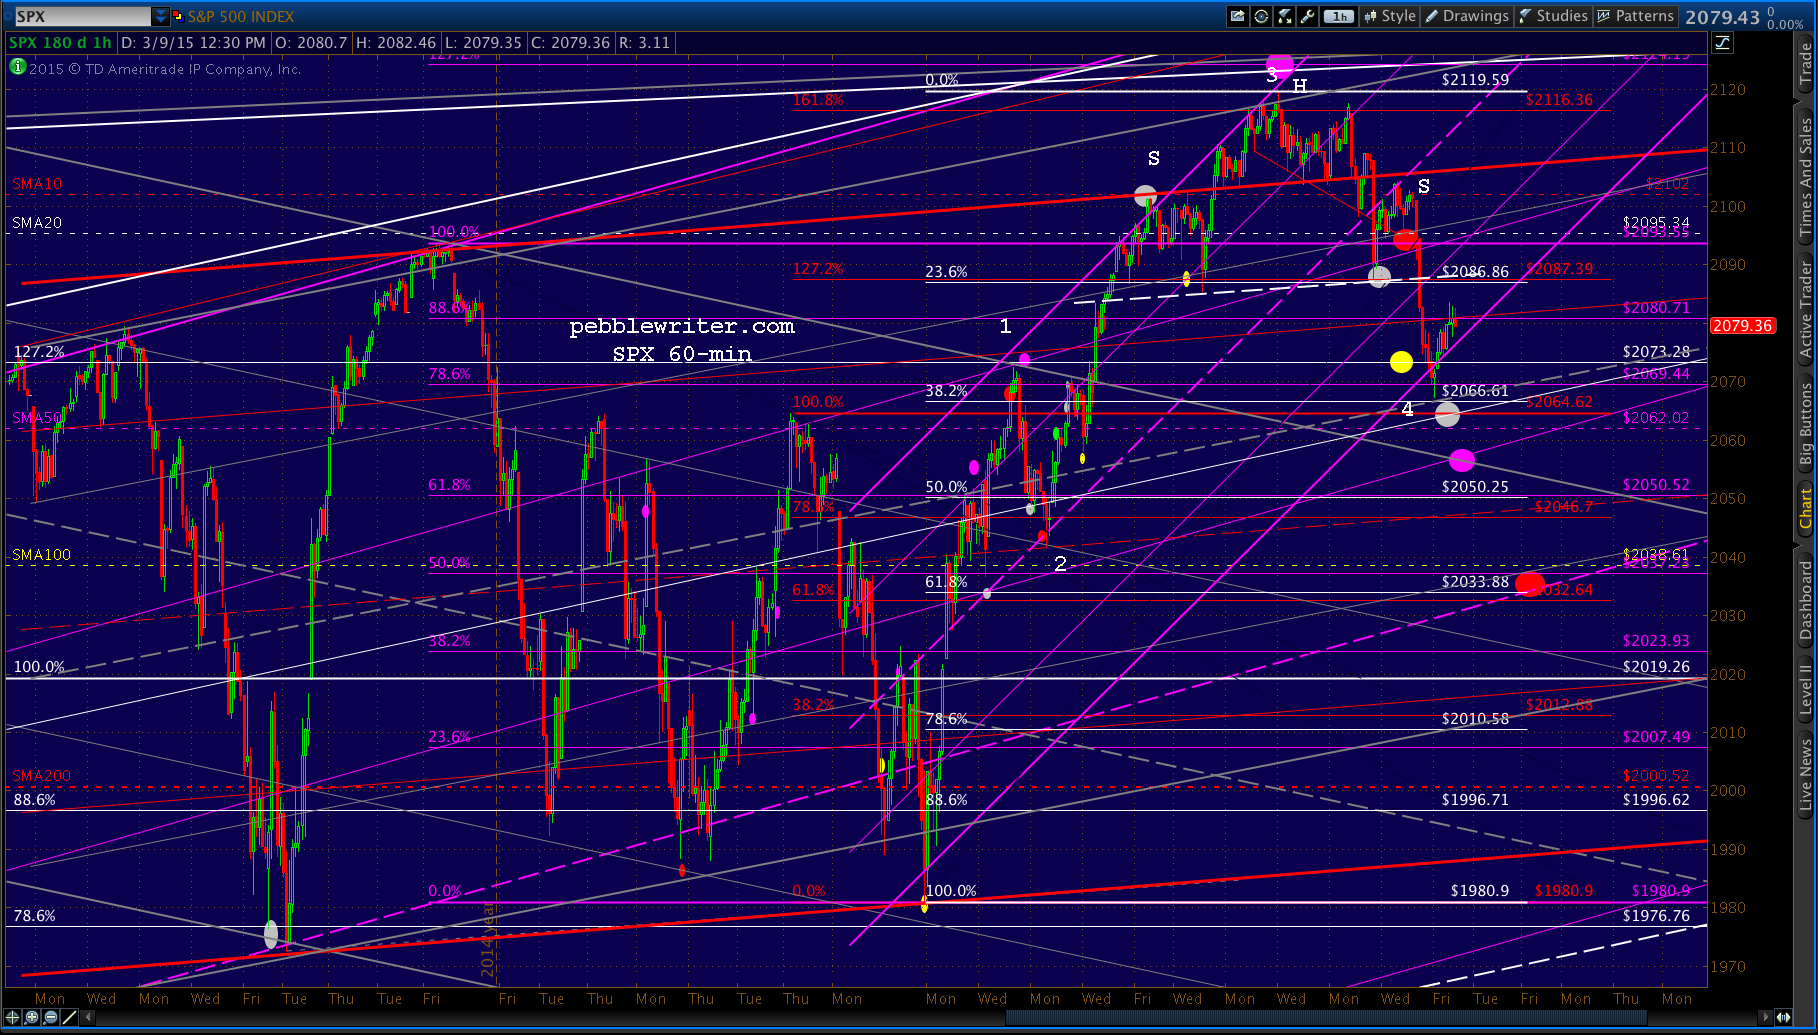 Moving averages rarely reverse prices on the nose. So, a slight overshoot to 2056 would not surprise. Should that level of support not hold, then the next major support is 2033 — the white .618 where it intersects with the strong purple channel midline.
It will all depend on whether CL, USDJPY, EURUSD and VIX cooperate.
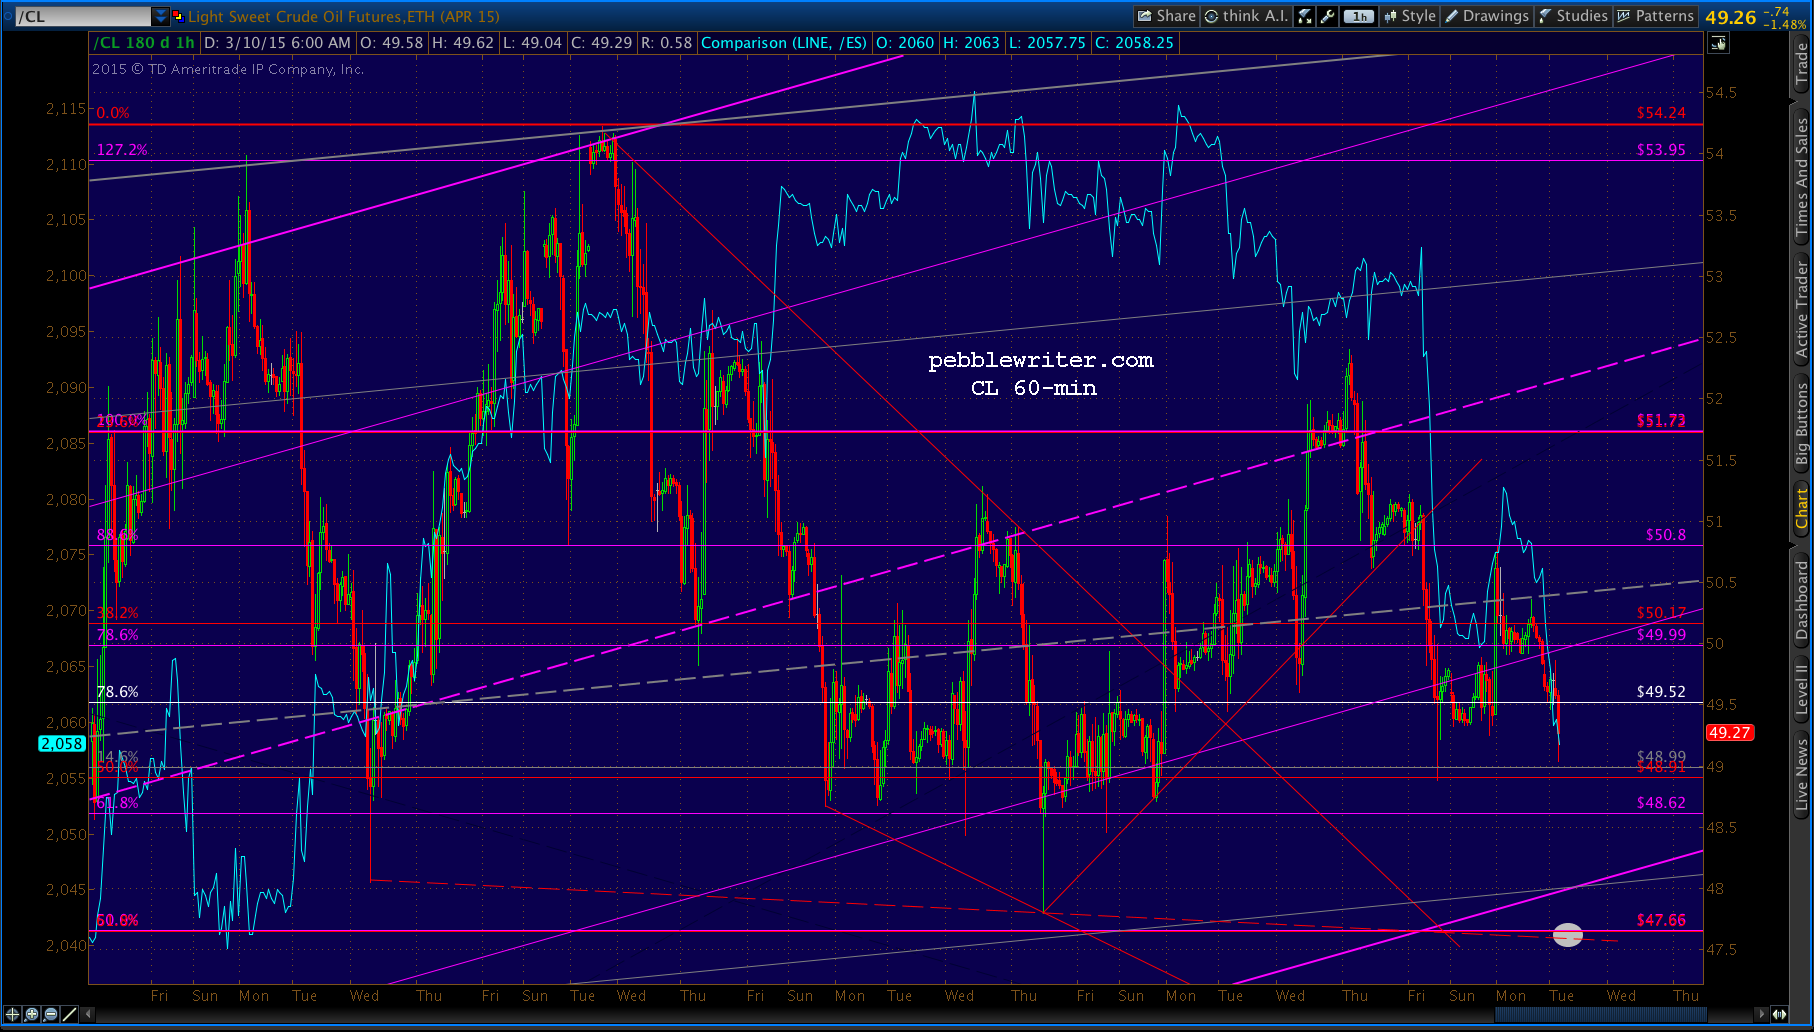
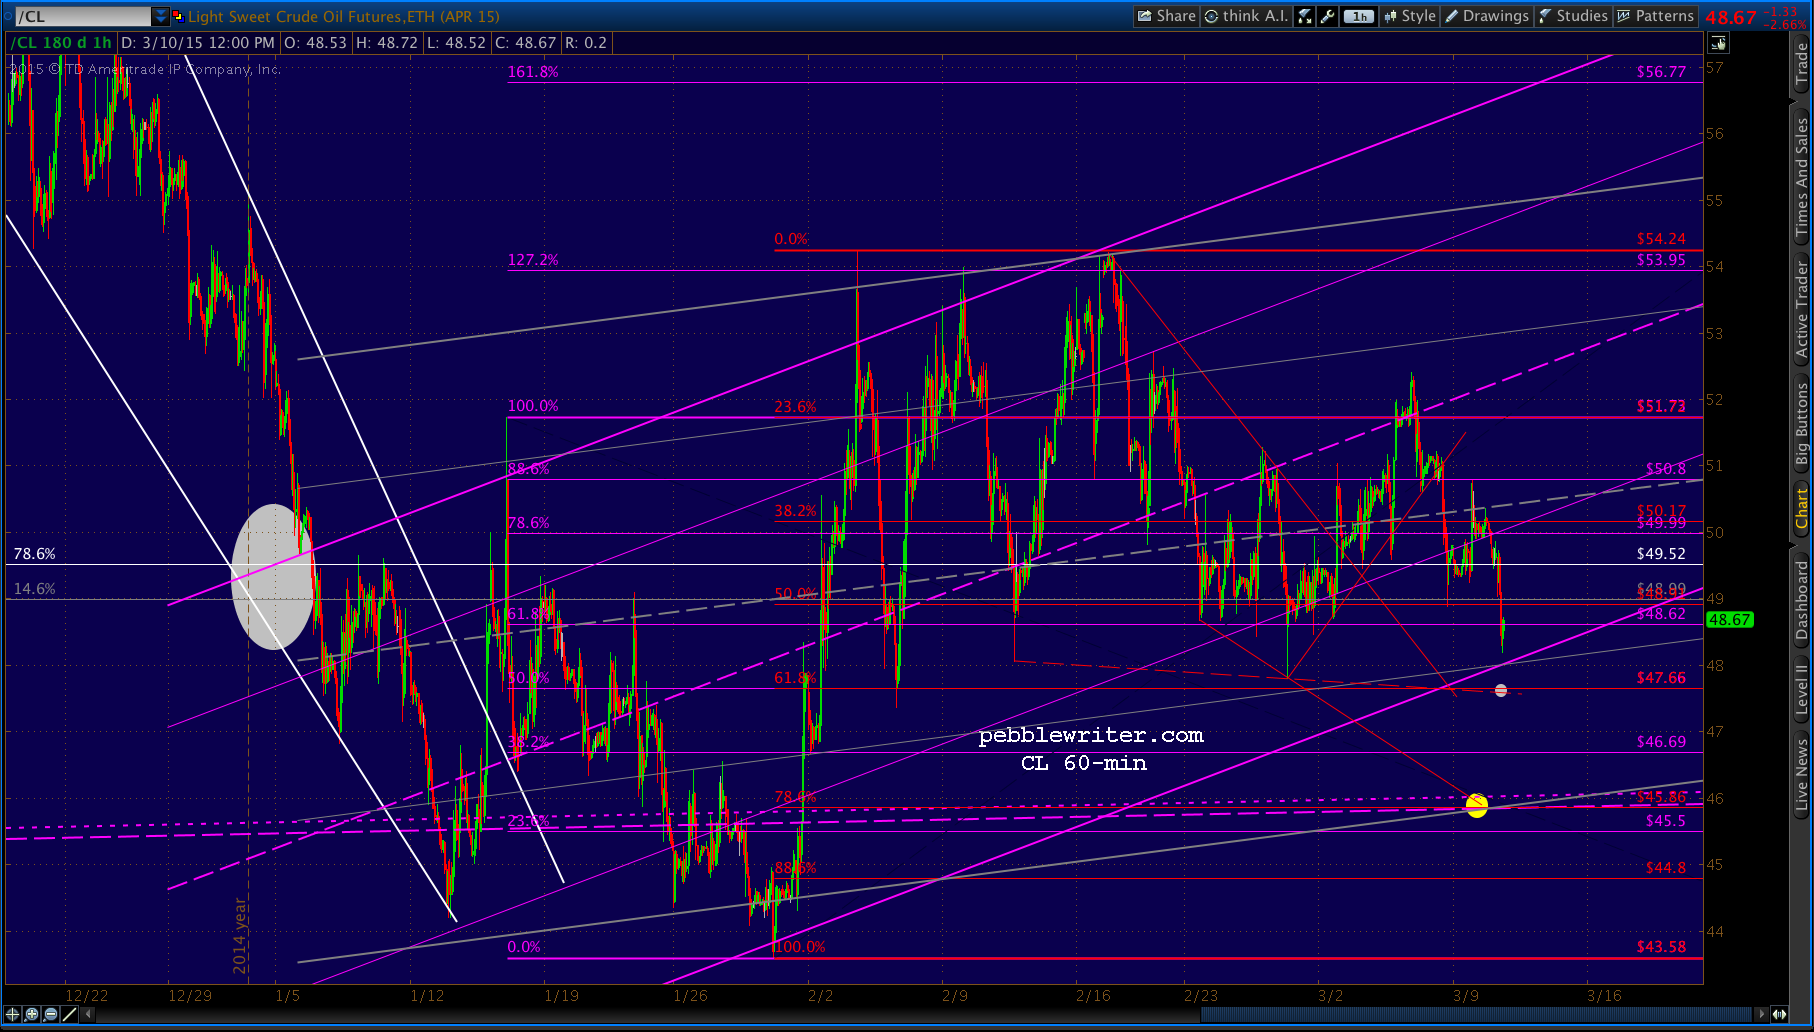
CL is doing its part to push prices lower this morning. Though yesterday’s euroramp delayed things, the purple channel bottom is still our #1 target.
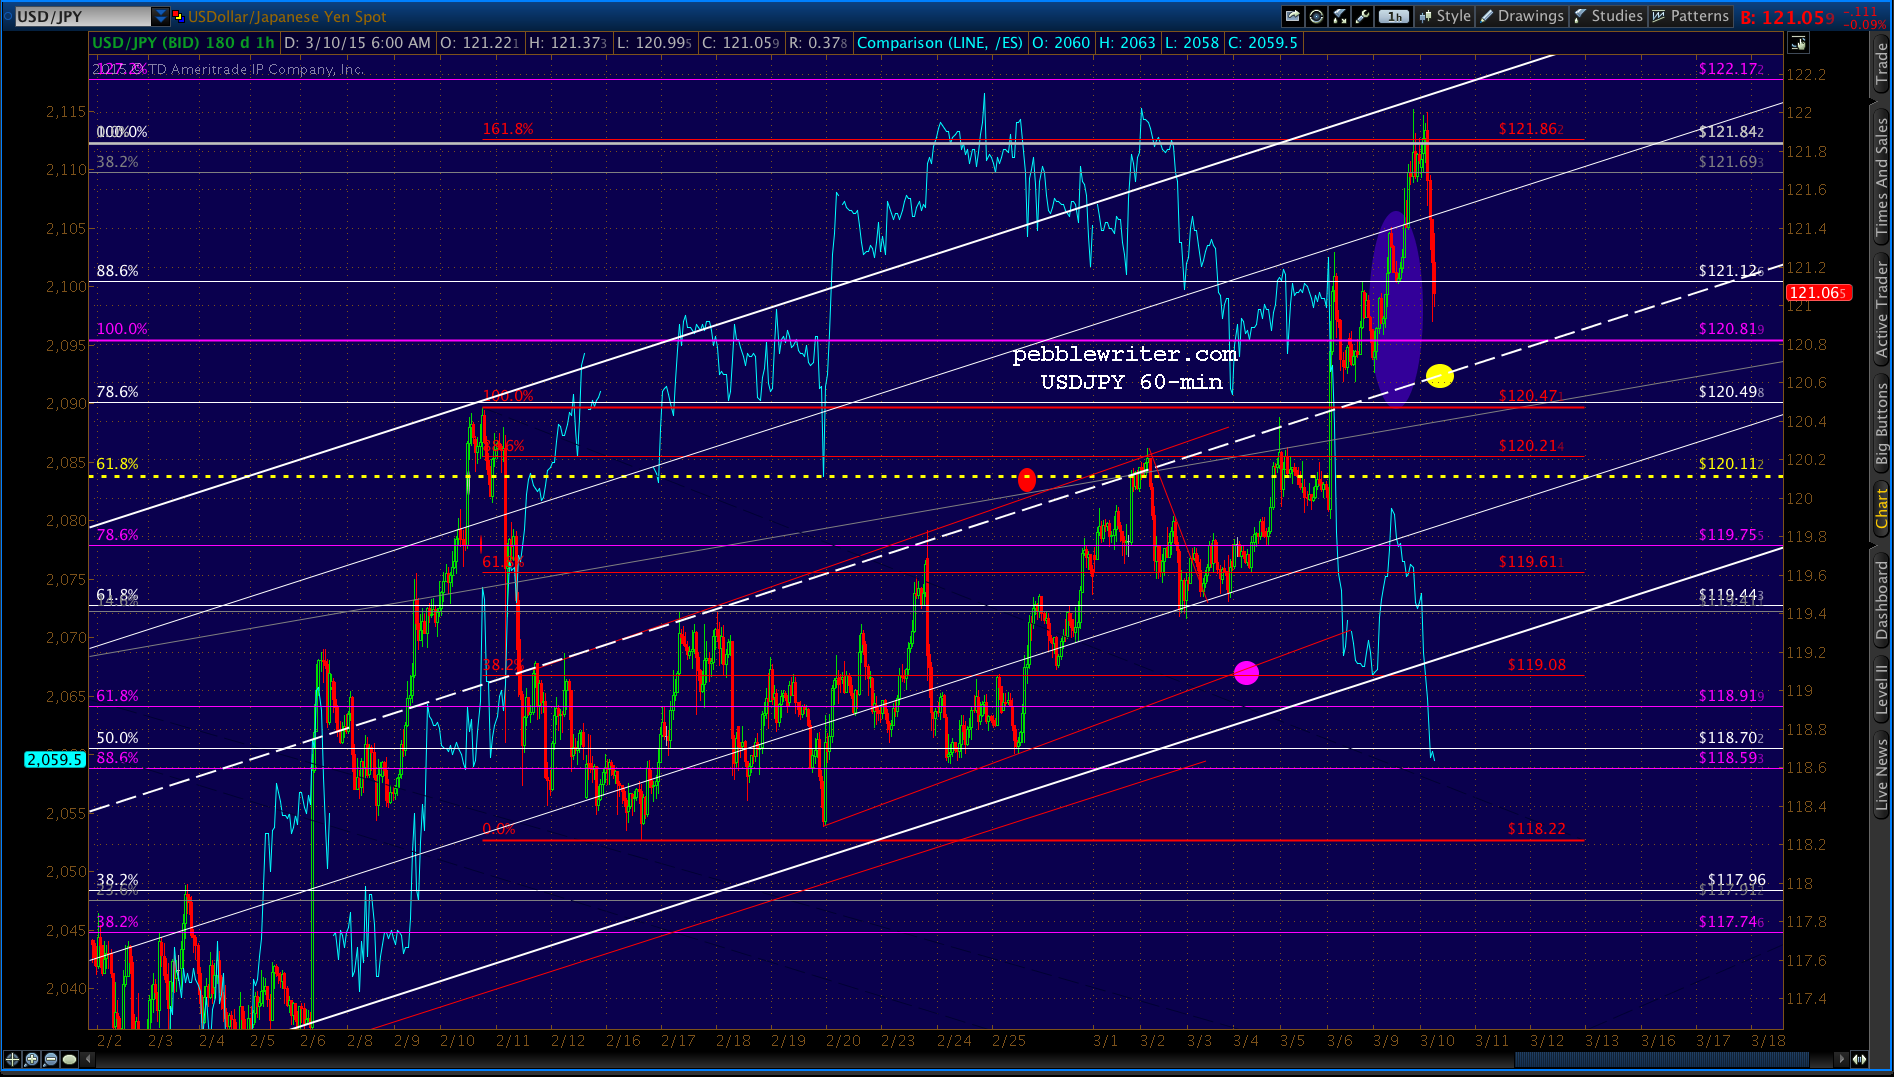
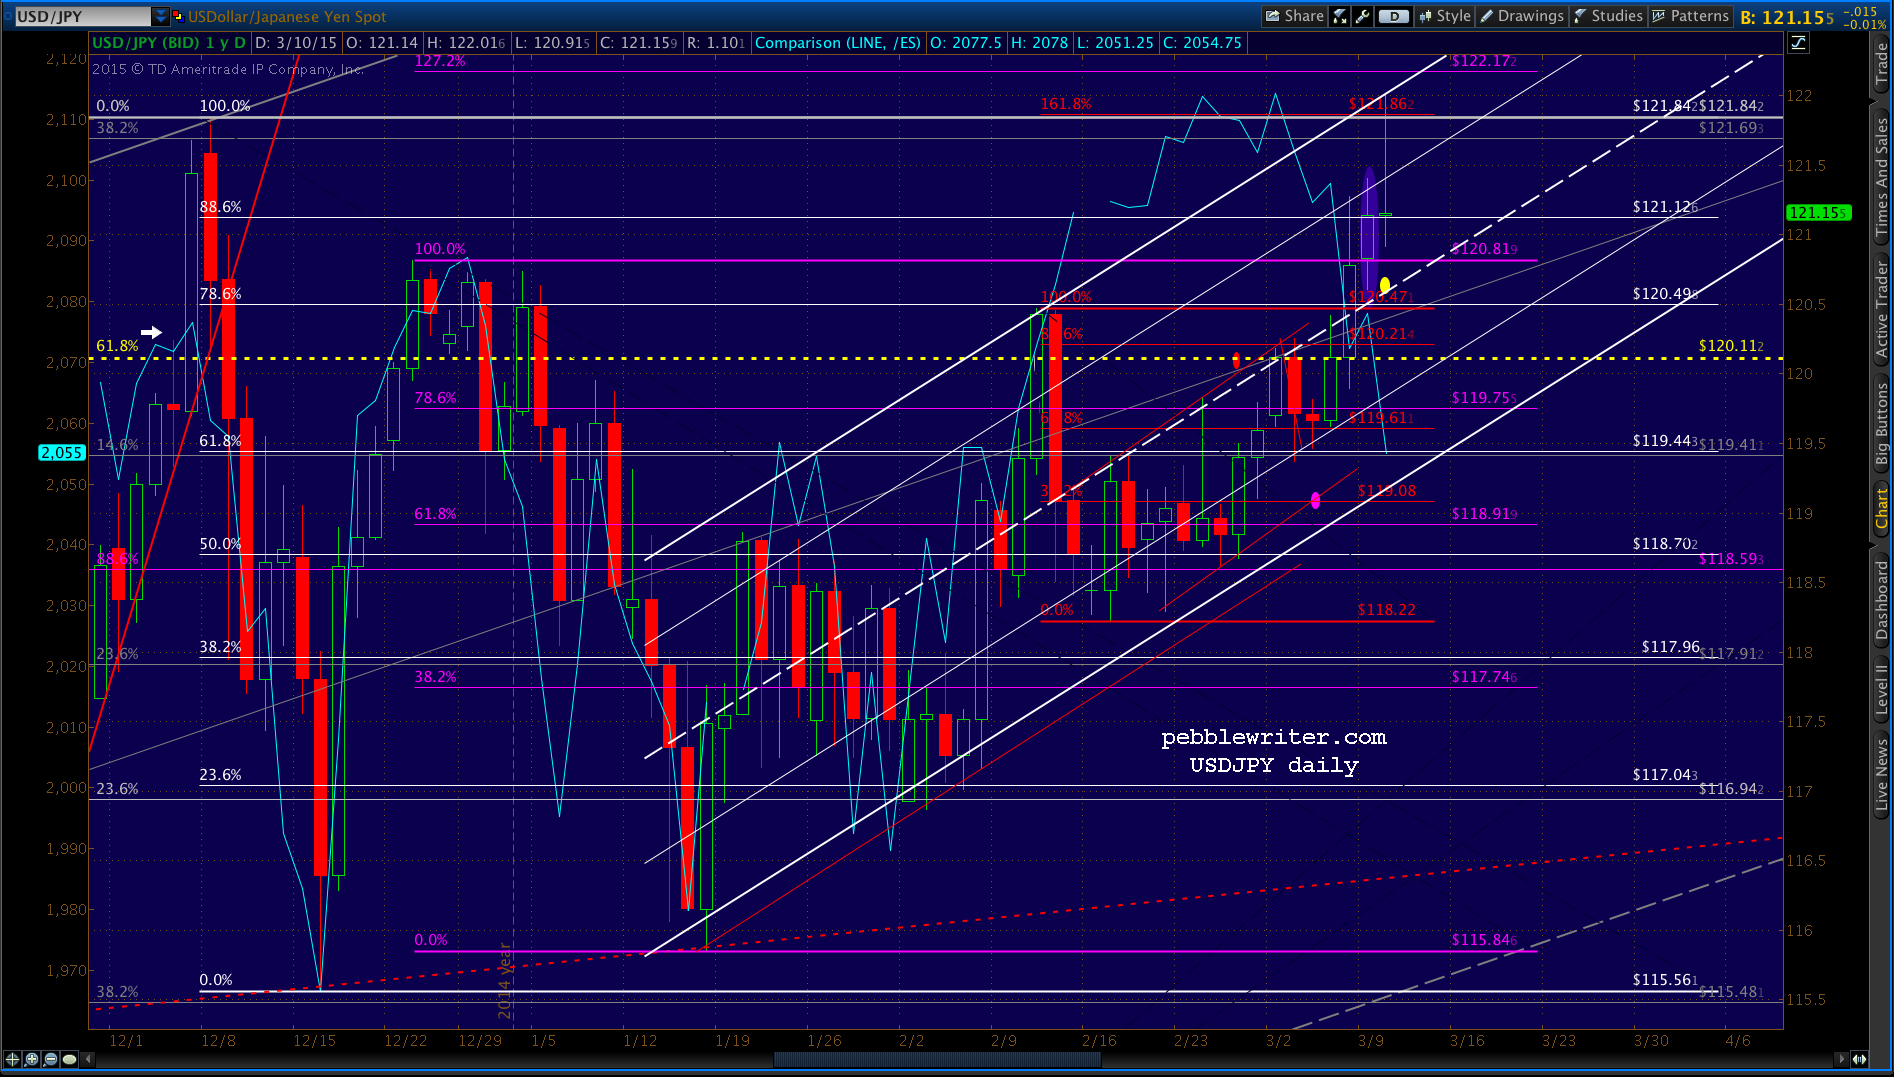
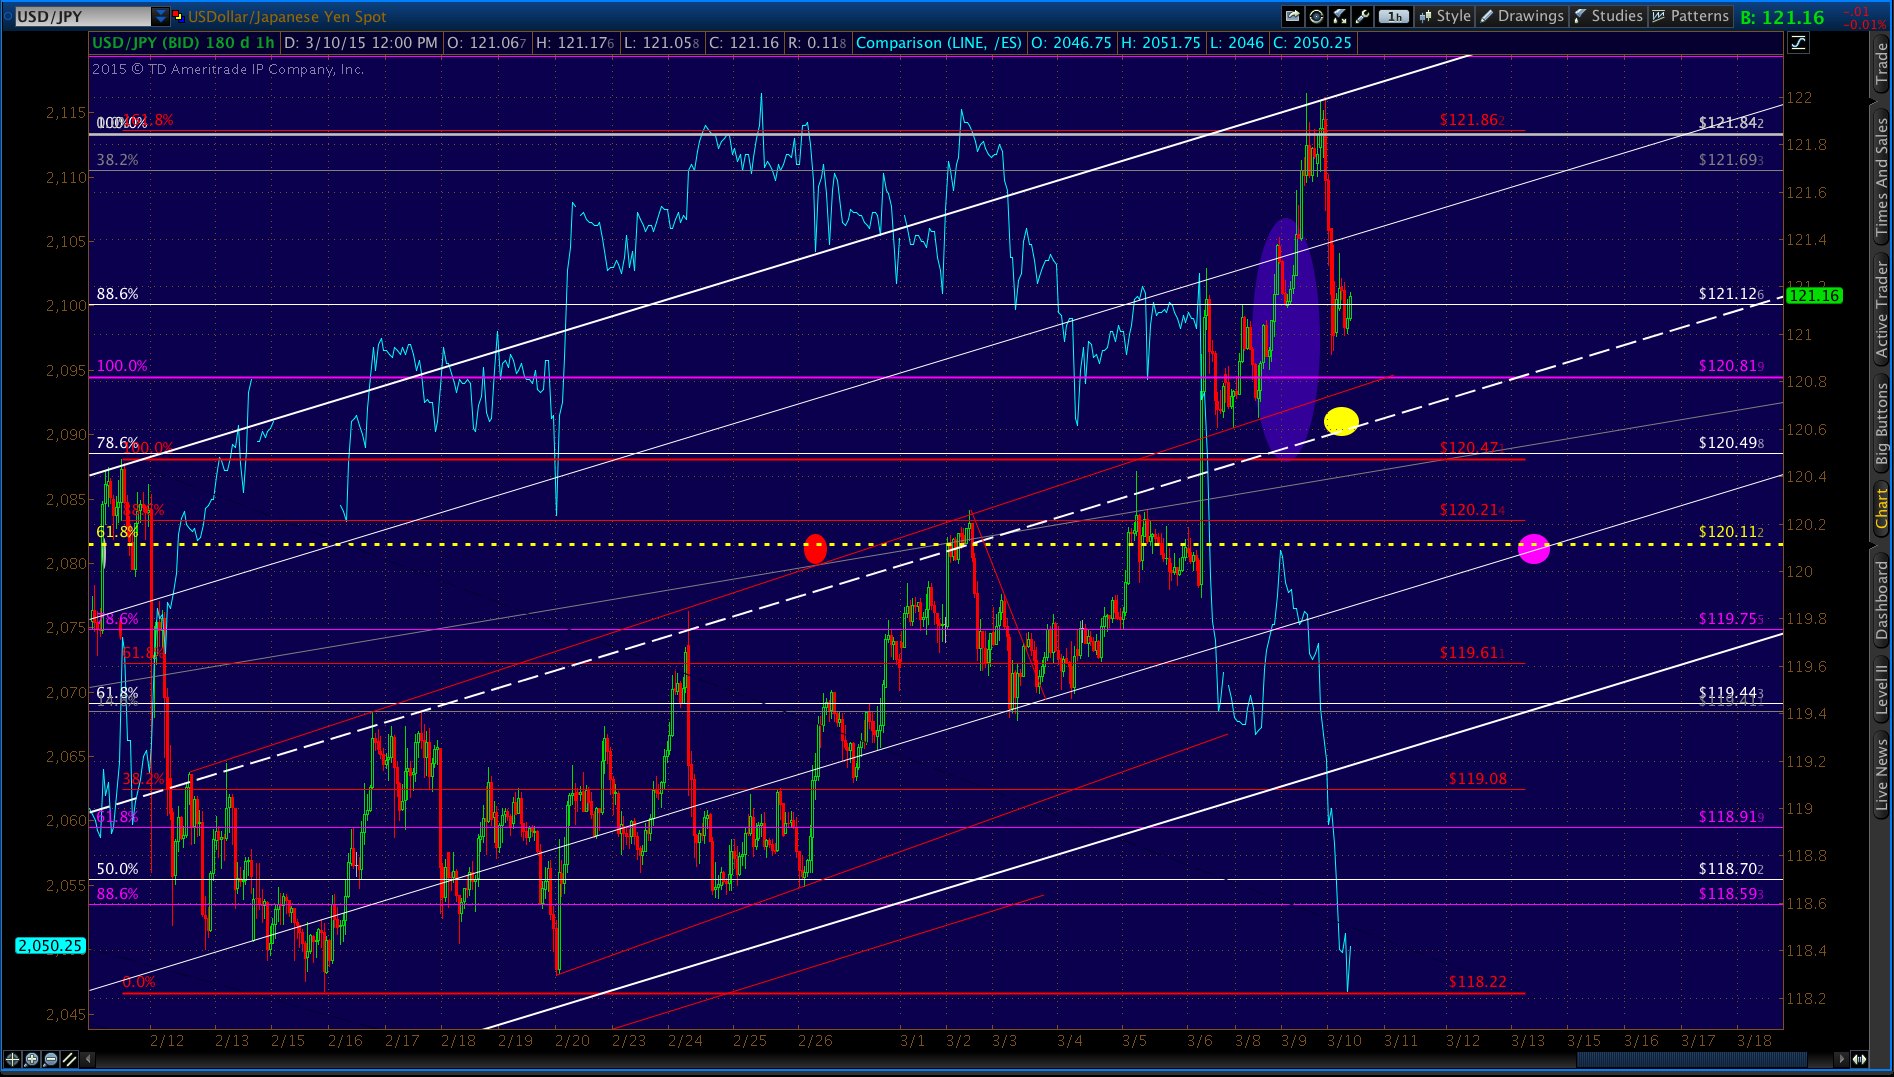
 USDJPY shot through the previous high, but traders and algos aren’t buying it — particularly after it led to a reversal on the white channel’s upper bound. Now that it’s on its way back down, the white midline will serve as initial support — with the yellow Fib at 120.11 as the ultimate target.
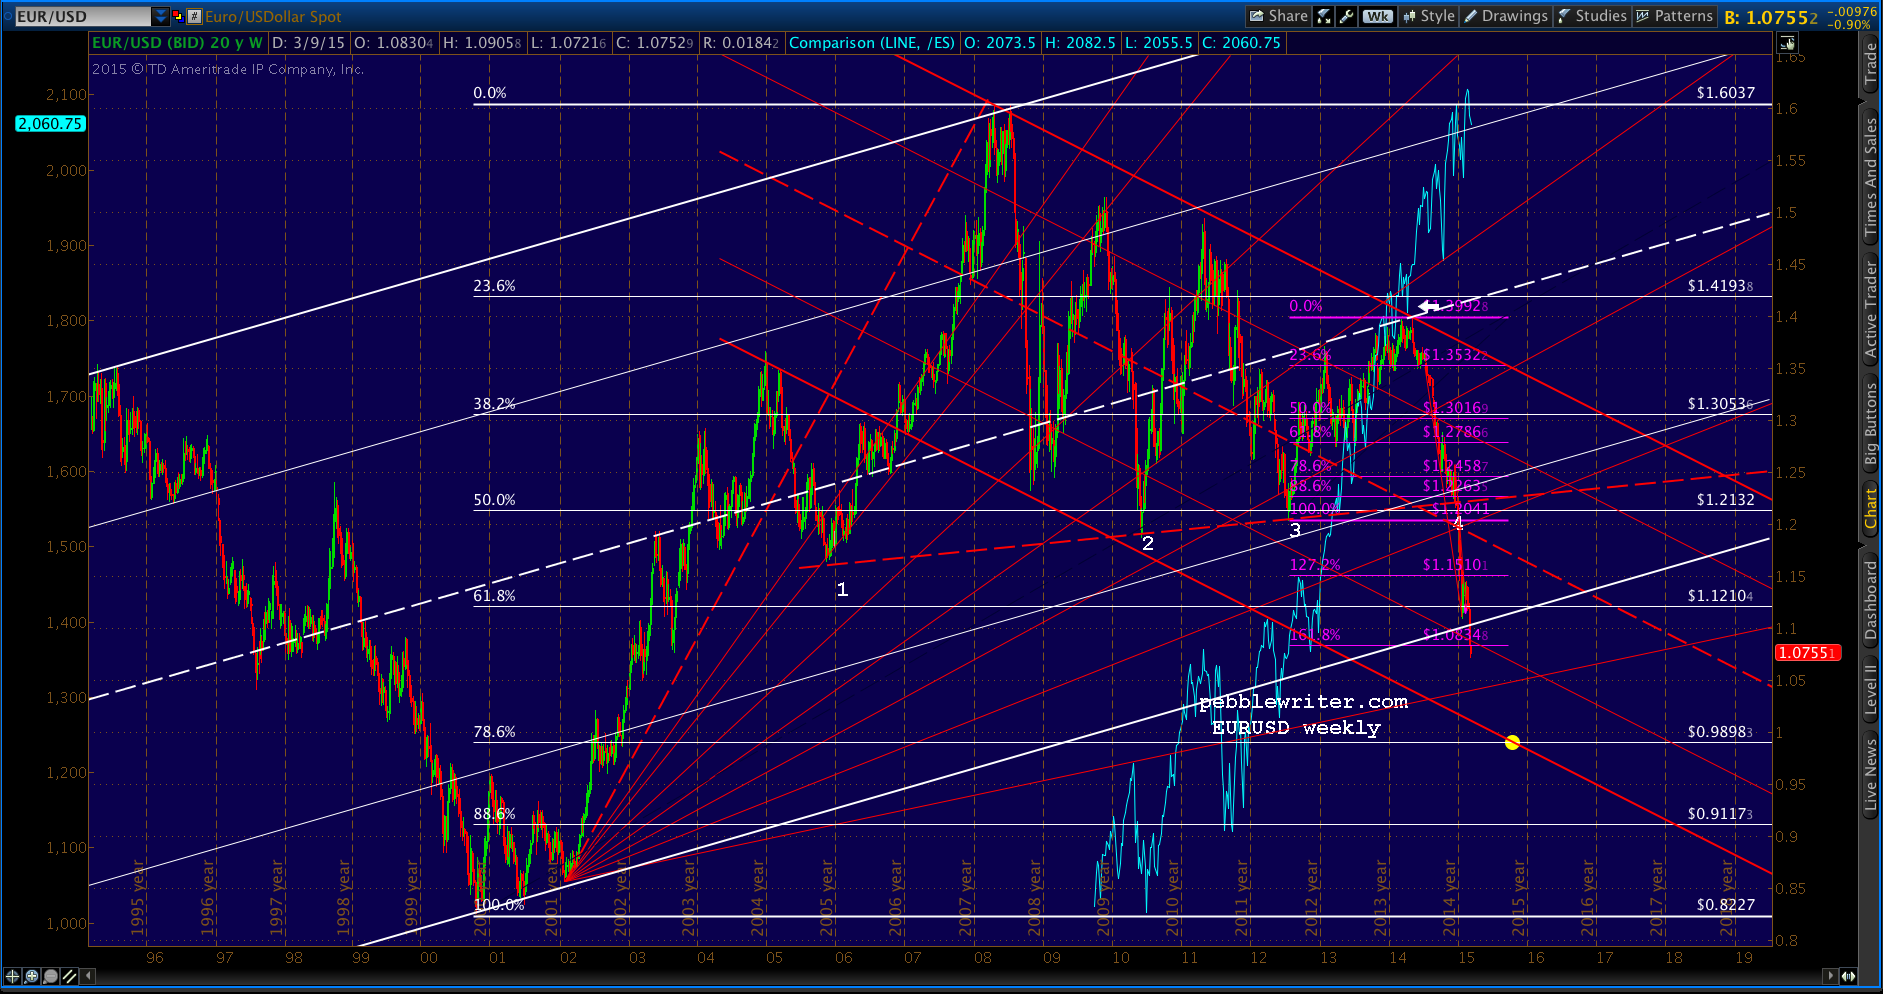
 As we’ve speculated for a while, the EUR/USD will likely need to take up the reins for the carry trade from the USD/JPY. The potential support we mentioned yesterday at 1.0834 has folded, and our .9898 target is clearly within reach.
While the top of the red channel is pretty well-defined, its ultimate bottom is anyone’s guess. I’m by no means married to the placement illustrated below — meaning the timing of a move to .9898 is entirely up in the air.
UPDATE: 9:47 AM
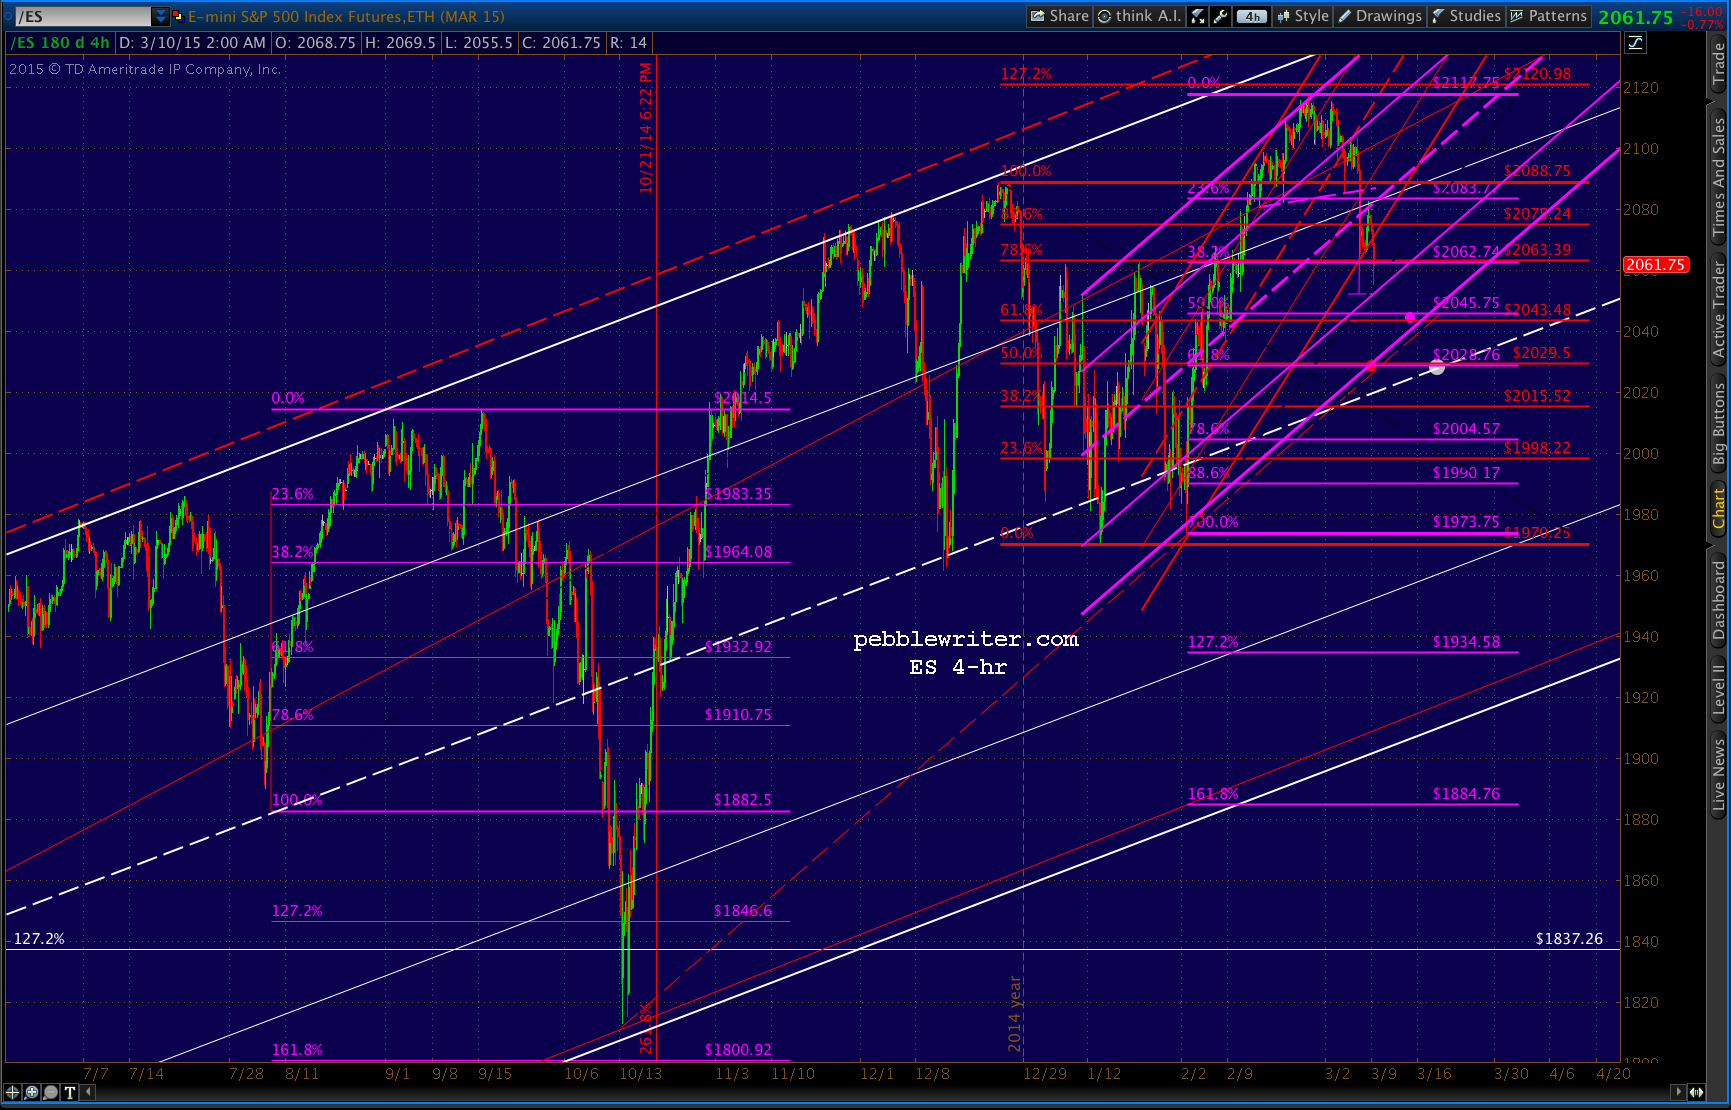
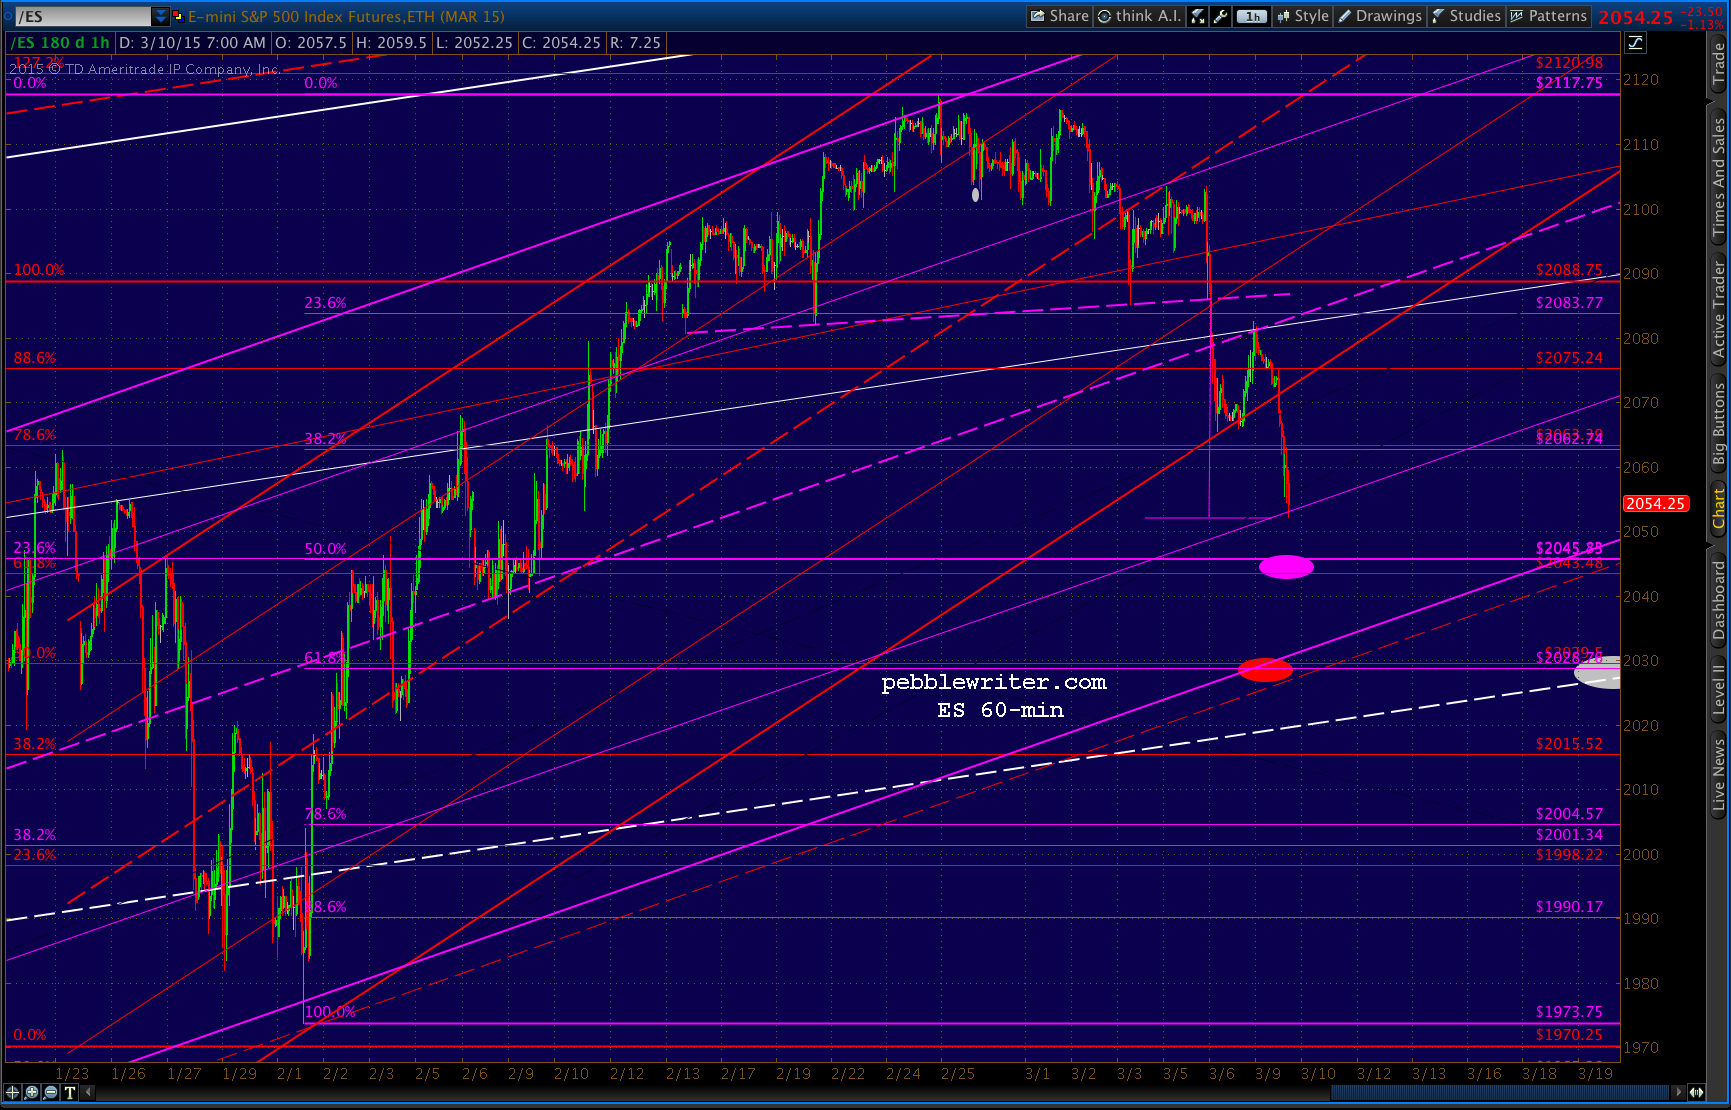
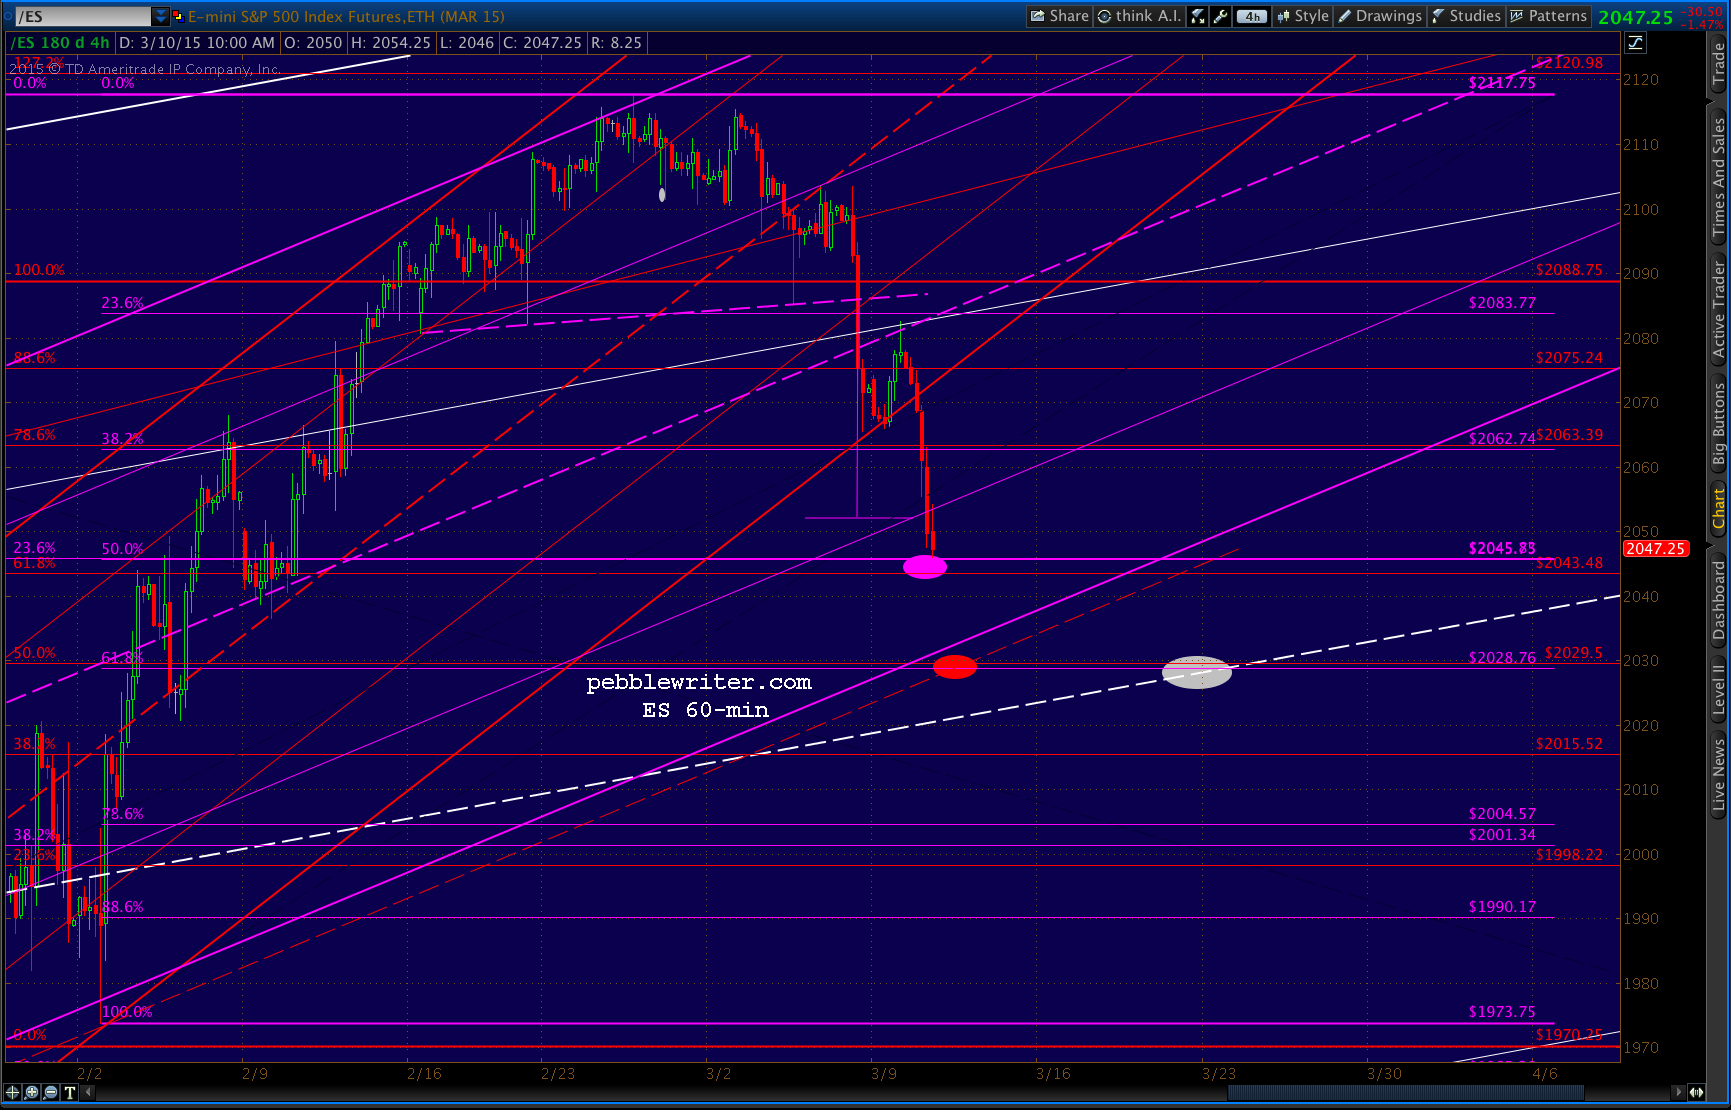
SPX just tagged our next target — the purple dot — for a nice backtest of the gray channel. We should get a nice bounce here at 2056, with initial resistance at the SMA50 (2062.) I’ve temporarily removed the purple dot so the precision of the tag can better be seen.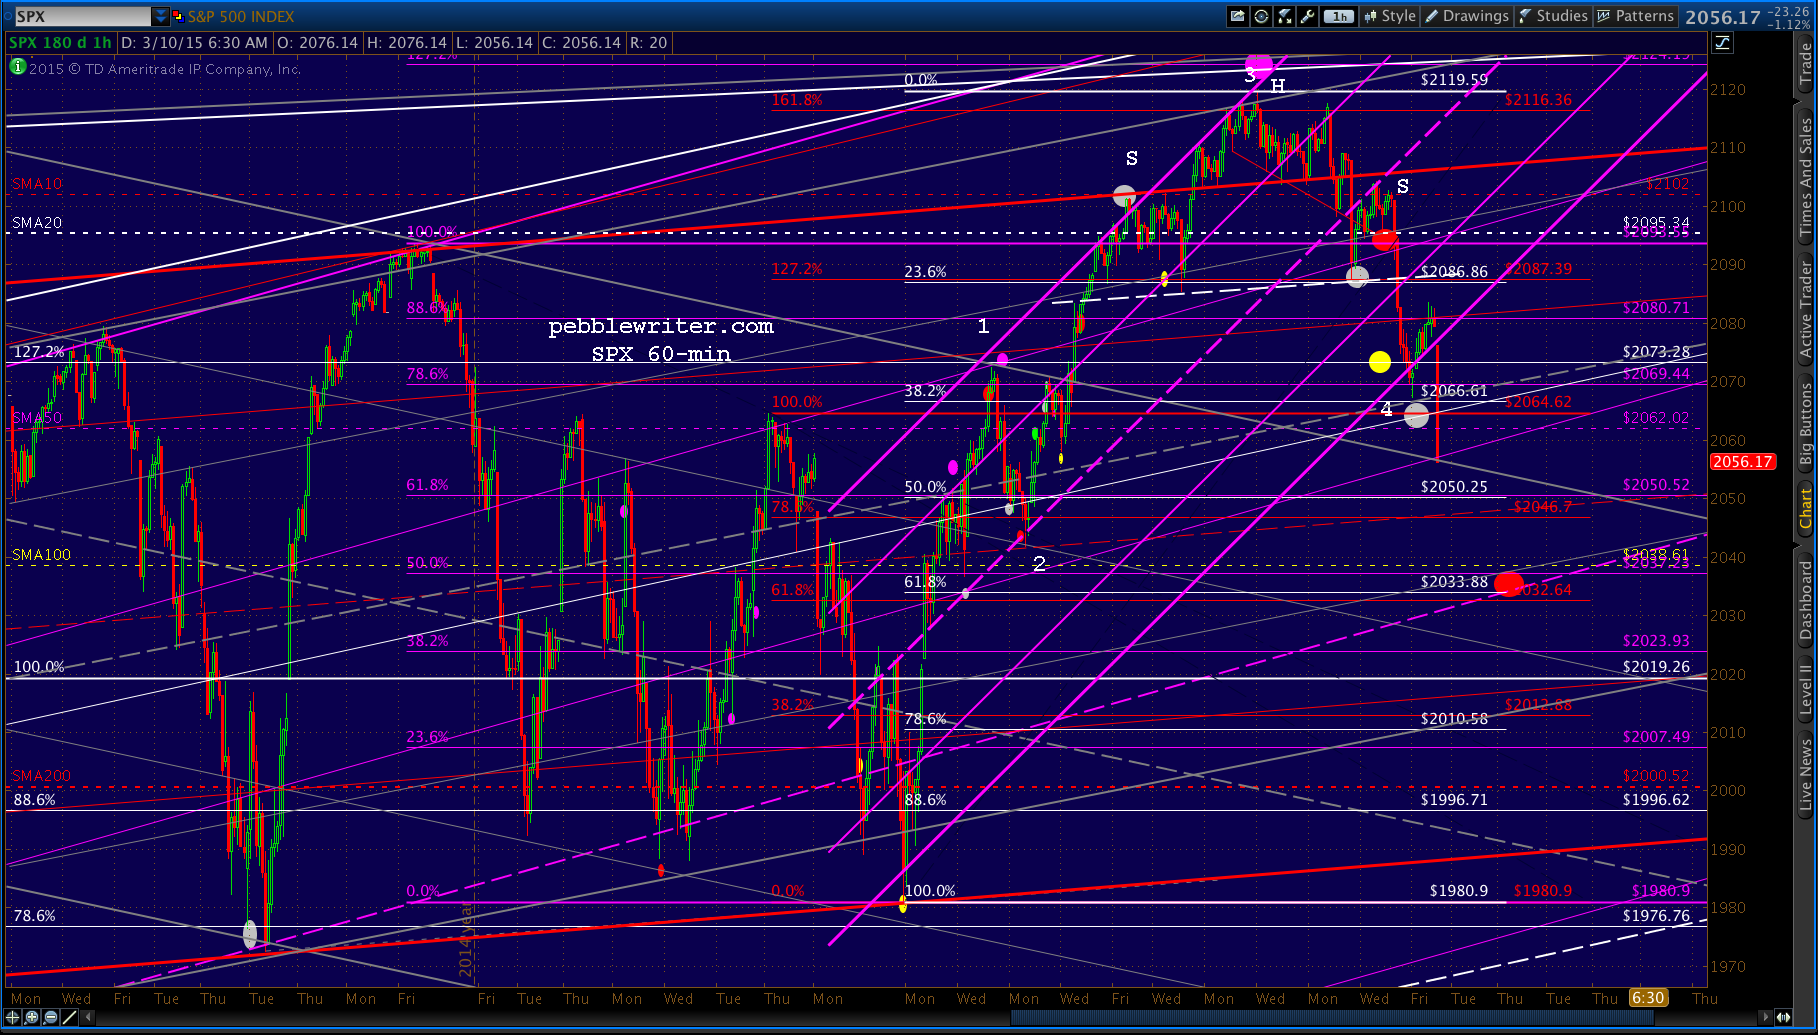 I’m about 60:40 on whether this is the end of the decline or not. The e-mini chart, in particular, suggests another wave down in the coming week to tag the white channel midline (that has been so strong in the past) at the purple .618 (2028.76.)
Marked with a white dot on the 4-hr chart below, this target works on many levels. The timing would work nicely tomorrow, when the red TL from October crosses the .618, or around the 23rd, when the white channel midline does.
 Depending on how and when it is achieved, that 30-pt drop could easily be paired with a test of SPX’s SMA100. Currently at 2038.61, this would represent a 20-pt drop for SPX — which is awful darned close to the white .618 at 2033.88 — a target I find very appealing.
It could happen after violating the gray channel top as early as today or tomorrow, or after a nice bounce that preserves the gray channel top and reinforces the purple channel midline. Too early to say. Again, keep an eye on CL and USDJPY in particular. They appear to have further to go.
UPDATE: 10:30 AM
ES just reached its H&S target and might be firming. USDJPY is back to the .886 at 121.12 and EURUSD (for now, positively correlated again) appears to be backtesting the broken 1.618.
 SPX has reached as low as 2054.15, but will no doubt follow the others’ lead. As the most easily manipulated component in the equation, I’d keep an eye on USDJPY and which side of 121.12 it moves to.
By (briefly) topping 121.84, it provided cover for oil’s weakness. But, by tagging the top of a well-defined channel and completing the smaller red Crab Pattern, it didn’t sucker many folks into believing it was heading to the moon. In fact, the last time it hit 121.84 (Dec 8), it precipitated a 110-pt drop in SPX.
 SPX’s first hurdle, of course, will be the SMA50 it broke earlier.
UPDATE: 3:30 PM
SPX ran up to the SMA50, reaching 2061.87 before sliding back below the gray channel top.
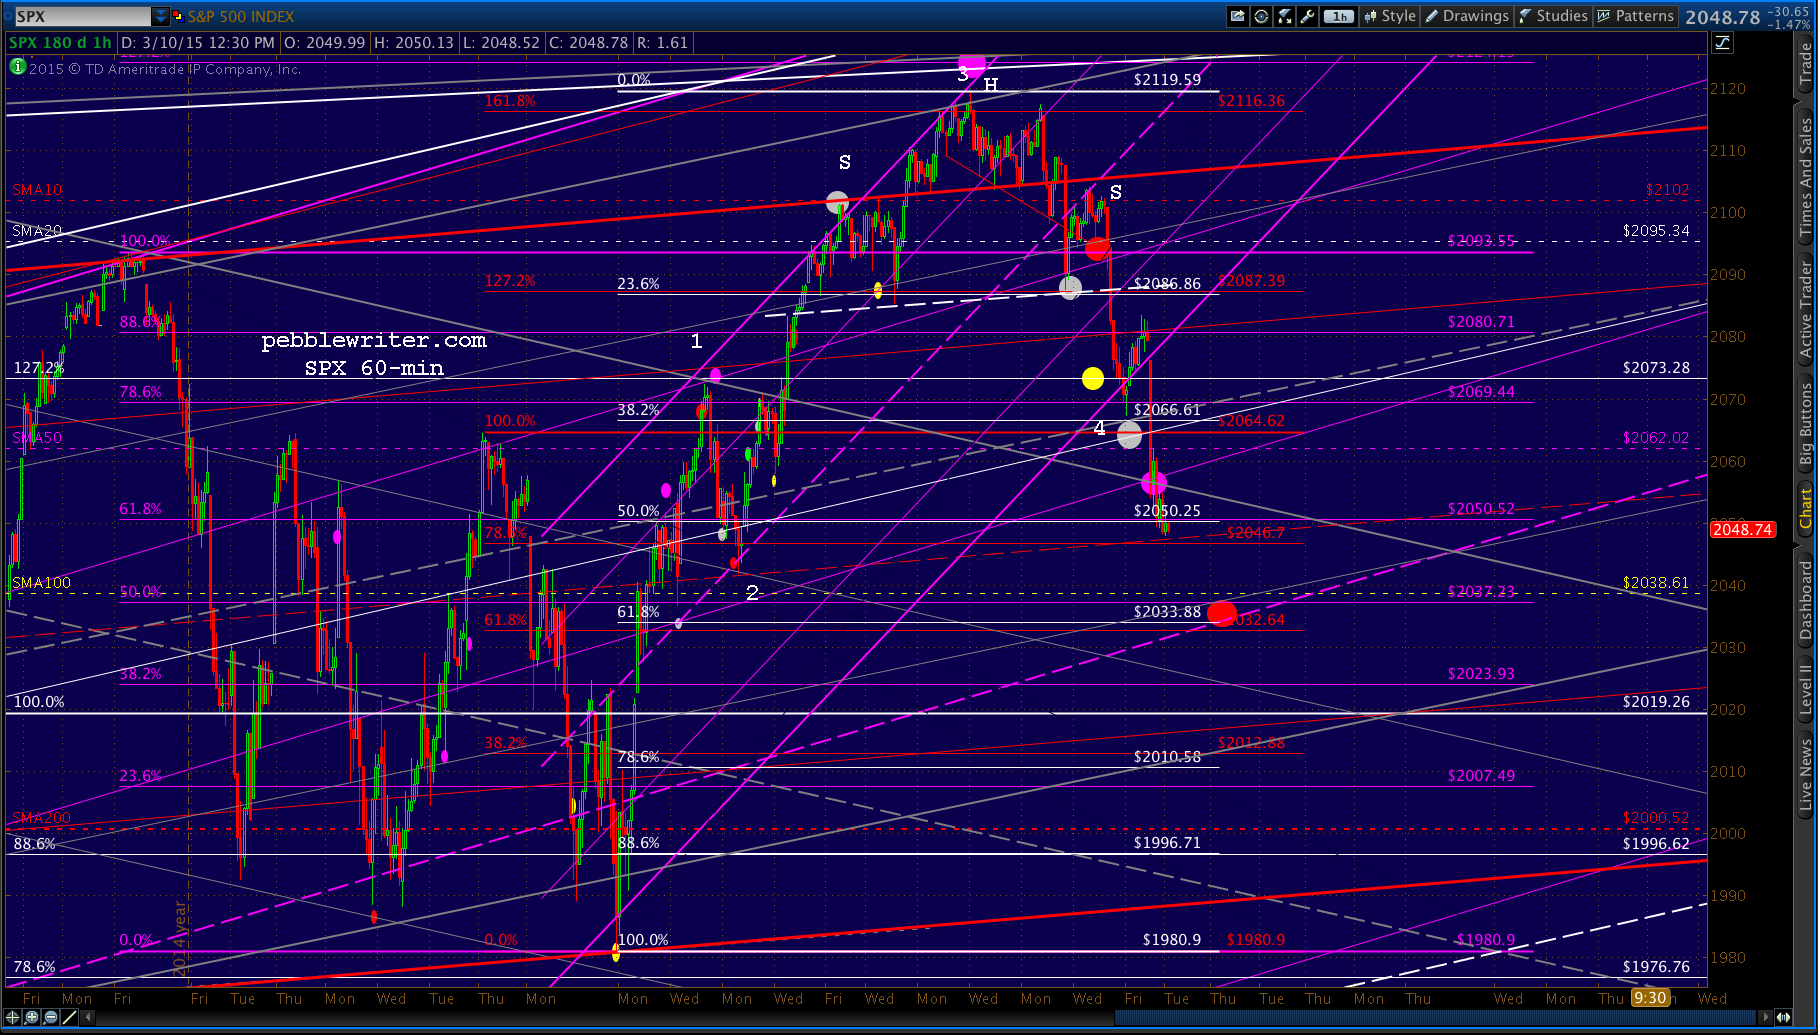 My gut tells me the only thing keeping it from slipping further and tagging 2033 is the shock that would be expressed at headlines of a 2% slide.
It’s currently resting on the midline of the rising red channel that originally guided SPX from 1971 to 2093 back in December — and, every bounce since then. The only problem with this channel is that it was already broken (Feb 20-Mar 3.) So, its midline shouldn’t technically still matter.
This, combined with the price action of CL, USDJPY and EURUSD, leads me to believe we’ll see more follow-through on today’s downside.
Having said that, though, the red midline would make a nifty neckline for a H&S Pattern that targets 1972ish (the Dec 16 low.) We’ll keep that alternative in mind as we go forward. If nothing else, the presence of a such a sizable potential H&S injects a good dose of uncertainty, making it tough to know what to do overnight should SPX close here.
CL could be done. It keeps creeping lower a little at a time, but hasn’t quite reached the optimal low of 47.65 or the next at 45.86.
 USDJPY continues to hover near that .886 — slipping higher every time SPX tries to settle lower. My best guess is still that it drops to the white midline at 120.60ish or, better yet, a backtest of the yellow .618 at 120.11.
 ES has tagged and bounced off the purple .500 Fib, but is probably headed to the .618 at 2028.
 To summarize, the odds are that we see some follow-through tomorrow. But, it’s nearly as likely that, when the market closes near its low for the day, they’ll ramp it up overnight just to teach a lesson to the fools who were bearish the day before.
So, I’ll throw out the usual caveats. Staying short makes sense for those who can hedge or manage their position overnight. Otherwise, take those juicy gains at the close and wait and see what happens.
There are about 10 minutes left in the session, so we’ll wait and see along with everyone else. Wouldn’t it be cool if it’d just run down and tag 2033 already?
GLTA.