

The bounce off the Feb 11 lows has puzzled many investors. But, it’s not all that complicated.
As more and more traditional investors and traders abandon investing, markets are increasingly driven by complex algorithms. The most powerful is the yen carry trade [what’s this?], as seen in moves by the USDJPY. The S&P 500 futures (ES) are shown for comparison purposes. A close second is an algorithm driven by oil prices — specifically CL futures. We’ve been following this for a long time — first noticing the effect in the Jan and Mar 2015 rallies and writing about it frequently, including this Oct 2015 post: What Really Drives Stock Prices?
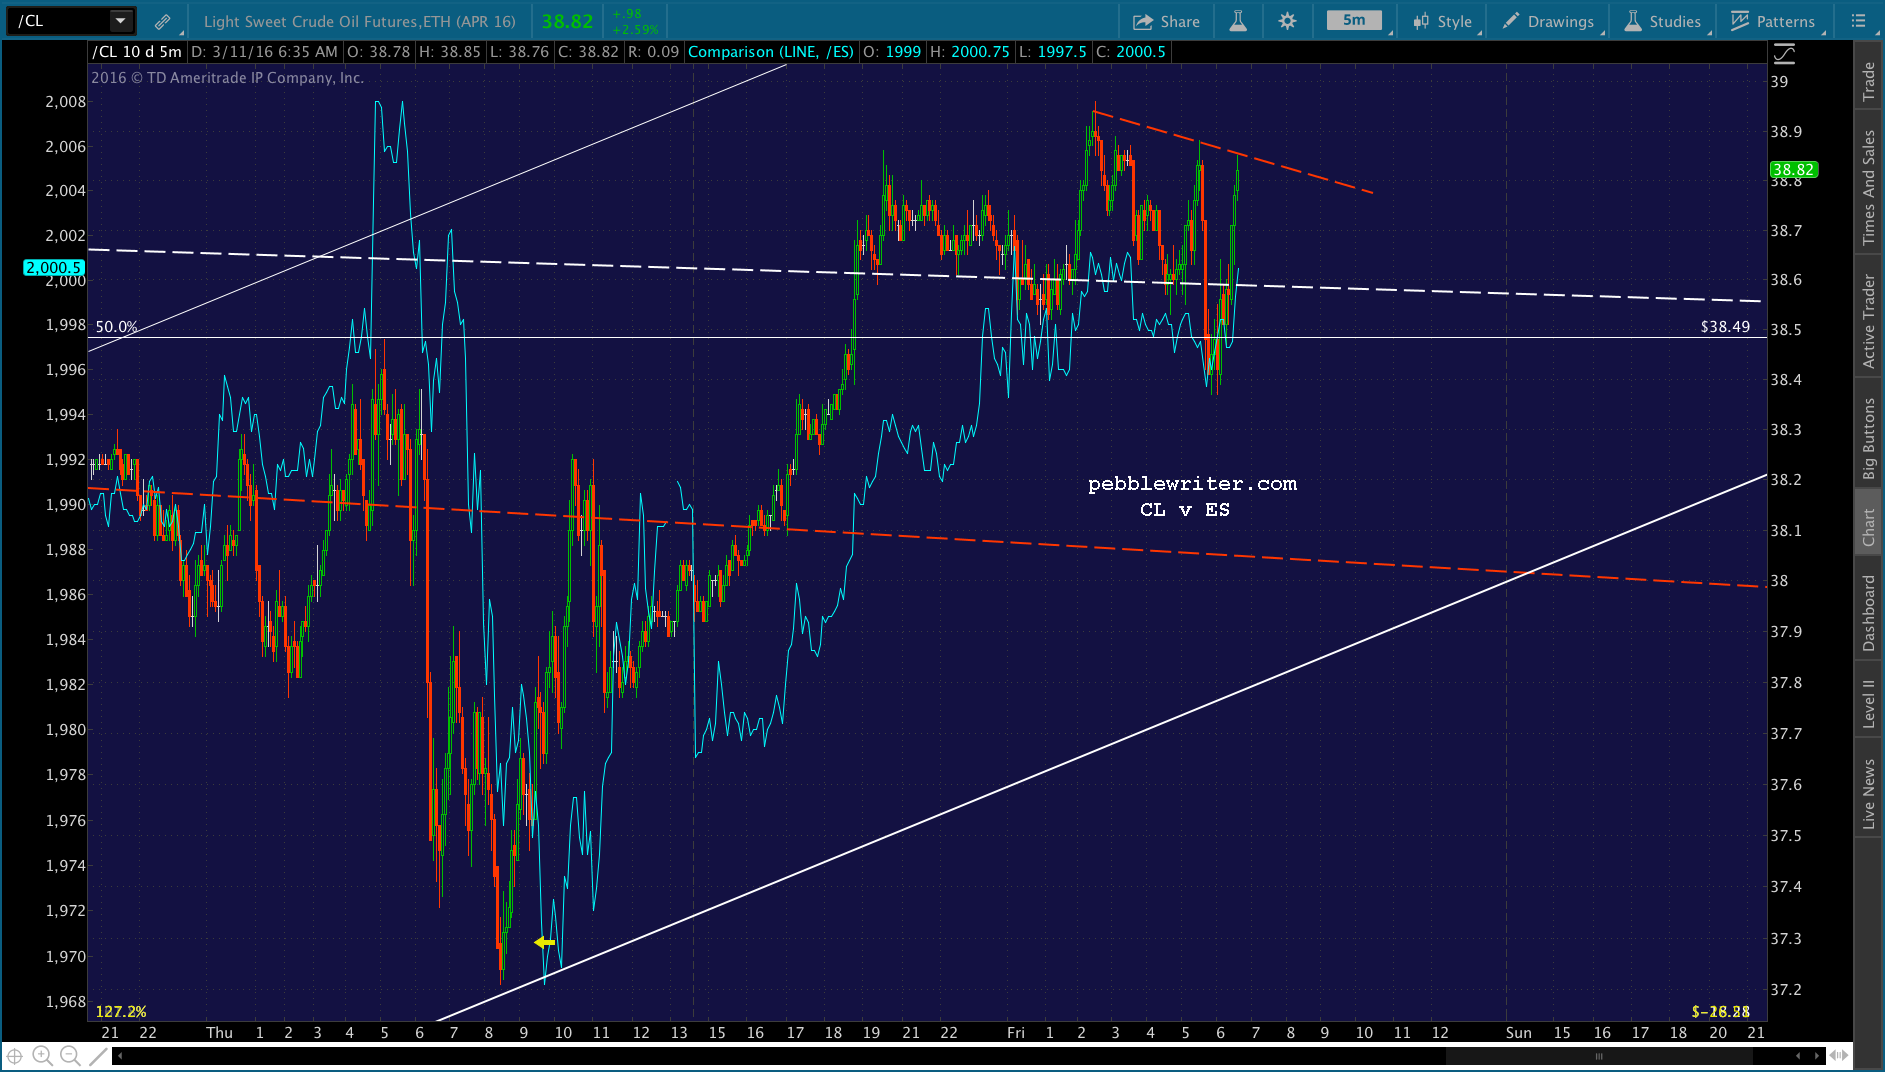
 If you want to know, for instance, why stocks suddenly reversed off their post-Draghi plunge, look no further than the short-term CL chart. With ES in the midst of a 40-pt swoon, CL suddenly reversed (the yellow arrow.) In rather short order (and, after USDJPY finally reversed) stocks got the message and rose along with them.
 Ditto for last night’s ramp job: all CL and USDJPY. It should be enough for SPX to top harmonic resistance at 2009.13 this morning. It will blow up a number of bearish patterns, enabling the rally to continue unmolested.
 Don’t take my word for it. Former Fed President Dick Fisher, in a candid interview on CNBC earlier this week, confirmed what many have been sensing for years:
“…we injected cocaine and heroin into the system, and now we’re maintaining it on Ritalin….This has been a hell of a rally.”
Today, the injections are taking the form of higher gas prices. On February 11, I filled up my wife’s car with regular grade unleaded at $1.94/gallon. Today, that same station is selling gas for $2.15/gallon.
That 11% increase pales in comparison to the 50% increase in CL over the same period. But, for anybody on a tight budget, it’s a bitter pill to swallow — particularly when they enjoy few of the benefits of the wealth effect Fisher and his cronies are now crowing about.
No doubt, the Have-Nots’ sacrifice (think of it as another gas tax) is much appreciated by those whose portfolios have increased in value since the Feb lows by — come on, you already know the answer! — exactly 11%.
continued for members…
So, new highs. Will there be setbacks? Sure. The Powers That Be have worked very diligently to install them here and there to give the appearance of a normal market — whatever that is, anymore.
It was like pulling teeth to get SPX to retrace all the way down (sarc) to the .500 Fib after reaching a key .618 the other day.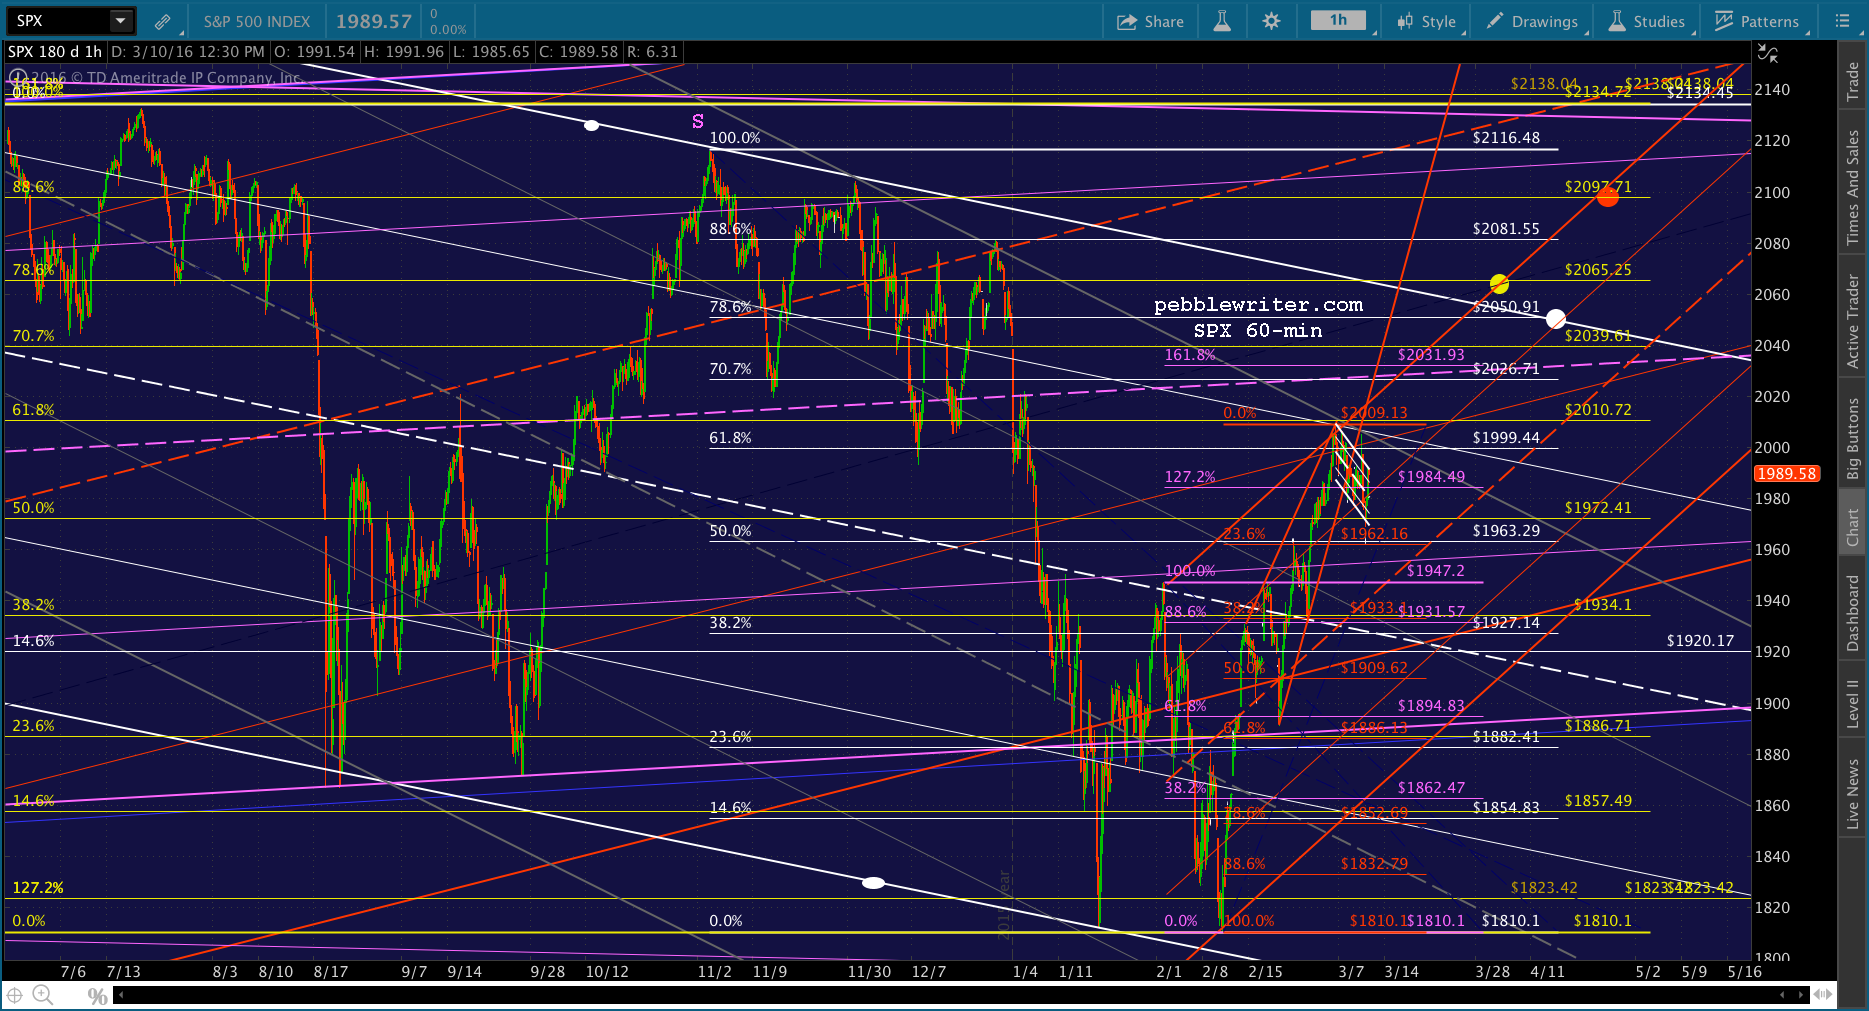 UPDATE: 9:40 AM
Just topped 2009.13, negating the bearish harmonic patterns. When they’re ready to leapfrog the yellow .618 at 2010.72, they’ll just need to poke CL up through the little TL connecting the overnight highs. I’d revert to cash here, as they can easily let it settle back now.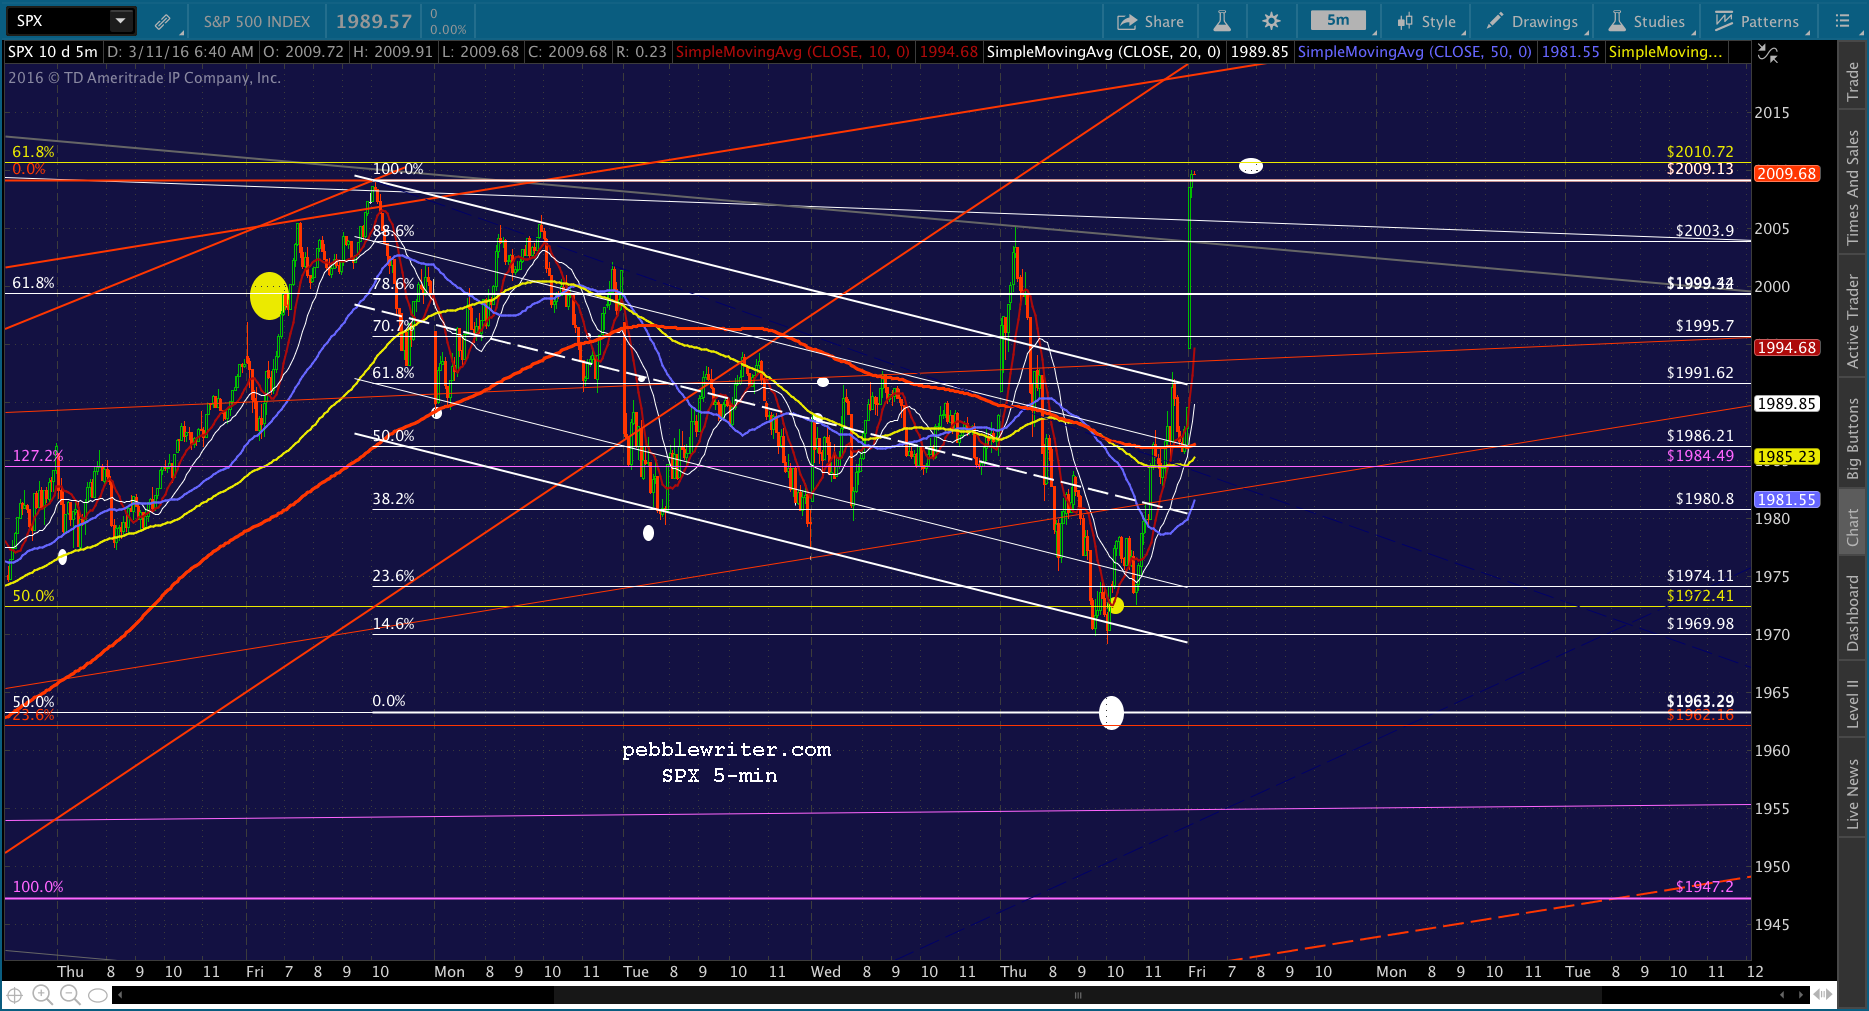
 The Mar 4 2009.13 high came up just shy of the .618 at 2010.72, meaning a “final” push up to 2010.72 was justifiable. With the bearish harmonic patterns blown up, they could let it settle back to a meaningful channel line and not suffer any real setbacks.
Of course, they could go ahead and push it on through 2010 and get it over with — avoiding any unpleasantness that might develop in the world over the weekend. USDJPY is positioned for either eventuality. 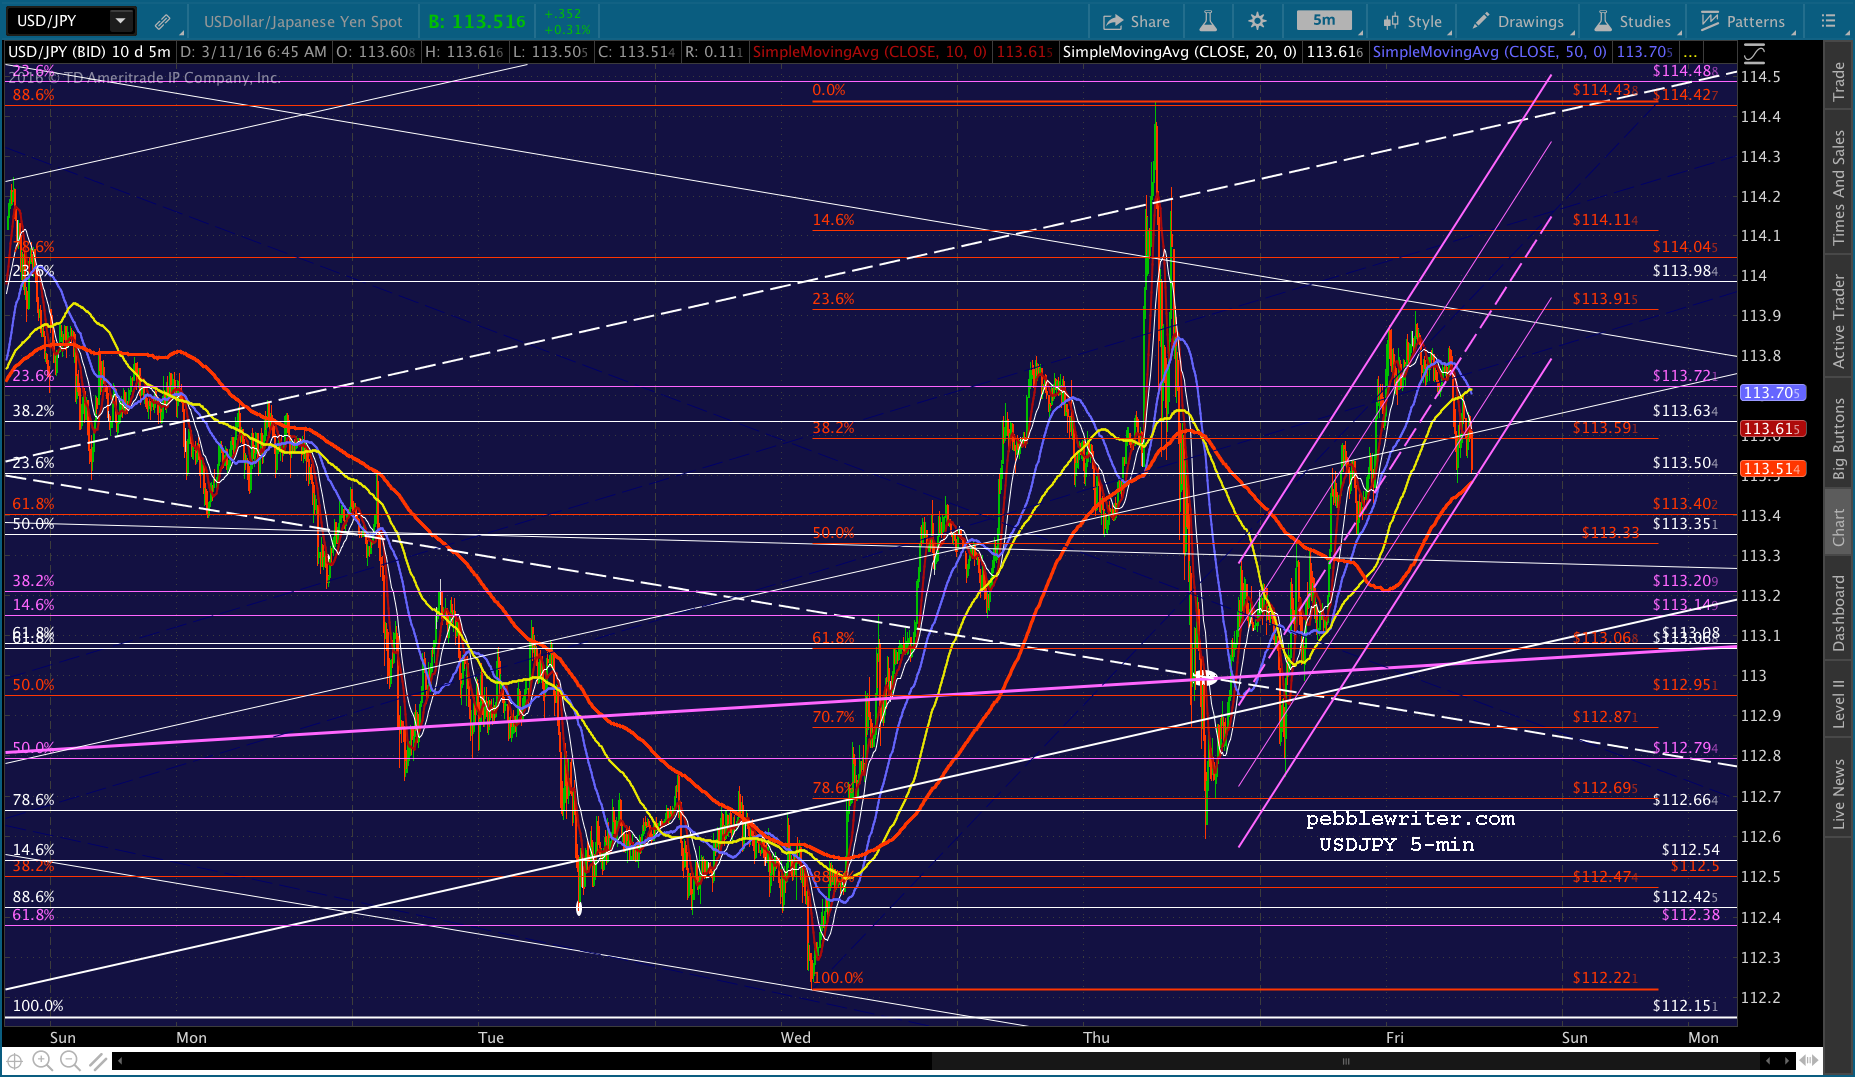 I’m going to take the rest of the day off and tend to a nasty headache that’s been building all week. I plan to get a few more indices and commodities updated. Notably, GC reached our 1286.30 target last night — for all of one minute, at 8:17 PM.
For those of you who haven’t already, it’s not a bad time to short it — at least as a short-term trade.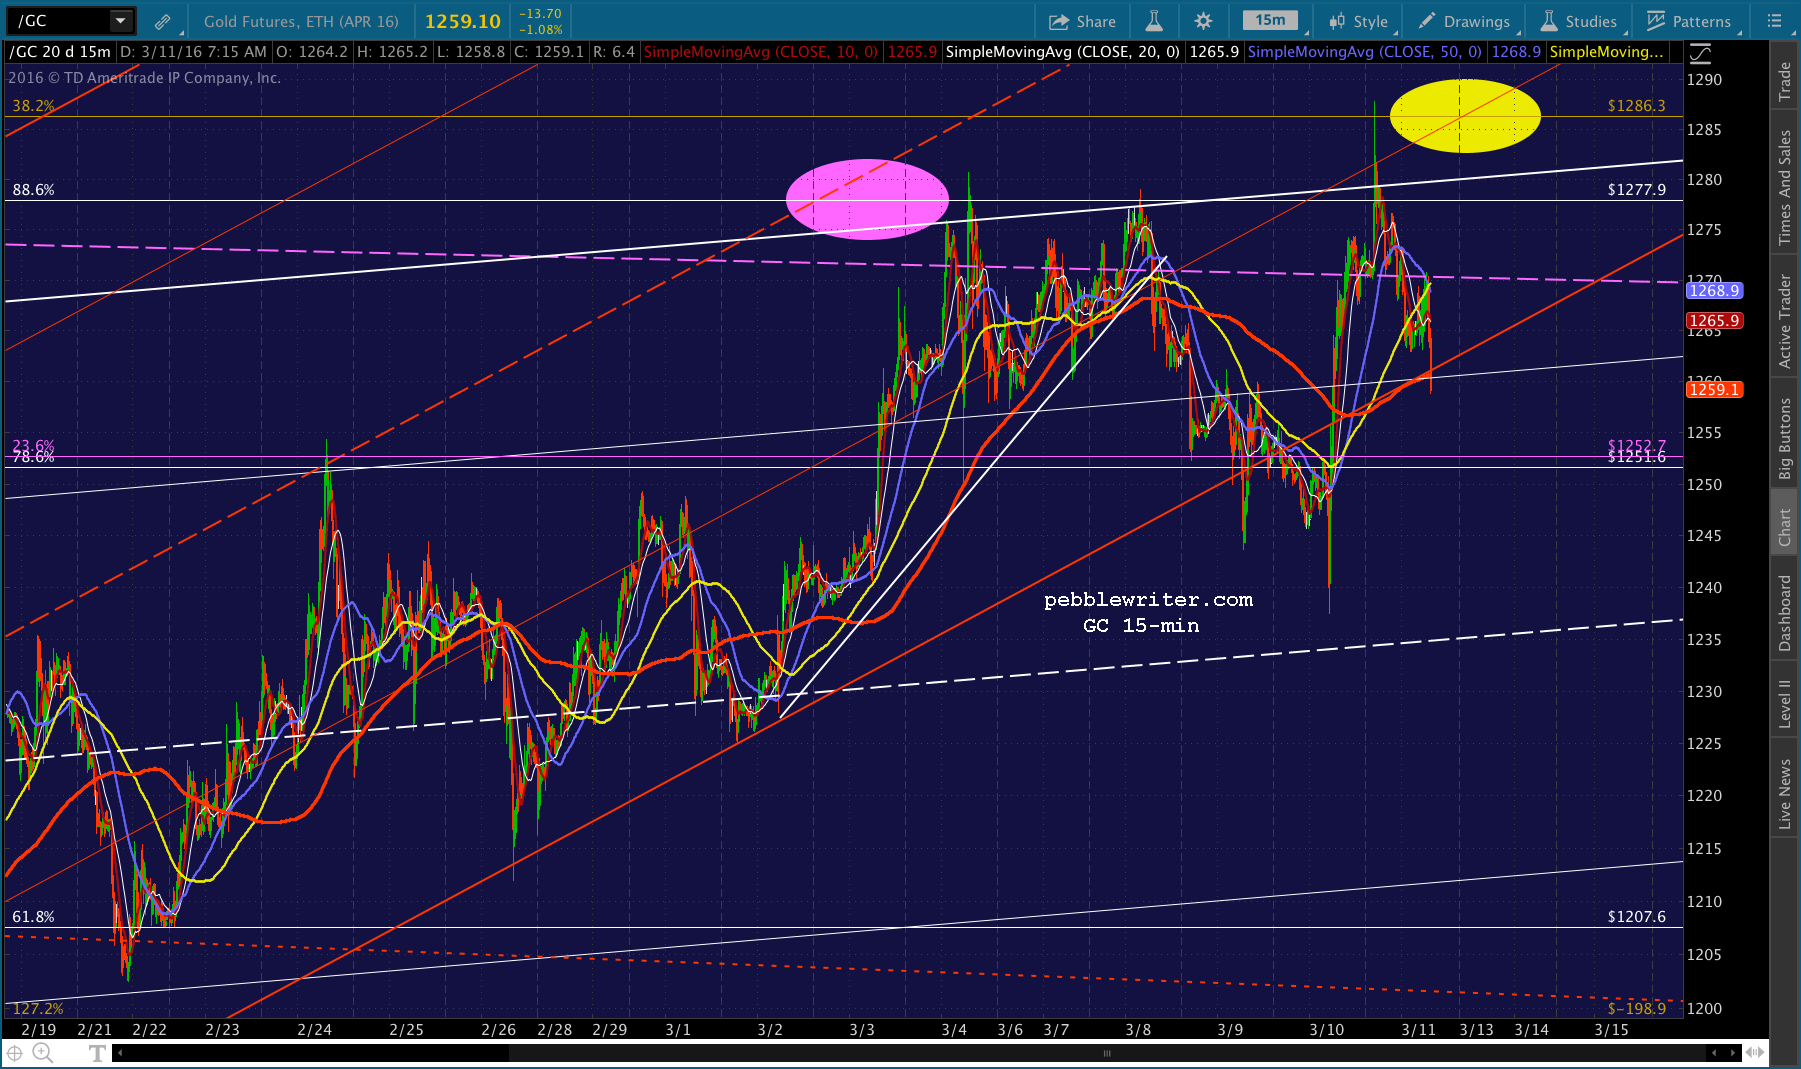
Comments
6 responses to “Why are Stocks Rallying?”
PebbleWriter,
Are you sure you don’t have a time machine to travel to the future?
You wrote this on Feb 10 about XLF.
https://pebblewriter.com/update-on-xlf-feb-10-2016/
I paid attention to financial stocks since then. On Feb 10, you had a upper target of XLF at 22.51. (Actual close today is 22.49)
What is next for XLF?
Tommy
Yes, my secret is out. Time machines come in handy when forecasting ;-> I should be able to update XLF this weekend.
Can you give an update to your Feb 23 forecast? I guess the best case scenario is playing out, as SPX exceeds 2022 (You provided the best case and the worst case in that forecast)
Meanwhile, referring to your 1st chart in this post, SPX closed at 2022 is the sitting a the upper edge in your red channel and also the tip of the triangle. Interesting at the location.
Thanks!
I intend to update it this weekend. Stay tuned.
I think the market is going to continue rising despite the technicals. We’ve gone past logic at this point. People shorting are going to get burned.
No question, logic has left the building. But, please don’t diss the technicals! Remember, they can be used to determine movement in either direction.