

Once in a while a forecast comes together so nicely that people accuse you of having an unfair advantage. From one of our members on Friday:
Are you sure you don’t have a time machine to travel to the future? On Feb 10, you had a upper target of XLF at 22.51. The actual close today is 22.49.
In all the excitement over the broader market, I haven’t paid much attention to XLF since Feb 10, when it closed at 20.28. From that update:
Looking ahead, I’ve identified a few potential targets. It think the next downside target has to be the purple .886 at 19.26 where it intersects with an expanded falling red channel midline in the next couple of days.
If it fails, the white .382 and that midline intersect in mid-April. This would also complete a pretty clear C=A corrective wave.
If it holds, the immediate upside case is pretty much limited to a backtest of the broken yellow TL and white channel bottom at 22.51 in mid-March.

XLF bottomed out the next day at 19.53, 0.27 from our downside target. It then rallied rallied over the next month, reaching 22.52 on Friday, just .01 from our upside target. It’s a nifty 15.3% return based solely on chart patterns, harmonics and technical analysis — and, a sharp poke in the eye for those who insist technical analysis doesn’t work.
Of course, nailing a target is a double-edged sword. There’s the joy of a job well done, but the fear of badly botching the next forecast. With that said, we’ll take a look at what to expect.
continued for members...
The conflict between equally compelling upside and downside cases is rarely as apparent as it is in XLF. 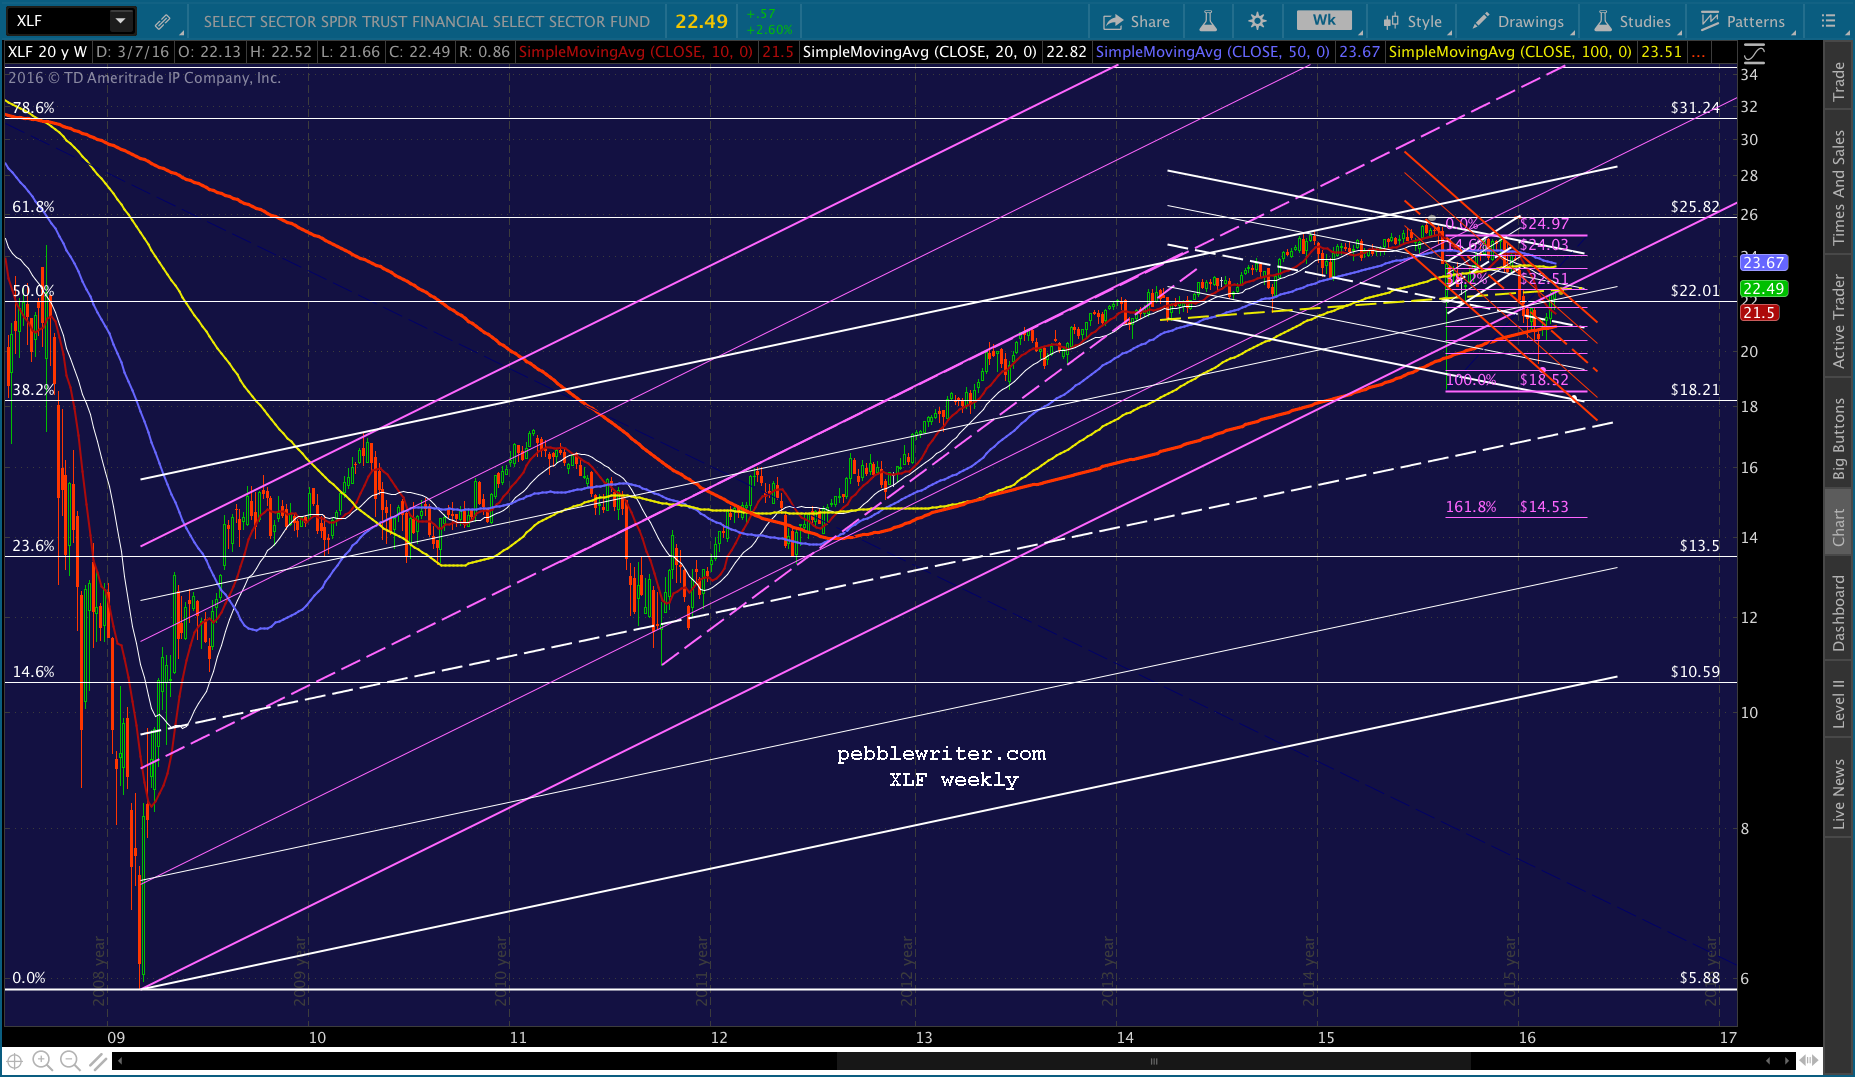 The Bearish Case:
The purple channel has worked very well since 2009. Its bottom was dramatically tested on Aug 24, and busted on Jan 15. The rally over the past month has completed a solid backtest which would normally signal a strong decline.
If the rally does indeed fail here, then it strongly suggests the white channel has taken over. It’s actually a slightly better fit, as it marked the 2011 bottom pretty well well. The white channel also suggests a strong decline, as the recent rally backtested its .236 line and suggests a drop to the midline (currently below 18) is next.
There are several other features that also indicate a drop: the yellow neckline, the falling red channel top, and the purple .382 Fib line at 22.51.
The Bullish Case:
The first argument is the rising white channel’s .236 line. Friday’s 3.97% spike off Thursday’s lows skipped right over this channel line — a classic move by often used by TPTB to negate resistance. Most of stocks’ rise off the Feb 11 lows came in the after hours, when prices are easily manipulated. XLF’s move smacks of the same kind of heavy manipulation.
The second bullish pattern is the falling white channel. By bouncing off its .236 line (the yellow arrow below) and rebounding past the well-established midline, it suggests the trip to the channel bottom might be avoided all together.
The last is the white .Fib levels themselves. XLF almost made it to the .618 line at 25.82 last July 23. the Aug 24 plunge took it through the .500 line to within 0.31 of the .382 Fib — a respectable retracement. It was also with .44 of a .382 retracement of the rise since 2009. So far, so good – right? But, earlier this month, XLF pushed back above the .500 Fib – a red flag for bears counting on a continuation to 18.21 or below.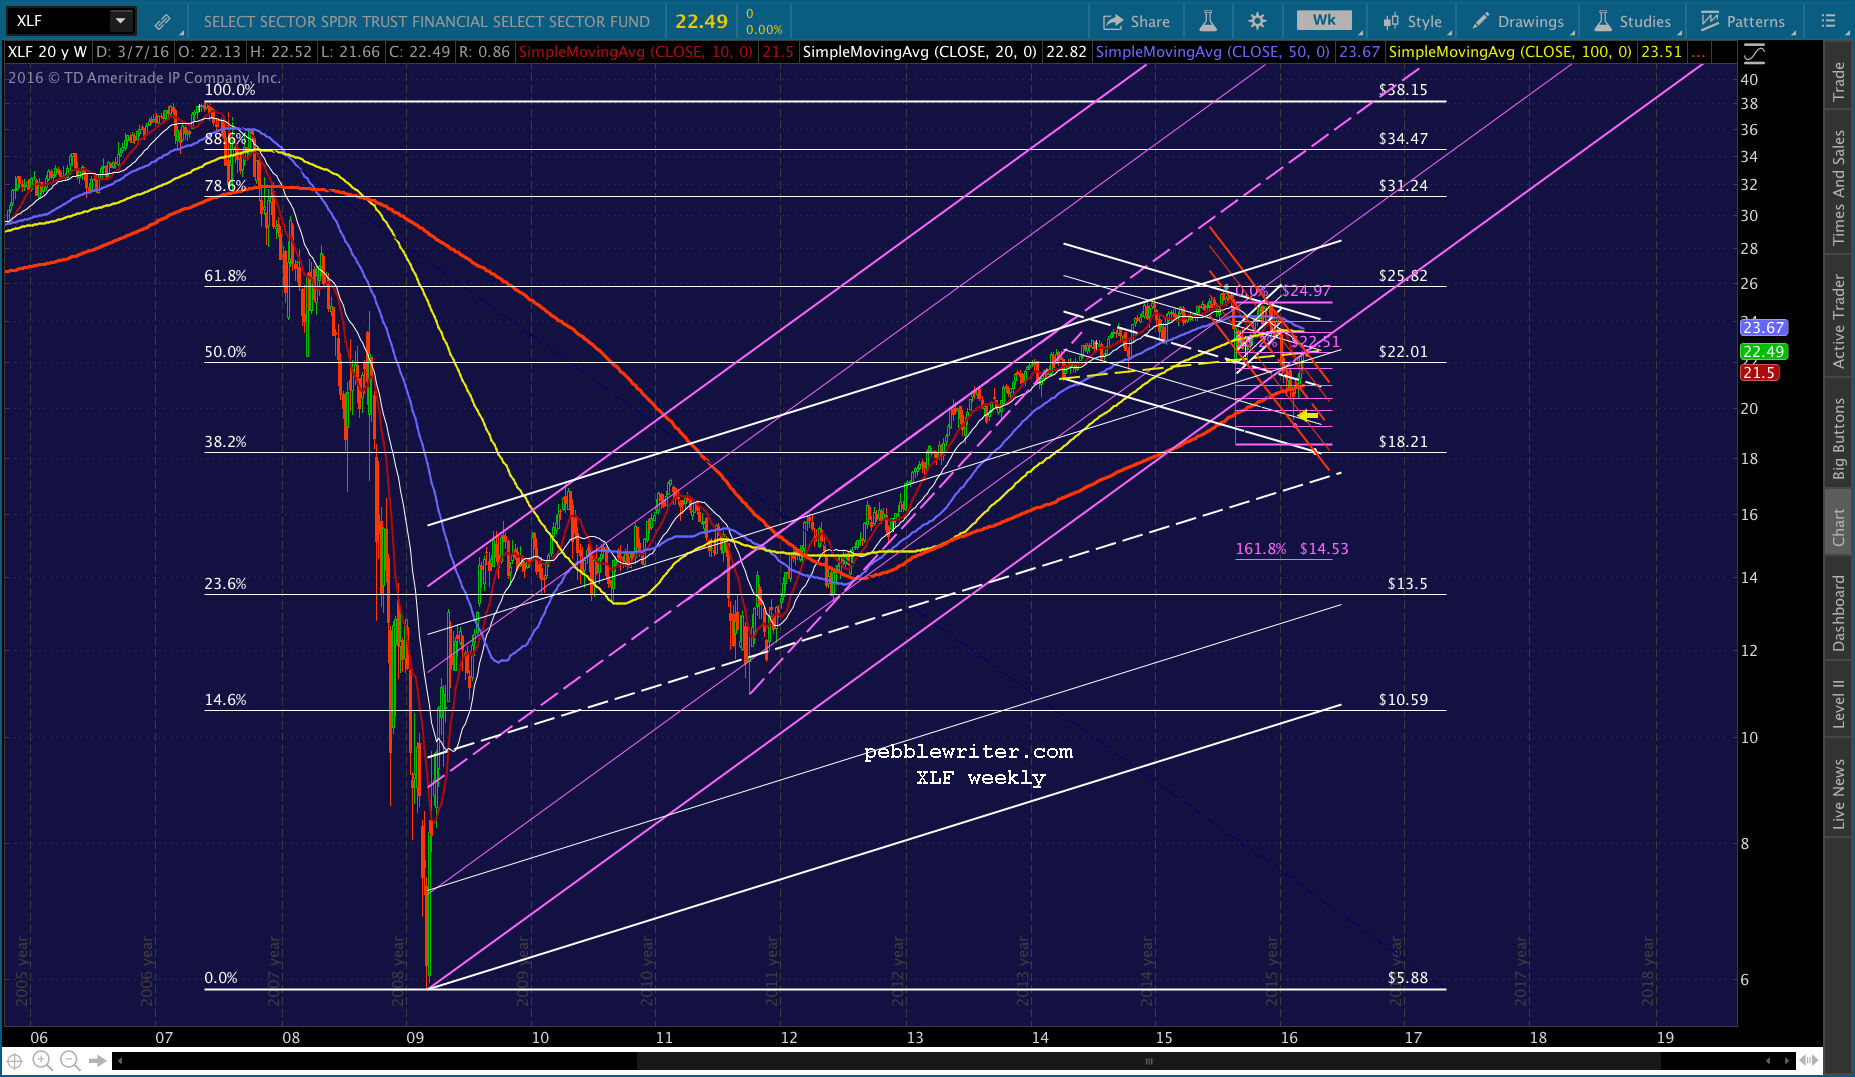 The bottom line:
XLF’s decline its topping pattern first began in early 2014 has been carefully managed. Were it not for the sell-off in January precipitated by the Fed’s December rate increase, it would still be bouncing along above the yellow neckline.
TPTB now have a chance to push it back above that neckline. SPX is in a similar position with respect to major overhead resistance. We can expect some consolidation after such strong advances in recent days. But, bulls have much to lose if they can’t push it above 22.51 and keep it there.
If they can, then the SMA 100 (22.89), SMA 200 (23.54) and the top of the falling white channel (24ish) beckon — beyond that, the .618 at 25.82.
If they can’t, then we should see a backtest of the falling white midline around 20.98. If that fails, 19.26 should serve as a magnet, with 18.21 the bulls’ current line in the sand.
There is a middle ground — a managed decline into the end of the year, when the white channel midline reaches 18.21. It would drain some bearish sentiment, and allow the long-term bullish trend to continue.
Going with my gut, I’d have to give a slight nod to the bullish case. Central bankers have engineered an impressive rally off the Feb lows by ramping CL by an astounding 50%. While this action will have serious repercussions for the real economy, there’s no reason to believe they’re done.
Both the Fed and the BoJ are meeting this week, and I assure you they watch the prices of stocks in the financial sector.
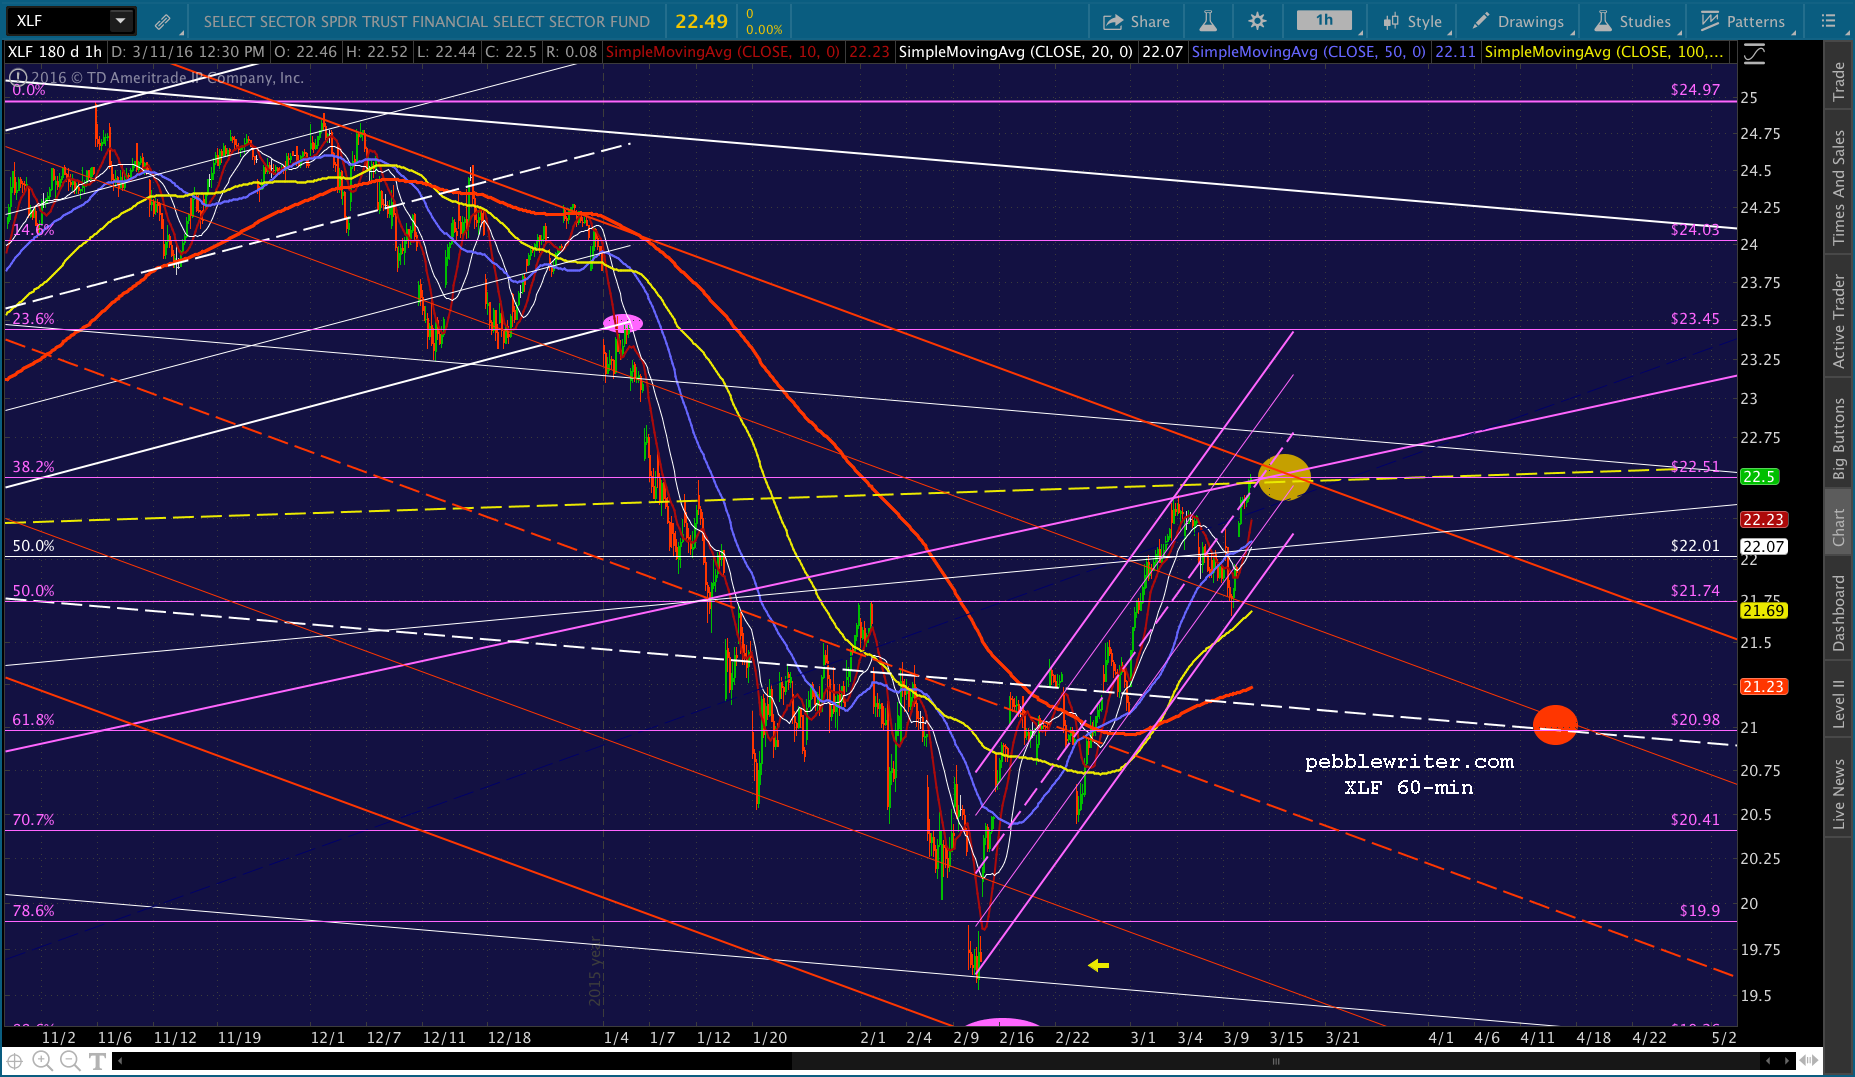 Nervous short-term traders might want to take profits here and adopt a wait-and-see stance. If it pops through the yellow neckline, it’s safer to remain long. Longer-term investors will want to keep an eye on the rising red channel. A drop through its bottom signals another leg down — or at least a backtest of the white midline currently around 21.
GLTA.