

It’s easy to get lost in the weeds when looking at the broad markets. The one unmistakable trend, however, is that SPX has been on a purposeful path to erase any signs of weakness at every turn.
The brief violations of the rising yellow channel’s midline in December 2018 and its bottom in March 2020 yielded enormous liquidity-stoked and virtually uninterrupted rallies which saw ES rise 47% and 72% respectively. Fibonacci levels which posed little overhead resistance on the way up were assiduously defended once they became support.
 The same algo-baiting tools were used in each instance: ramp up oil prices, power up the yen carry trade, and crush volatility every time stocks drop to dangerous levels (or just need a little boost.) It has worked, by and large. Most indices are at all-time highs.
 While this has been a stellar year for equities, we have to wonder whether it’s sustainable – particularly since we face the greatest global disaster of the last 70 years. Have global markets gone the way of Japan’s carefully managed and government supported Nikkei? Have things changed so fundamentally that downside risk has been eliminated?
The Fed, ECB and BoJ expanded their balance sheets by over $8 trillion this past year. Consider that it took them almost 8 years to expand by that same amount following the GFC. Future growth of their balance sheets is essentially baked in. Their bond buying has driven over $18 trillion in global debt to negative yields. That’s somewhere between $500 billion and $1.5 trillion in interest that might otherwise have been earned by pension funds, insurance companies and retirees. Instead, it has been lost and, more importantly, has forced a flood of investment funds into equities.
 Central banks will swear they yearn for higher inflation. Yet, higher inflation has always led to higher interest rates. Given the explosion of debt on their books, few nations could withstand a return to normalized rates.
Low inflation and low interest rates are no longer optional. The Fed had no choice this past year to follow the BoJ and ECB’s lead in crushing interest rates.

continued for members…
As we’ve discussed many times over the years, the simplest way to temper inflation is to pay strict attention to the YoY increase in oil and gas prices. The correlation is quite strong.
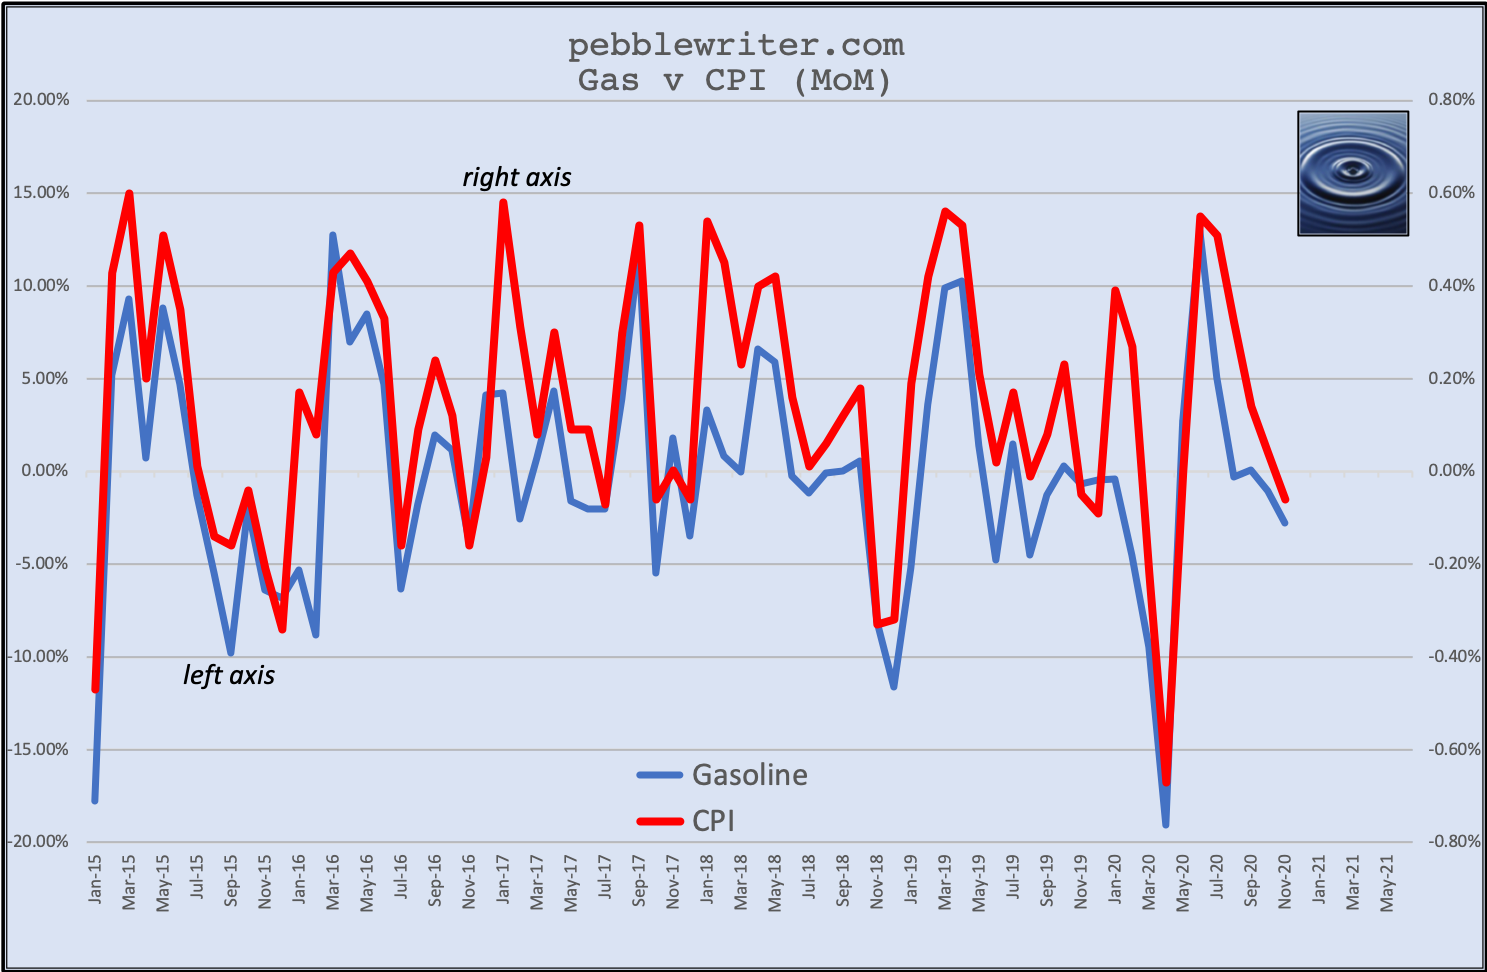 Thanks to WTI/RBOB’s plunge to all-time lows in March 2020, retail gasoline dropped to a monthly average of 1.721 in April.
Were gasoline prices to remain at December 2020’s 2.105, the YoY increase in April would ratchet up to 22.3%. In the past, a 22% YoY increase would have meant CPI in excess of 2.5%.
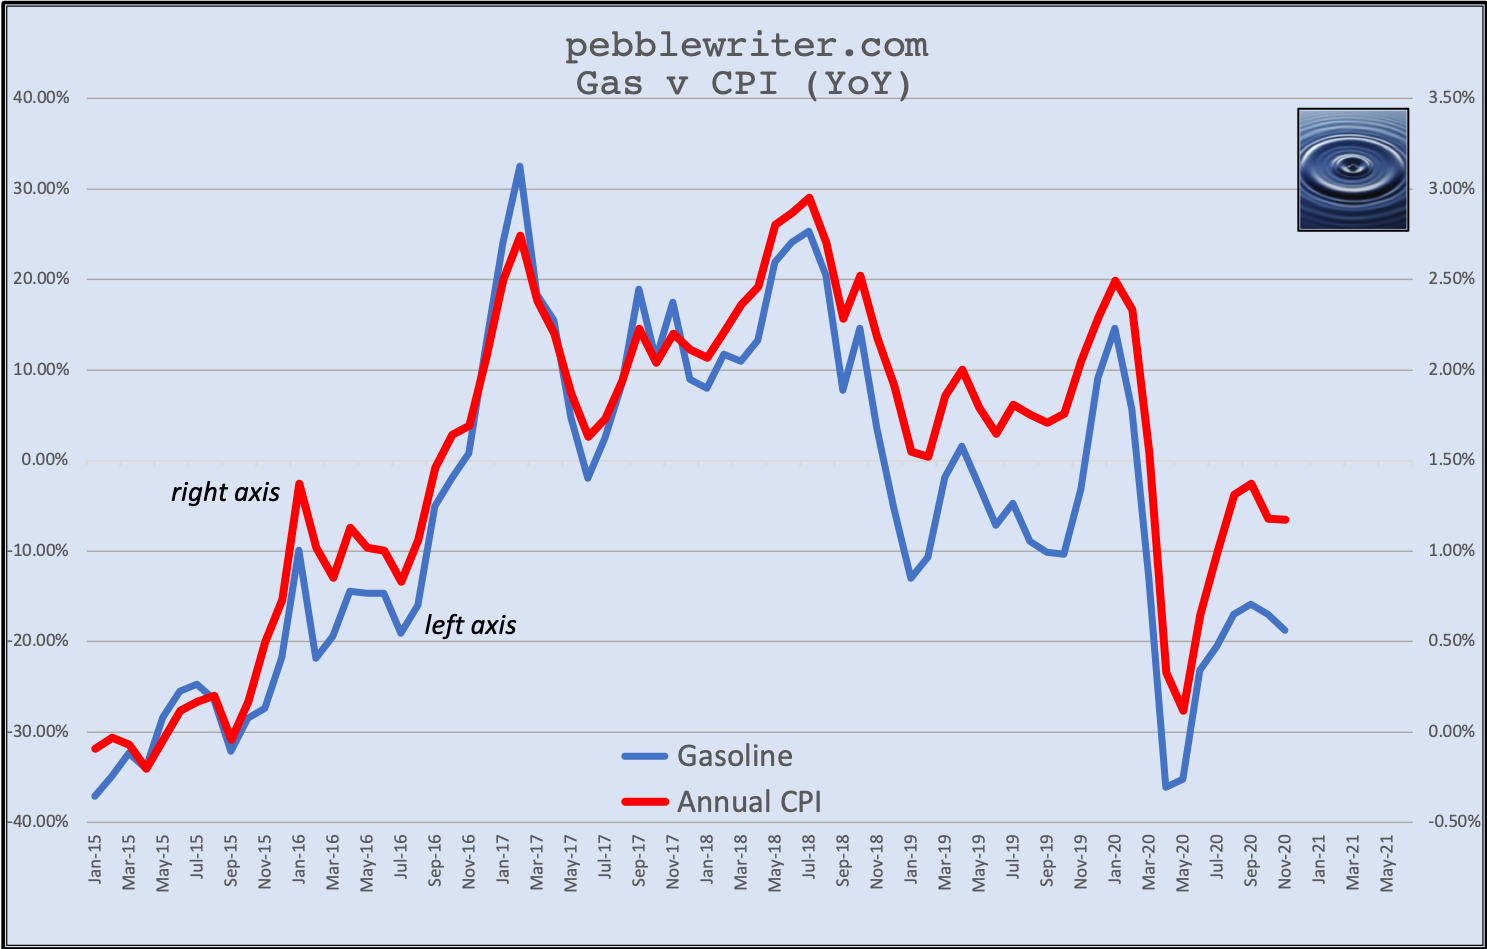 And, CPI in excess of 2.5% would mean the 10Y at uncomfortably high levels. YoY CPI reached 2.5% only a handful of times over the past five years:
Jan-Feb 2017: CPI reached 2.50 and 2.74% respectively. The 10Y reached 2.62% in December in anticipating of those marks. It traded between 2.3-2.6% until early April.
May-Aug 2018: CPI registered between 2.7-2.95%, driving the 10Y to a range of 2.76-3.25%.
Dec CPI won’t come out until Jan 13. But, Nov’s came in at -0.06% MoM and 1.17% YoY. The 10Y ranged from 75-99 bps. To keep the 10Y in this range, the YoY delta in gas prices would need to remain where they are – namely negative 19%.
If RB were to revert to the middle of its Mar 2020 range, this would imply a drop of at least 40% between now and Mar 2021. Imagine a drop from 1.45 to 1.00. If CL were to drop a comparable amount, it would mean a tumble from 49.83 to 34ish.
In calling for a reversal on Dec 18, we noted that CL had reached its channel top and had backtested its big purple channel from its 2016 lows. RB had closed its gap from last March on Dec 17.
 Given the above chart, CL could easily be targeting the white channel midline at 38ish or even the purple channel midline around 23. Remember, our longer-term target had originally been 17.12 in 2023 based on recurring low every 2600ish days. It remains to be seen whether the April 2020 plunge busted the cycle pattern.
Whether it’s 23 or 38, a substantial drop like that in CL and a 40% drop in RB certainly won’t help stocks.
ES tagged that pesky .786 channel line again and reversed. At the same time, the SMA200 is sneaking up on the yellow channel midline at 3268ish – a juicy initial downside target IMO.
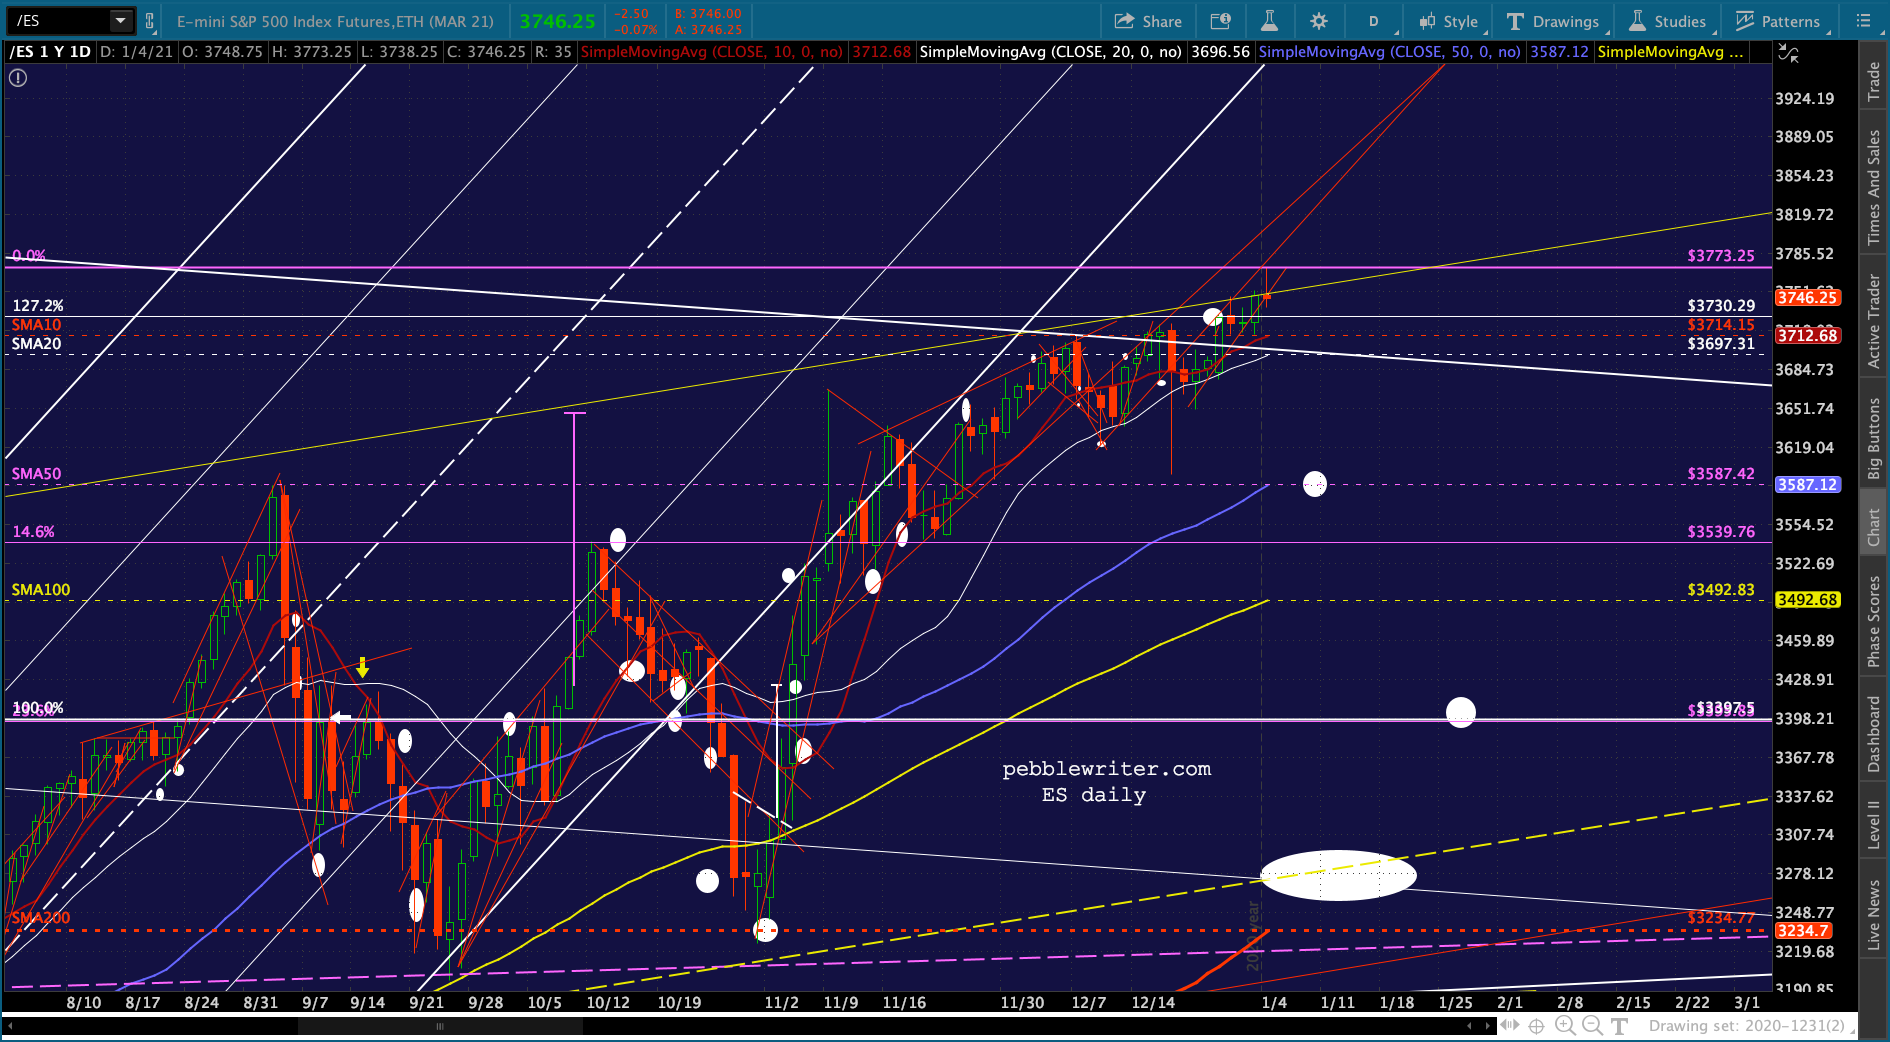 SPX is probably aiming at the SMA200 and purple .886 intersection at 3295ish.
 Needless to say, if the SMA200s break down, the downside potential is much greater. There are almost too many potential downside targets to count.
 By breaking out of their falling channels, GC and SI are endorsing the rising inflation situation. At some point, however, the drop in CL/RB will begin to weigh on them.
GC has broken free of the channel as well as the red and purple channel midlines and the SMA100.
 SI faces an important test here at the white channel midline.
  And, the currency picture remains pretty clear. DXY has likely bottomed and should at least do some backtesting…
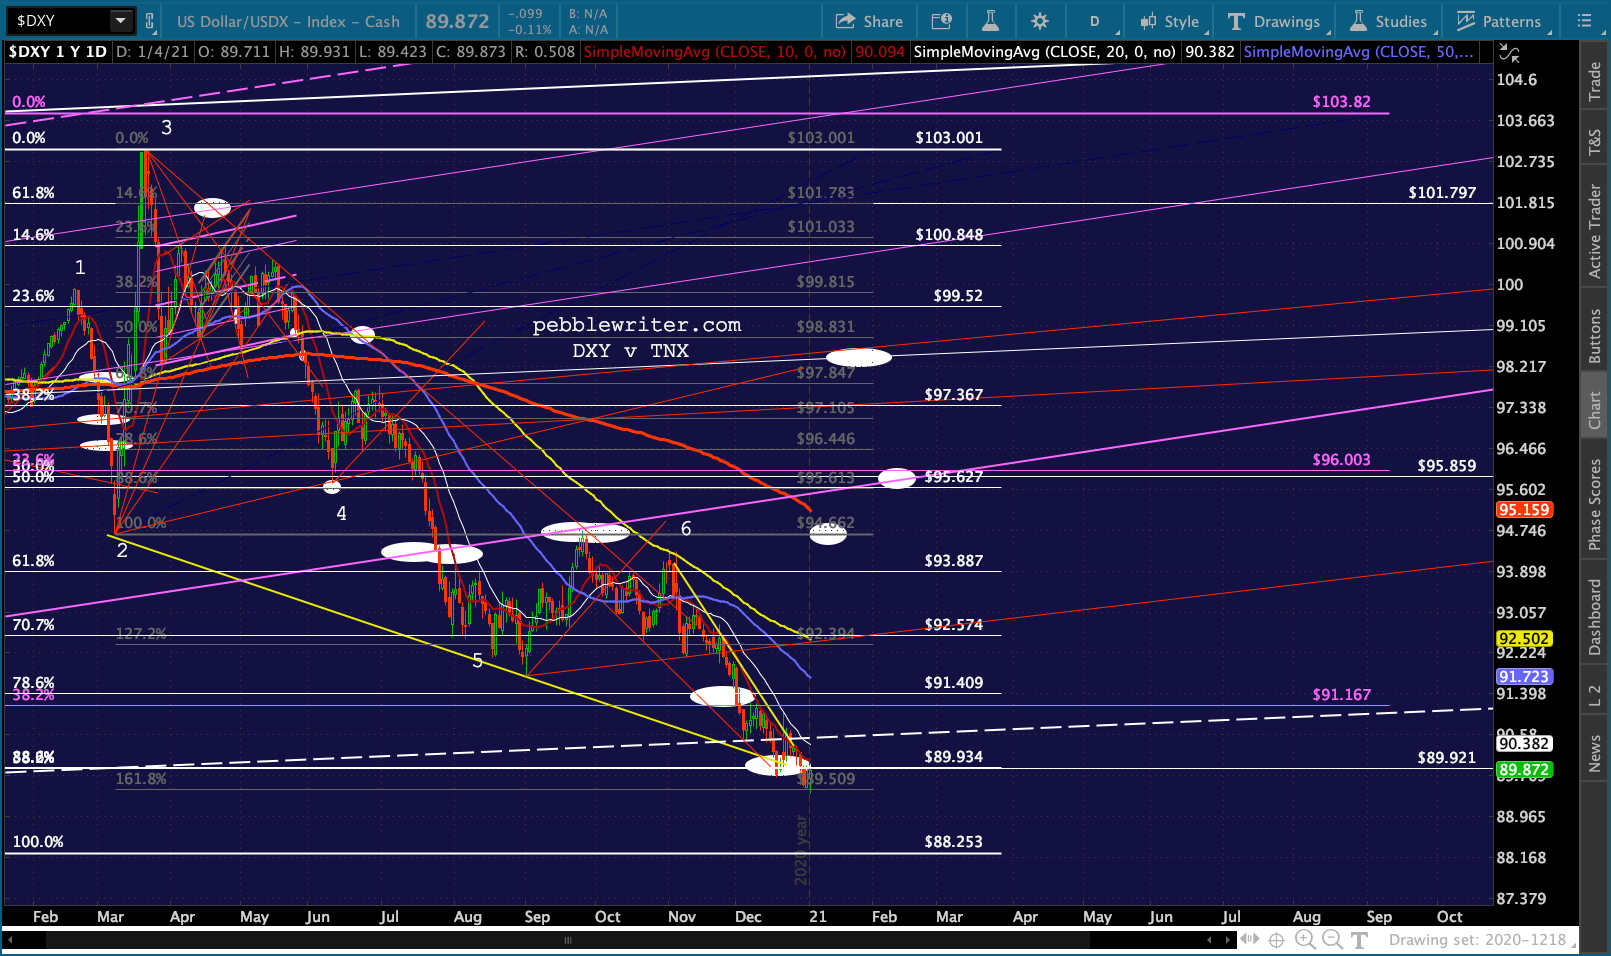 …while EURUSD has probably already topped or is about to…
…and USDJPY has a wide assortment of potential bottoms. The 10Y is finally making good on its threat to break down…
 …which should finally put some real pressure on the 2s10s.