

Last month, the Bureau of Labor Statistics flat out falsified the price of gas used in calculating CPI [see: Oct 3 Update on Oil.]
This month, the deception was a little more blatant. The price of gasoline registered by the EIA was as follows:
![]() Note that it starts out high, then decreases each subsequent week until the end of the month, where there’s a tiny increase.
Note that it starts out high, then decreases each subsequent week until the end of the month, where there’s a tiny increase.
For comparison, here’s what the spot price of gasoline actually did during the month of October. It starts out by dipping a little, then rips higher through the end of the month — completely out of sync with the price data incorporated by the EIA. Just for grins, here’s a price chart from GasBuddy.com – arguably an observer without an agenda. The price starts out around 2.50, like the EIA data. But, it never dips below 2.44, let alone approaches EIA’s 2.406.
 Conclusions? Like last month, the EIA reported prices lower than actually experienced in the real world. In addition, prices in the real world completely ignored the sharp increase in spot prices seen in the commodities markets.
What gives?
continued for members…
First, I think it’s fair to say that the government continues to deliberately understate inflation. Second, the oil companies which are presumably pricing gasoline based on the actual costs to produce/acquire it, deliberately ignored the spike in prices during the latter two-thirds of the month.
Did they develop a soft spot in their hearts for American consumers? Are their profits perhaps too high? Or is it just possible that they are (deliberately or not) playing along with Uncle Sam in keeping inflation under control?
I have no answer, but definitely find it odd. The one thing we can assume is that October’s reported 11% increase will likely result in a slight decline from CPI’s 2.2% mark in September. I wouldn’t be surprised to see it decline to the magic 2%.
November, however, is a different story. If RBOB were to remain at October’s reported 2.43, we’d see a 15.4% increase YoY — back above 2% CPI. At the 2.53 mark, they’d come in at a 20.7% increase — back above 2.2% CPI. While the December YoY data might work at 2.53, November
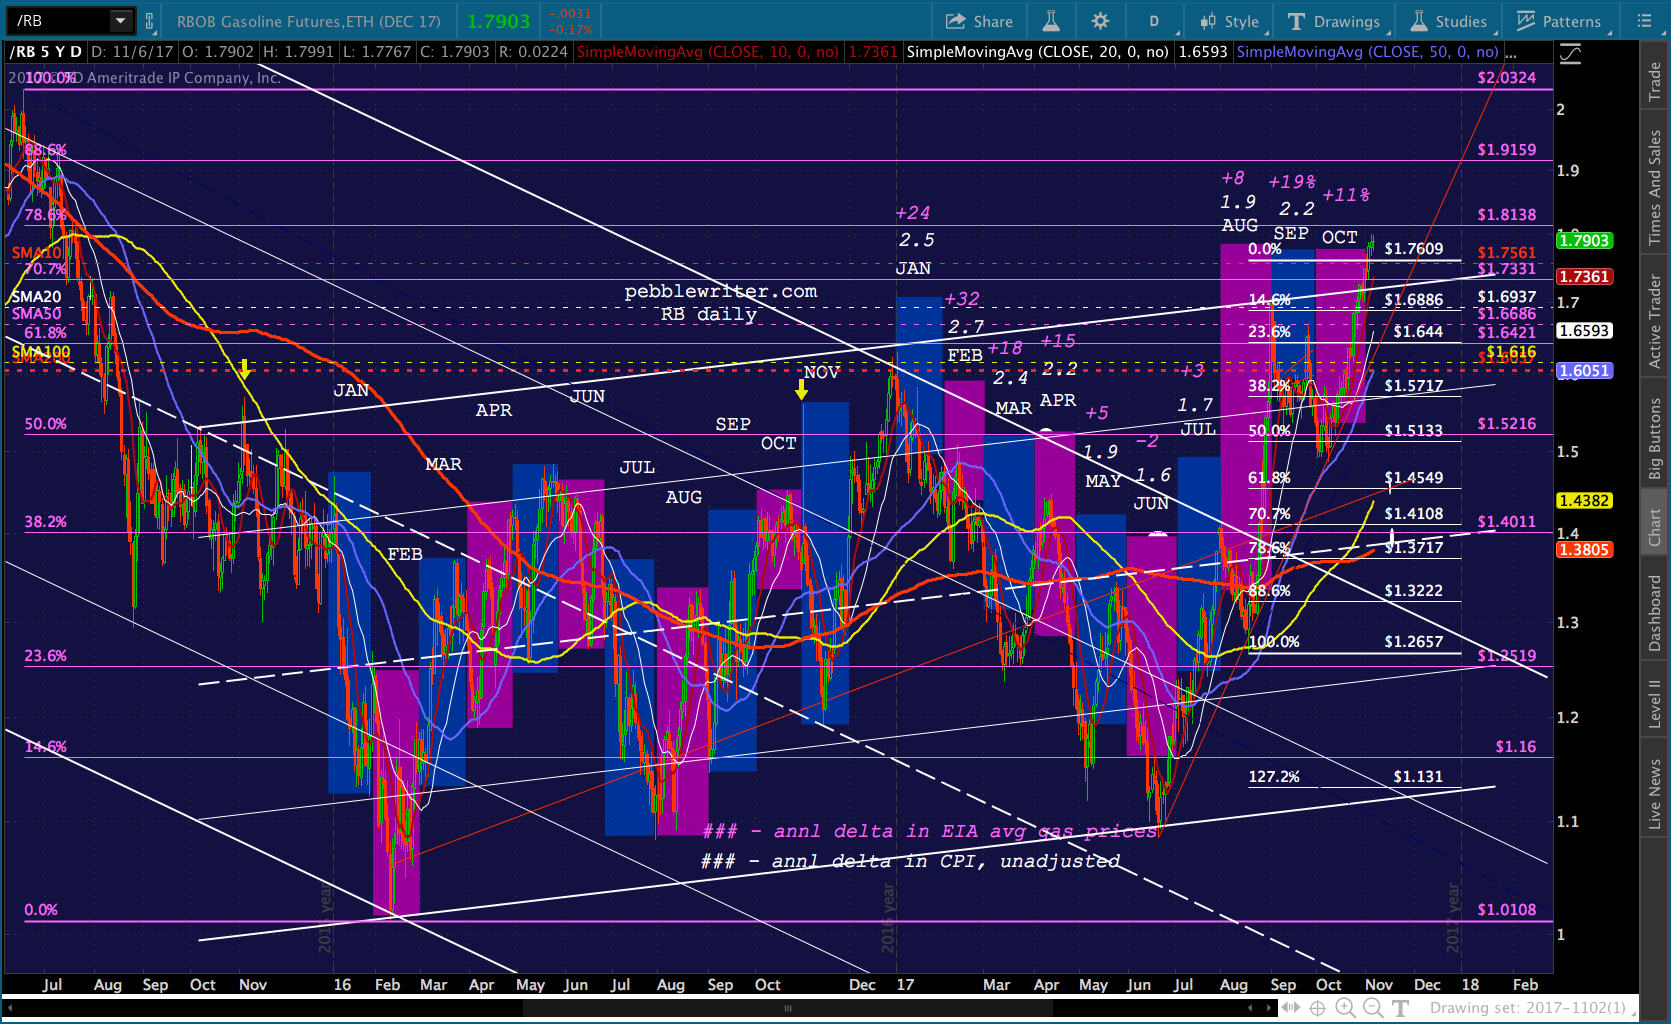 Note that in the two previous Novembers, we saw a sharp spike around the first of the month followed by a sharp sell-off. With RBOB approaching the .786 Fib, the prospect of a Gartley Pattern contributes to the odds of a reversal.
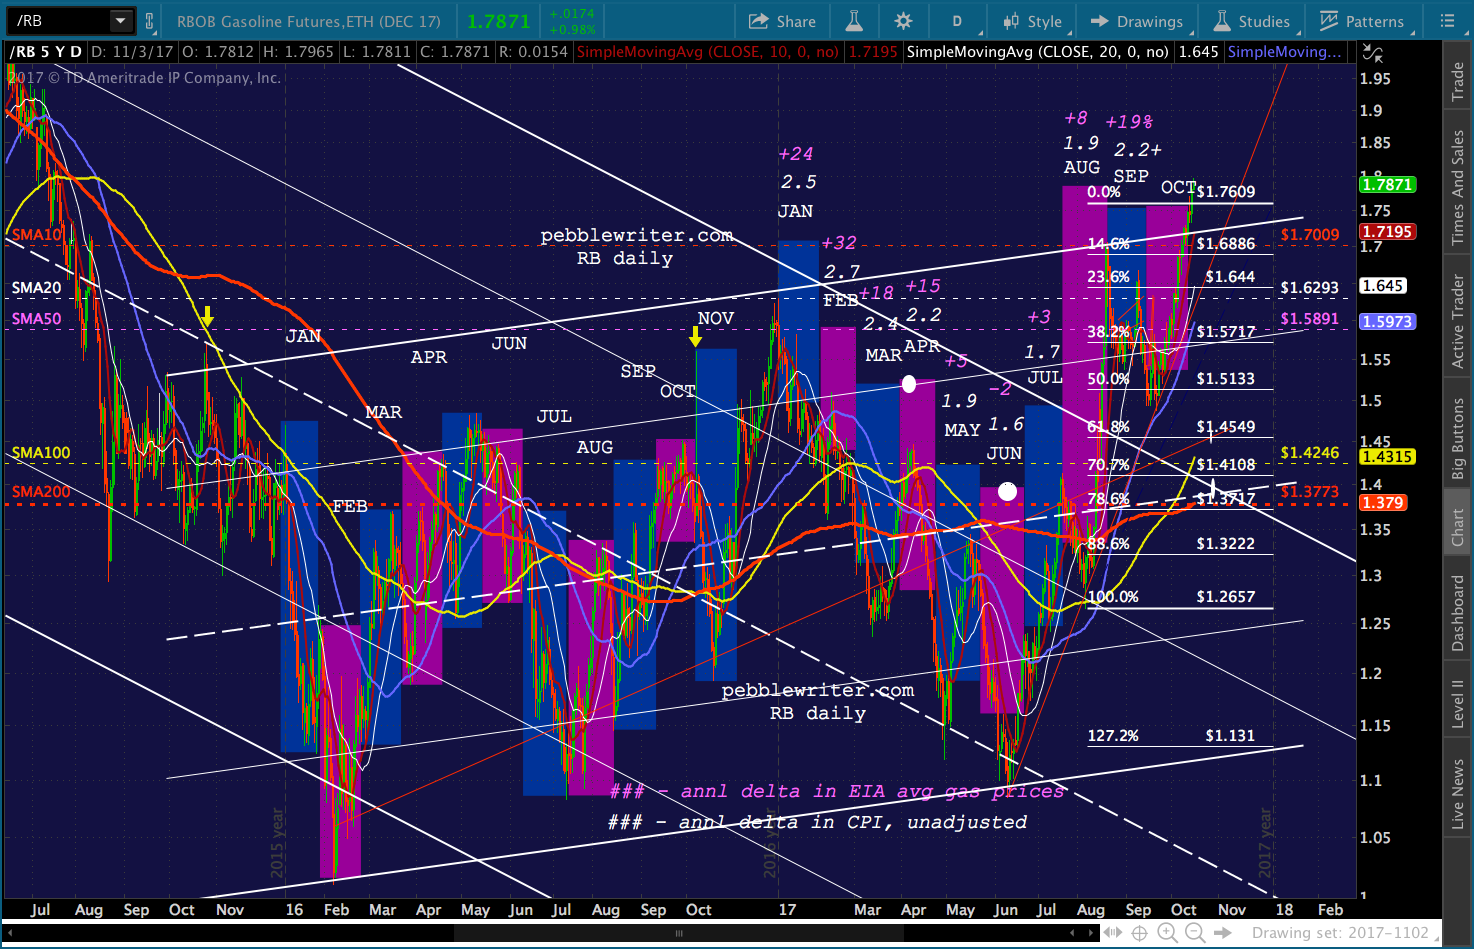 Last, consider the degree to which RBOB is overbought — and, on negative divergence.
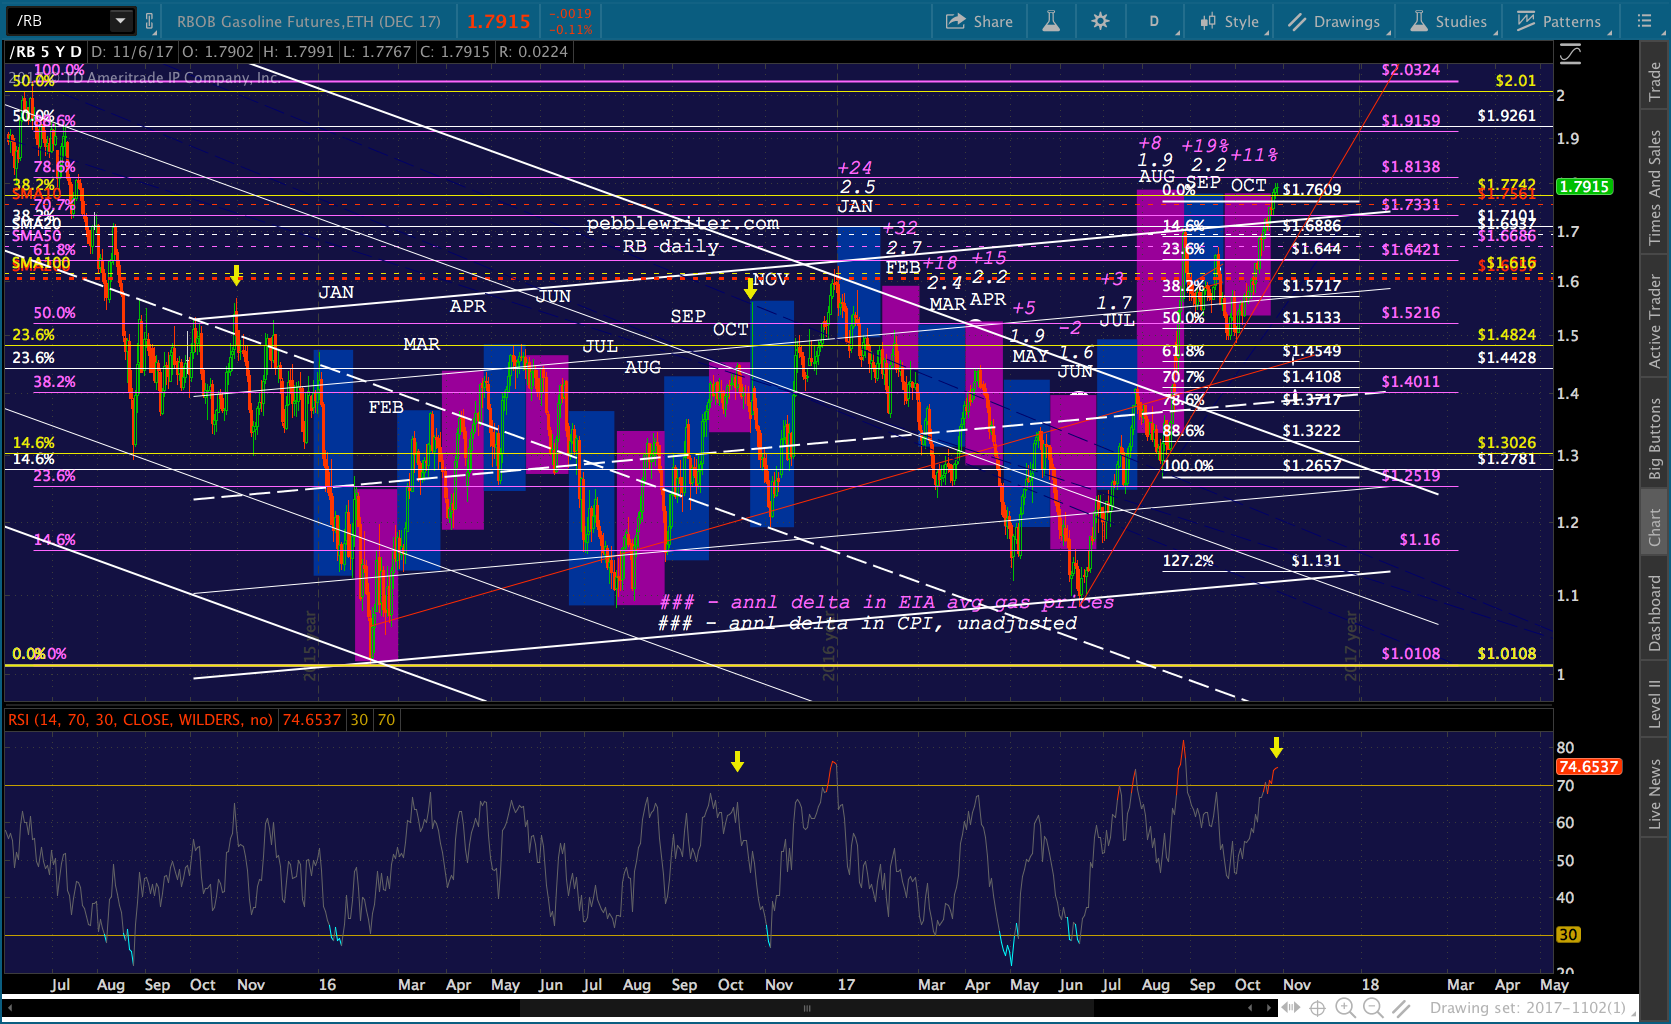 Bottom line, I think RBOB has maxed out here. The fundamentals certainly argue for lower prices. We should get at least a backtest of the SMA10 or SMA20. Beyond that, there’s not much support until reaching 1.45.
Now, let’s look at CL. Like RB, it saw a sharp increase during October — topping its Jan 3 highs. 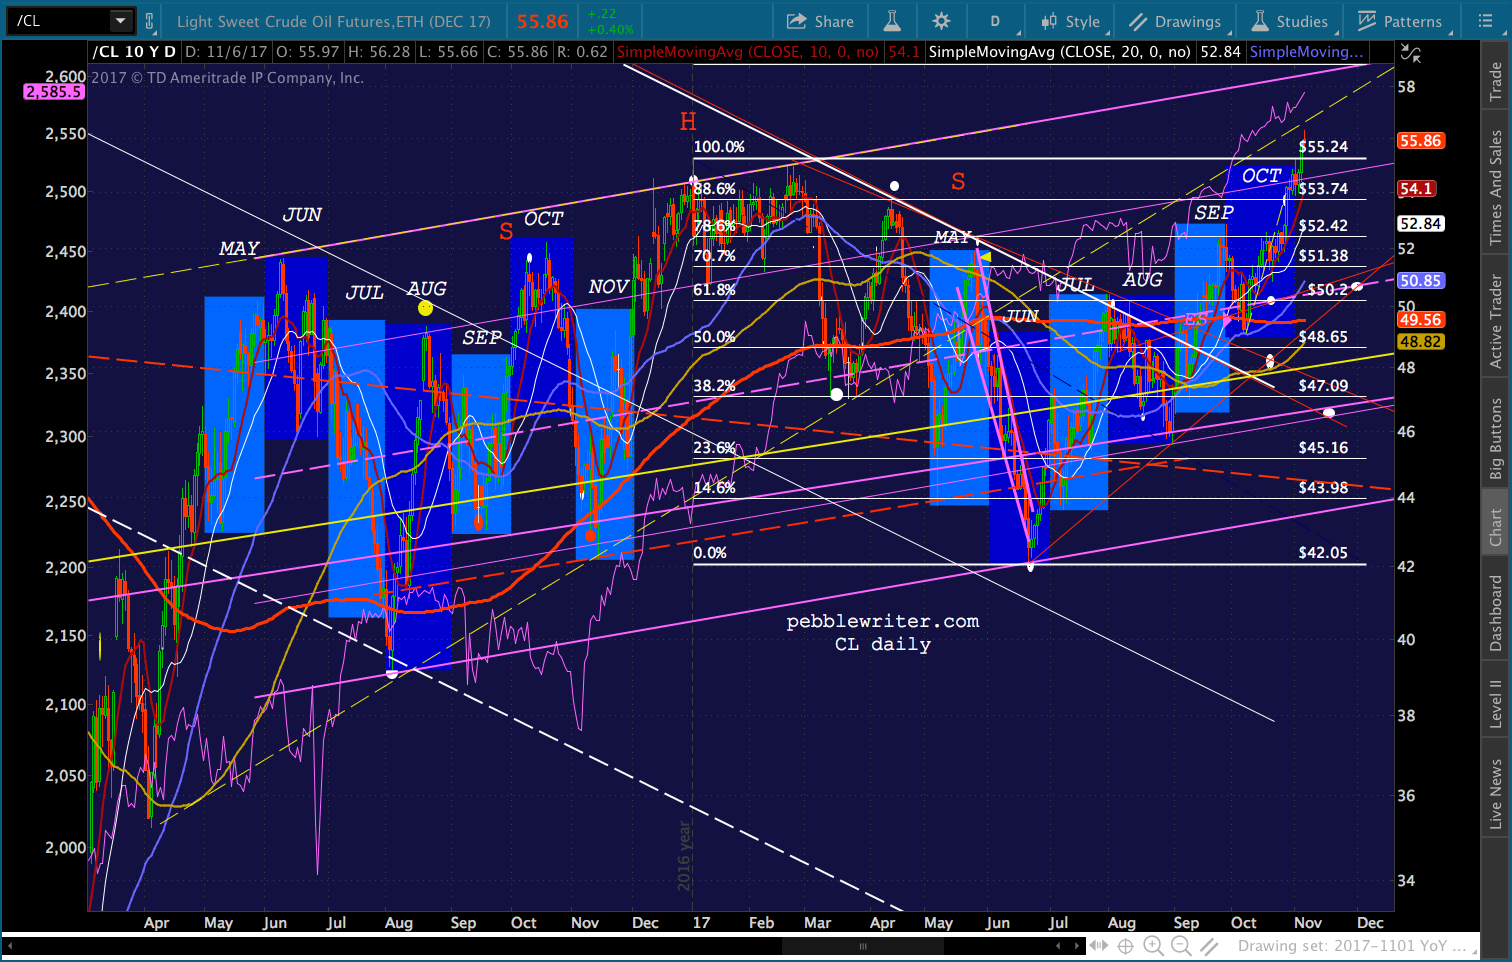 And, like RB, It is very overbought — though without the negative divergence. In fact, the only times it’s been more overbought were in Feb 2012 and June 2009. Both of those times occurred near tops which were followed by substantial drops.
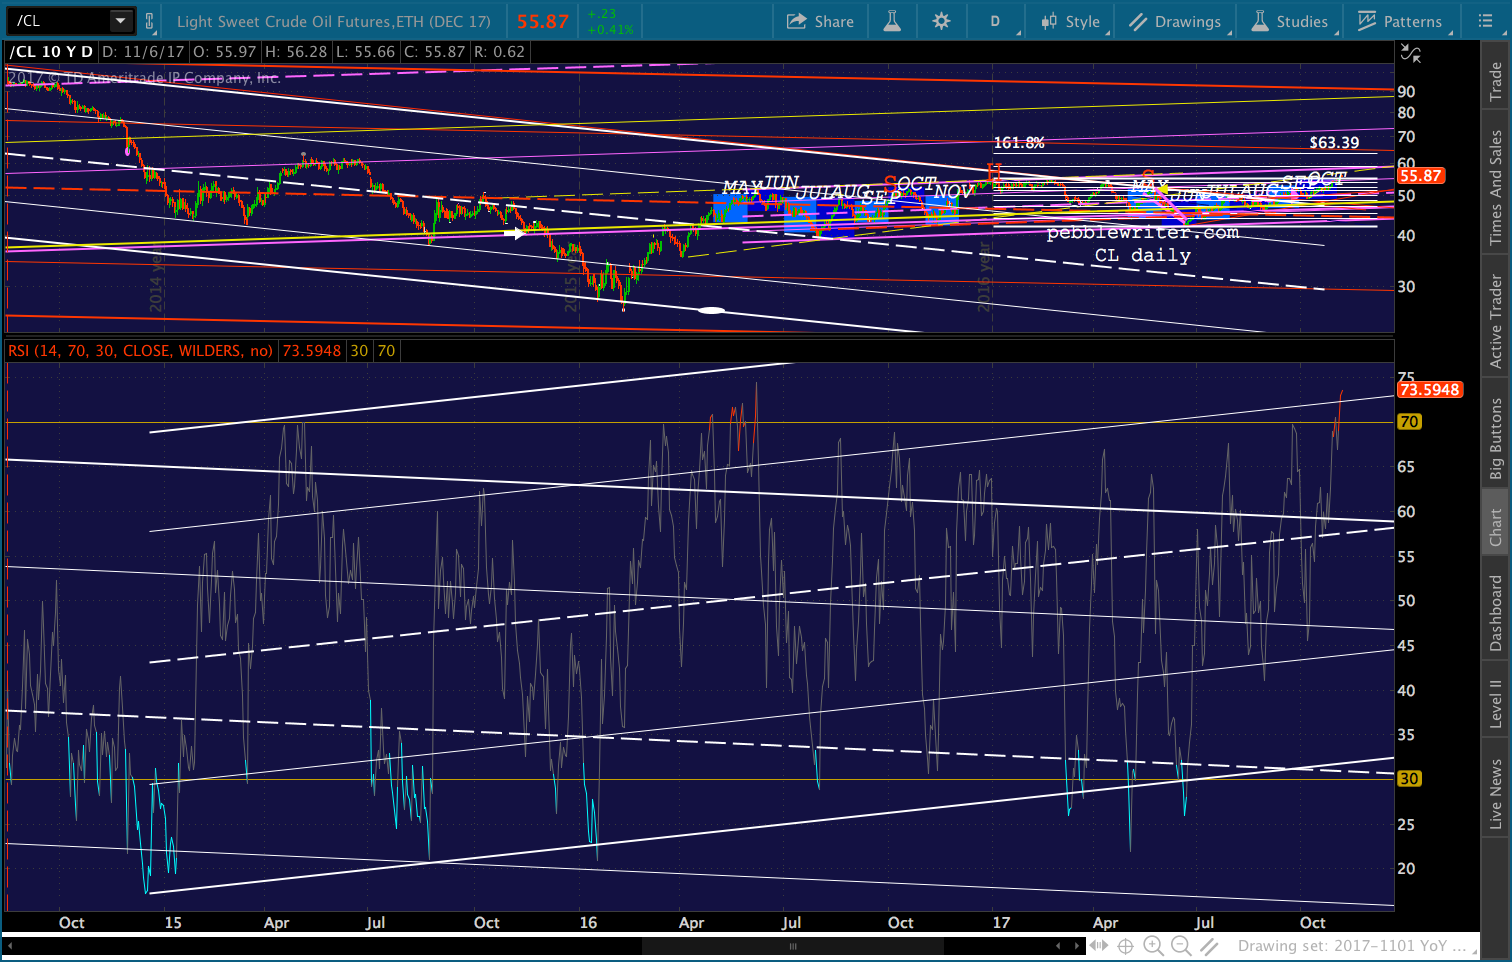 CL has a much broader impact on CPI than RB. But, it doesn’t always flow through as quickly or as sharply. As we’ve discussed before, the October YoY comparison is fairly mild at these levels. But, like RB, November tells a different story.
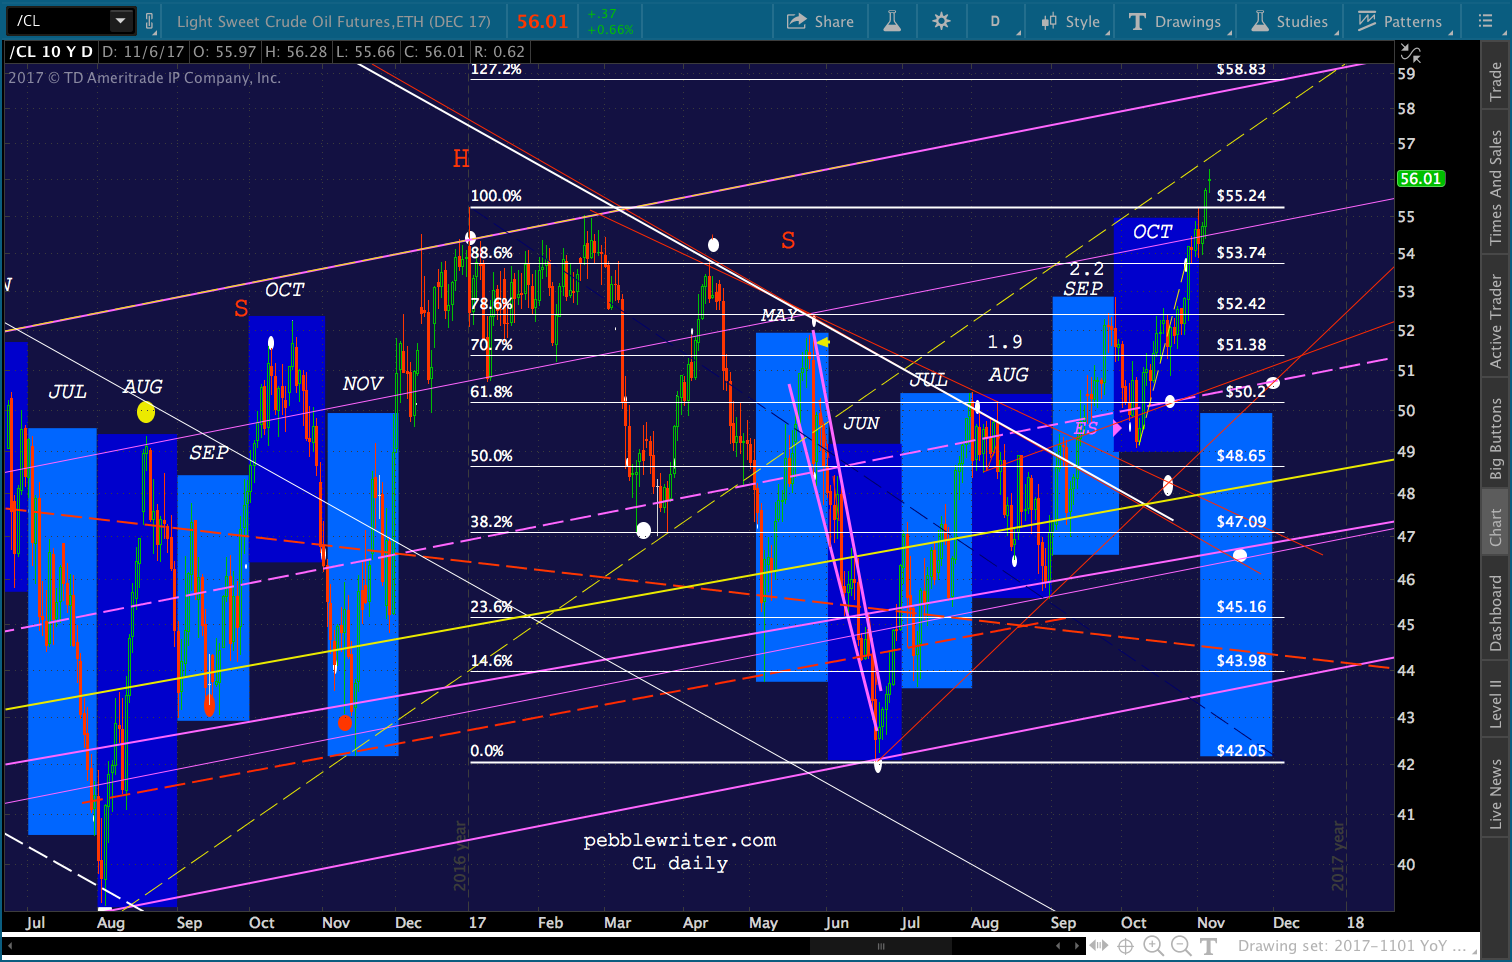
I’ve copied the price range from last year to this year for comparison purposes. When CL didn’t backtest the red TL, the channel it broke out of, or anything else in early October, it left a void. I have been expecting the void to be filled later this month.
 But, it’s difficult to toss that prognostication out there on a day when both RB and CL are up about 2% — partly the result of USD weakness and partly the result of Mideast turmoil (Saudi princes are dropping like flies.)
With the year end approaching, and CL so instrumental to SPX’s continued success, I have a hard time remaining bearish. At the end of the day, rising stock prices are going to trump (pun intended) inflation concerns.
I’d go long here, but with tight stops at 54ish. And, I’d keep a very close eye on it as it approaches the trend line just above. If it’s able to top and remain above that line, 58.83 is a good possibility.