

We’ve had a nice run with natural gas. Last September, with NG at 2.766, we identified 2.00 as an attractive target for a bounce (the red dot below.) Six weeks later, NG not only tagged 1.948 (a nice 30% drop) but, once there, proceeded to bounce 26%.
When the bounce fizzled and NG again plumbed new lows, we took another look and proposed a new downside target. From our December 14 update:
When long-term support is broken like this, we have to look to intermediate and short-term channels and Fibs — which, in this case, aren’t terribly bullish. Note the well-formed falling gray channel in the chart below. It’s been guiding prices lower since 2014 and suggests 1.632 by year end [the white dot.]

As it turned out, NG only reached 1.684 before the plunge protection team working the O&G complex decided they didn’t want it plunging below the 1999 lows. It was an impressive bounce, sailing up past the November highs.  I chalked it up as yet another centrally-managed price fixing designed to give the illusion of a healthy market. And, that’s how it played out.
The bounce failed almost as fast as it formed, and NG ended up tagging 1.632 after all — just a couple of months late. Again, it saw a nice bounce off our target; and again, the bounce has started to falter. Is our next downside target still in play?
continued for members…
The fact that NG didn’t reach 1.632 at year-end, when it was only 0.52 away, illustrates how it’s being manipulated. The other bounce as soon as it dipped below the 1999 lows was yet more evidence. There’s strong support for NG, and TPTB might well have made up their minds that it WILL NOT GO any lower. But, it’s also important to note that there’s serious selling pressure here. For instance, it didn’t even backtest the broken purple channel bottom before falling to new lows.
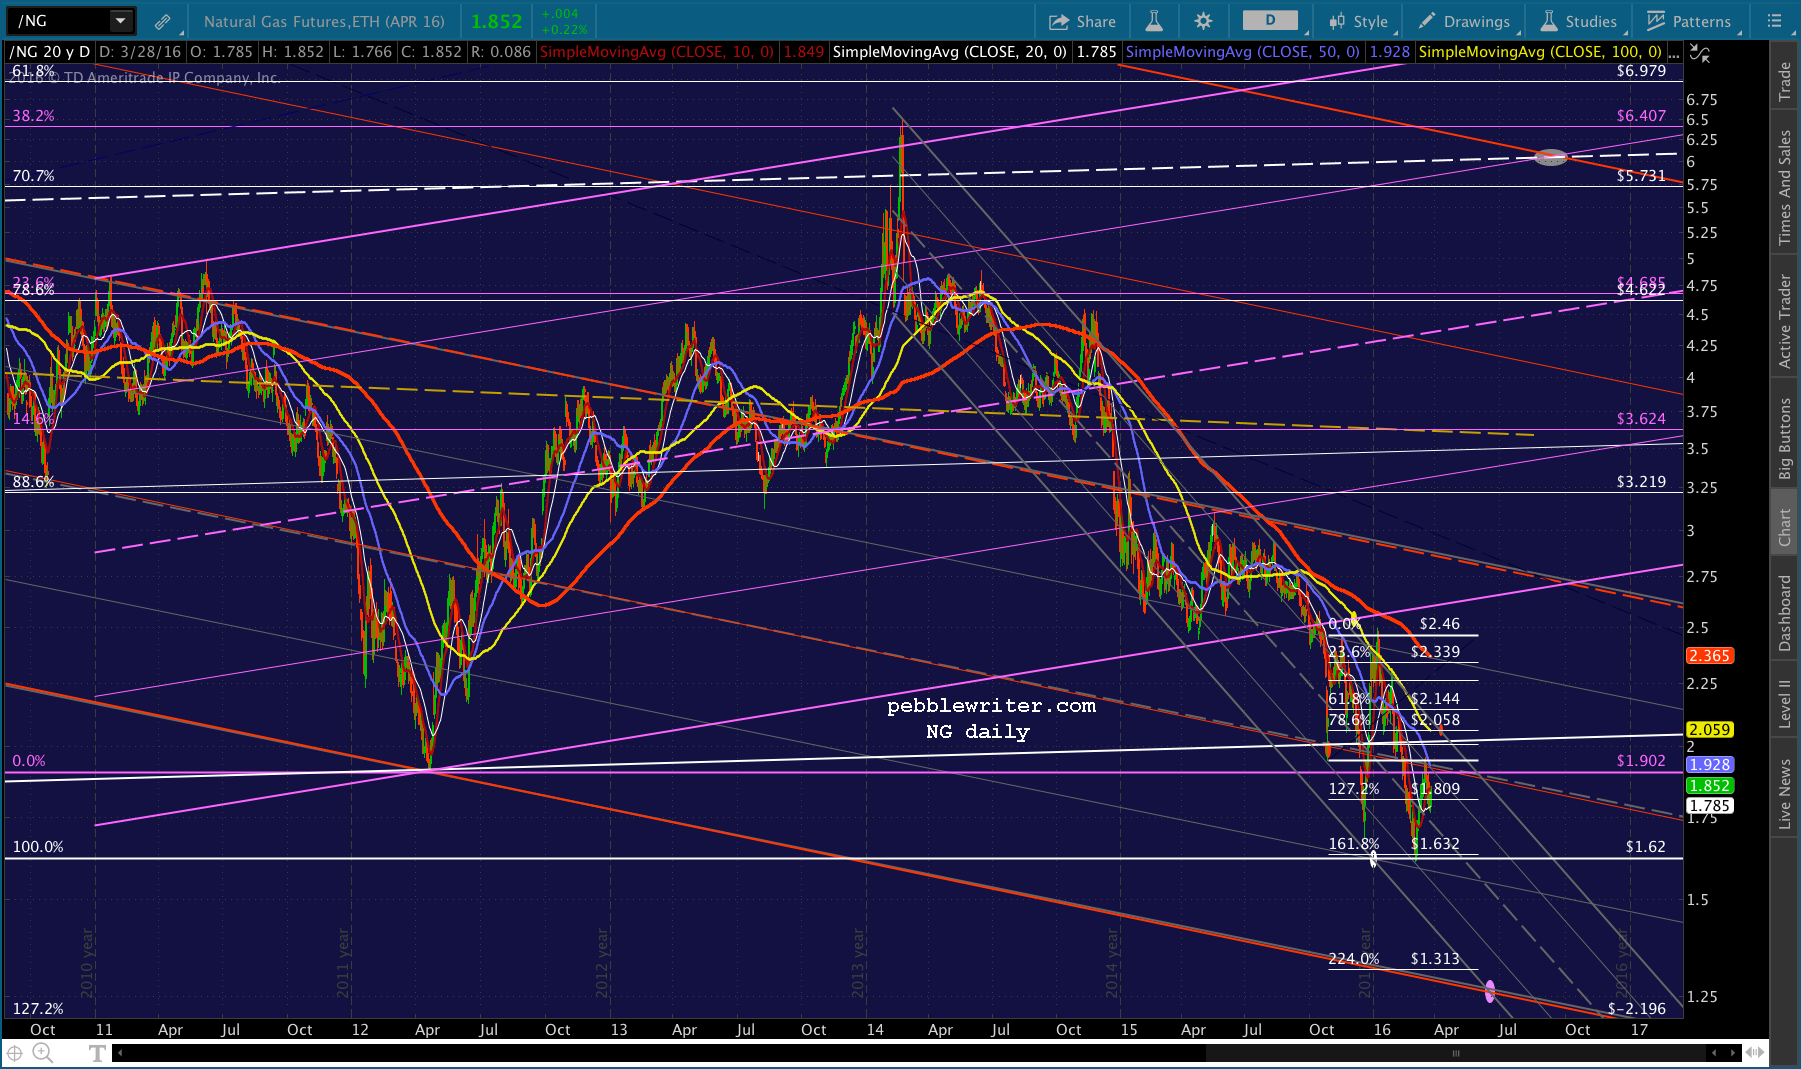
The next few days should be telling. It backtested the red midline on the 17th — but this is the same midline it burst through back in December. If it holds this time, then it’ll take another crack at 1.62.
And, it that fails, then we have a long ways to go until the falling gray channel intersects anything important — such as the falling red channel bottom around 1.25 in mid-June.
 And, with warmer weather right around the corner, we can expect the selling pressure to increase.
Stay tuned.