

Almost a year ago we noted that EURUSD’s nonsensical rally would fail and the longer term trend resume. Its recent breakout, manufactured to support stocks, had essentially no economic basis.
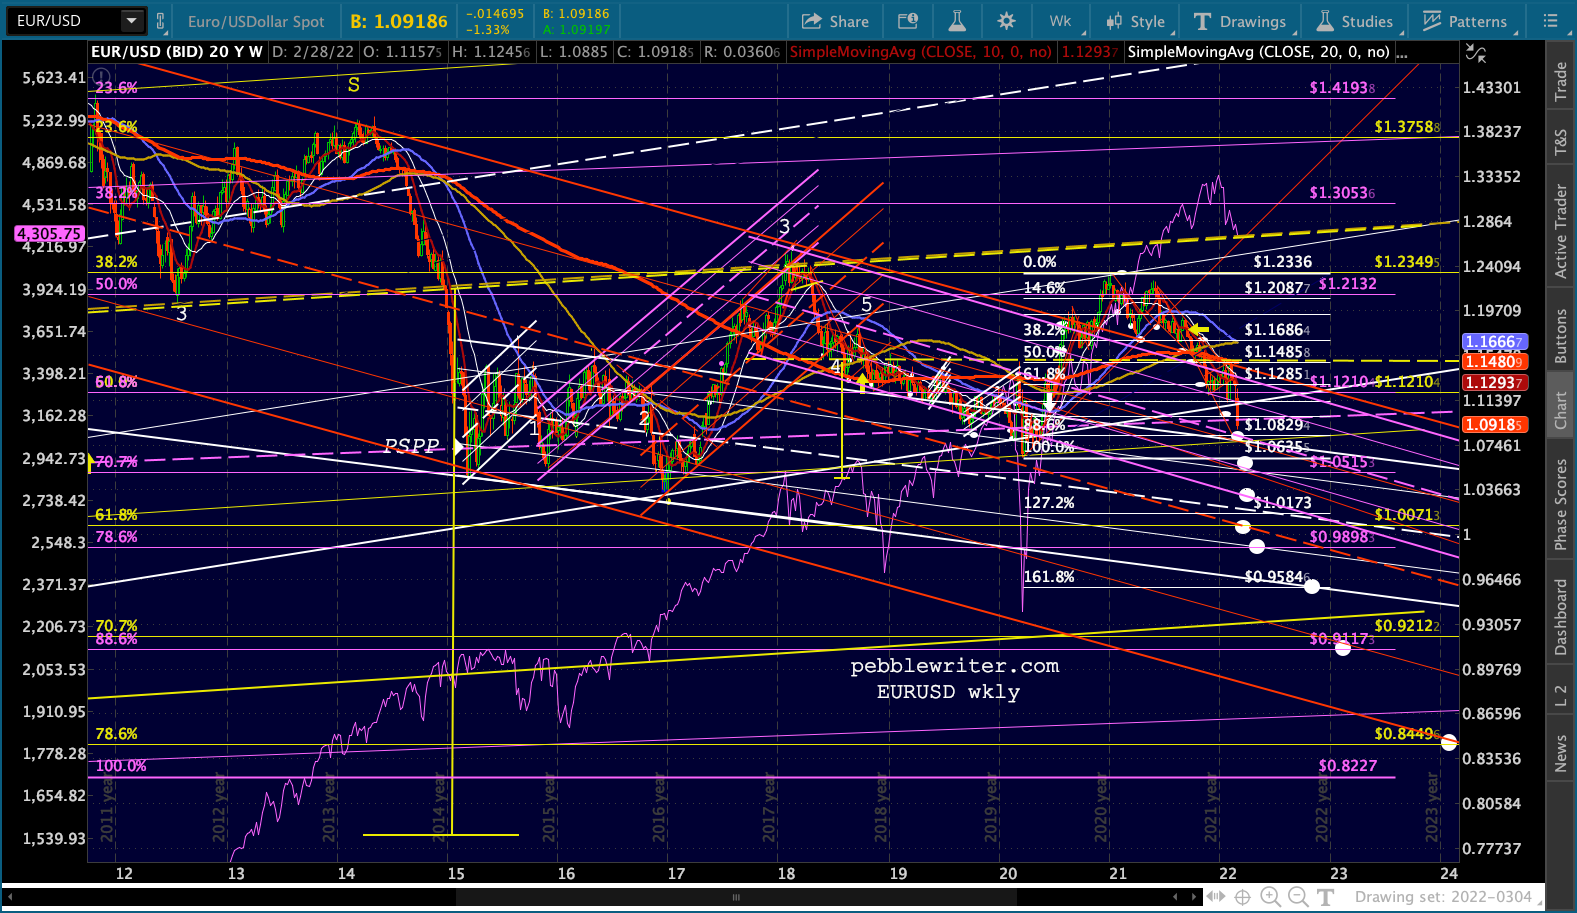
 Today, as EURUSD approaches that 1.0829 target we charted back then, it seems that economic reality is finally reentering the picture.
 Does Putin harbor a more sinister motive in attacking the Zaporizhzhia nuclear power plant? Could the threat of a scorched-earth nuclear “accident” there help drive Ukrainian opposition out of the area, effectively forming a buffer zone that essentially shifts Russia’s border further to the west?
 What would that mean to the EU?
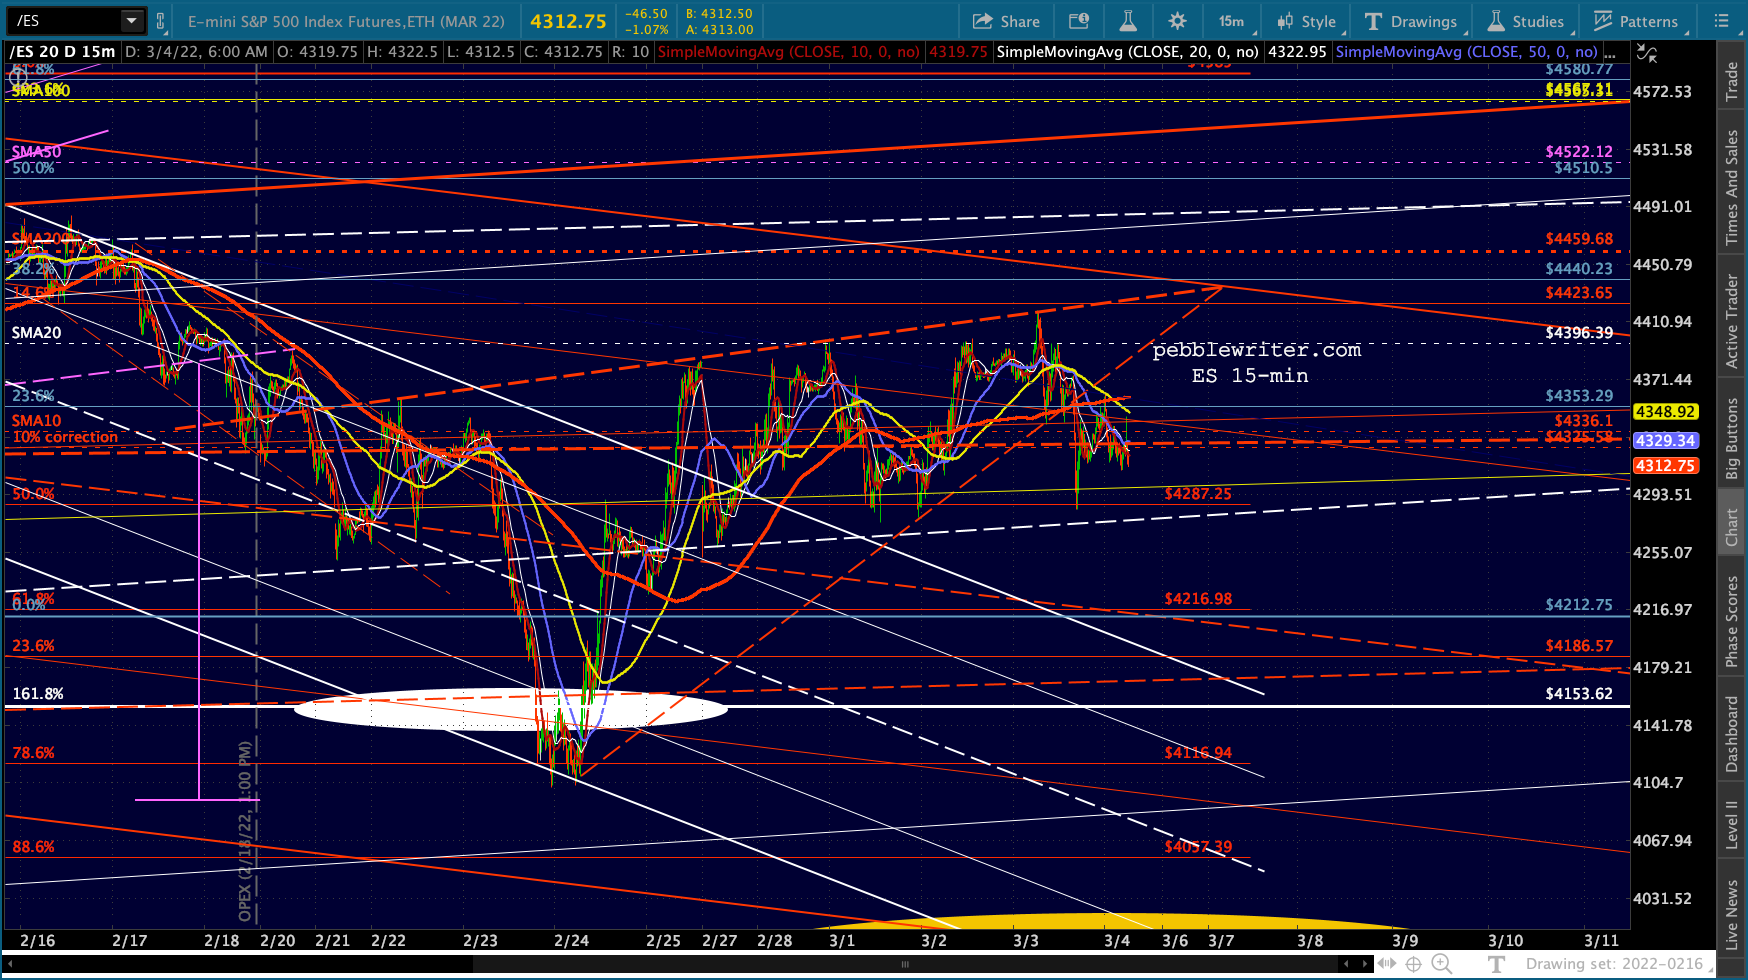
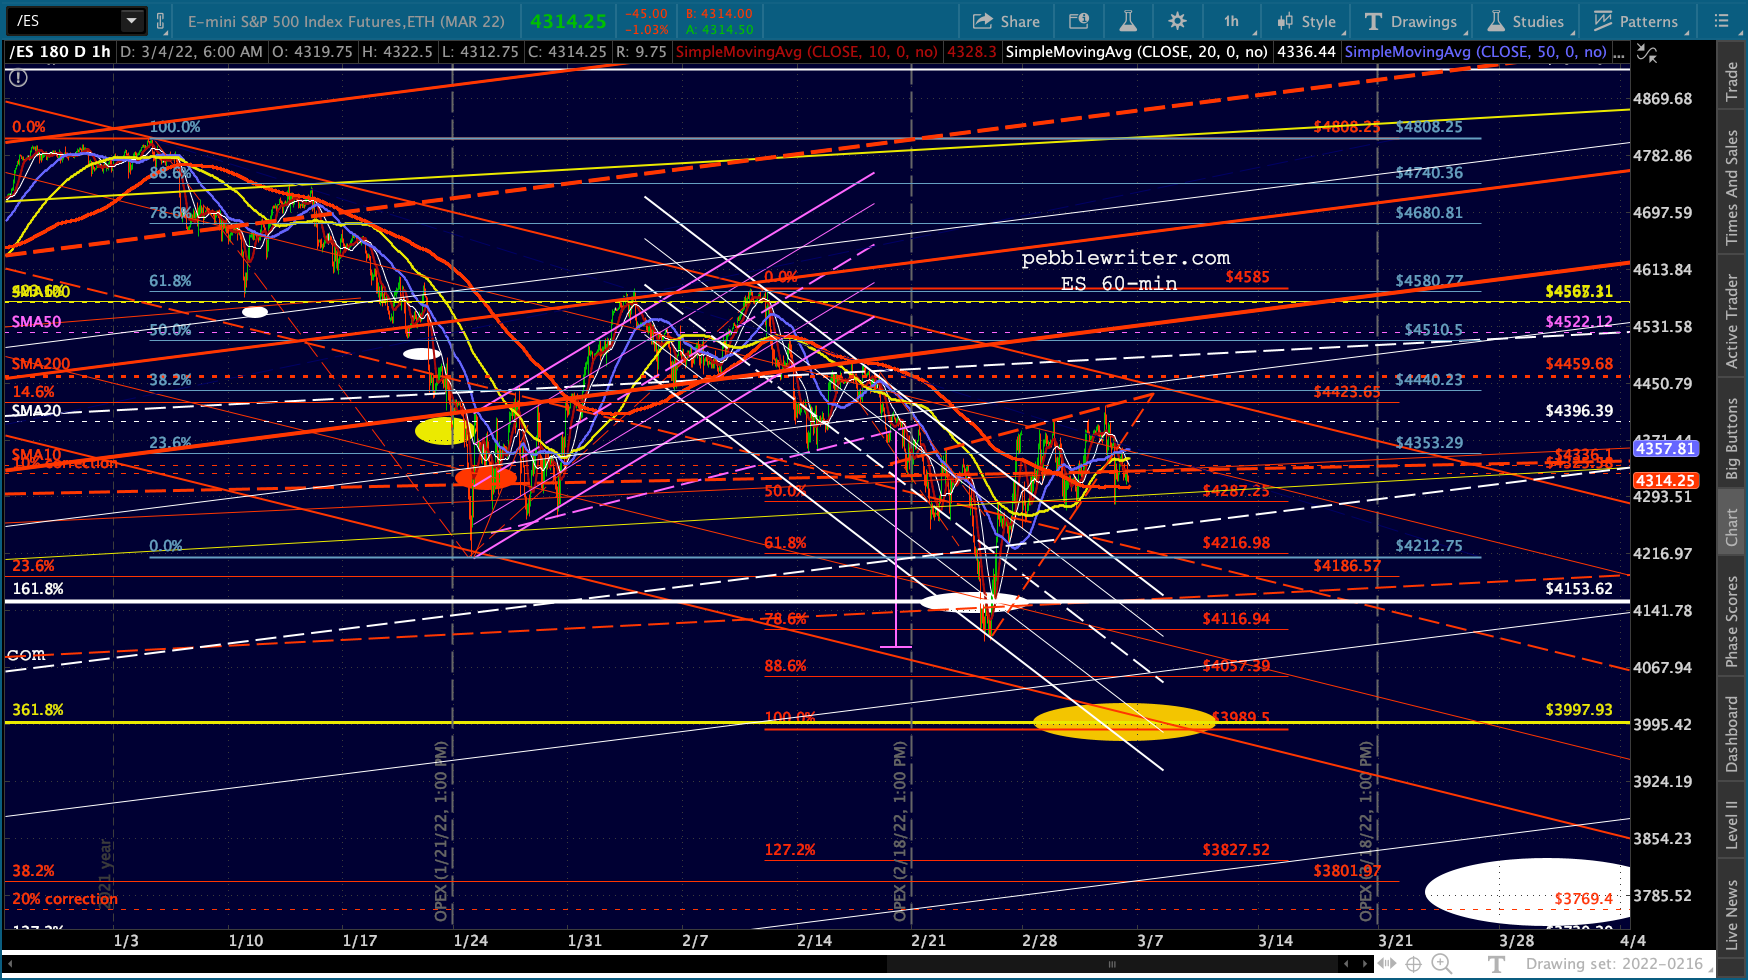
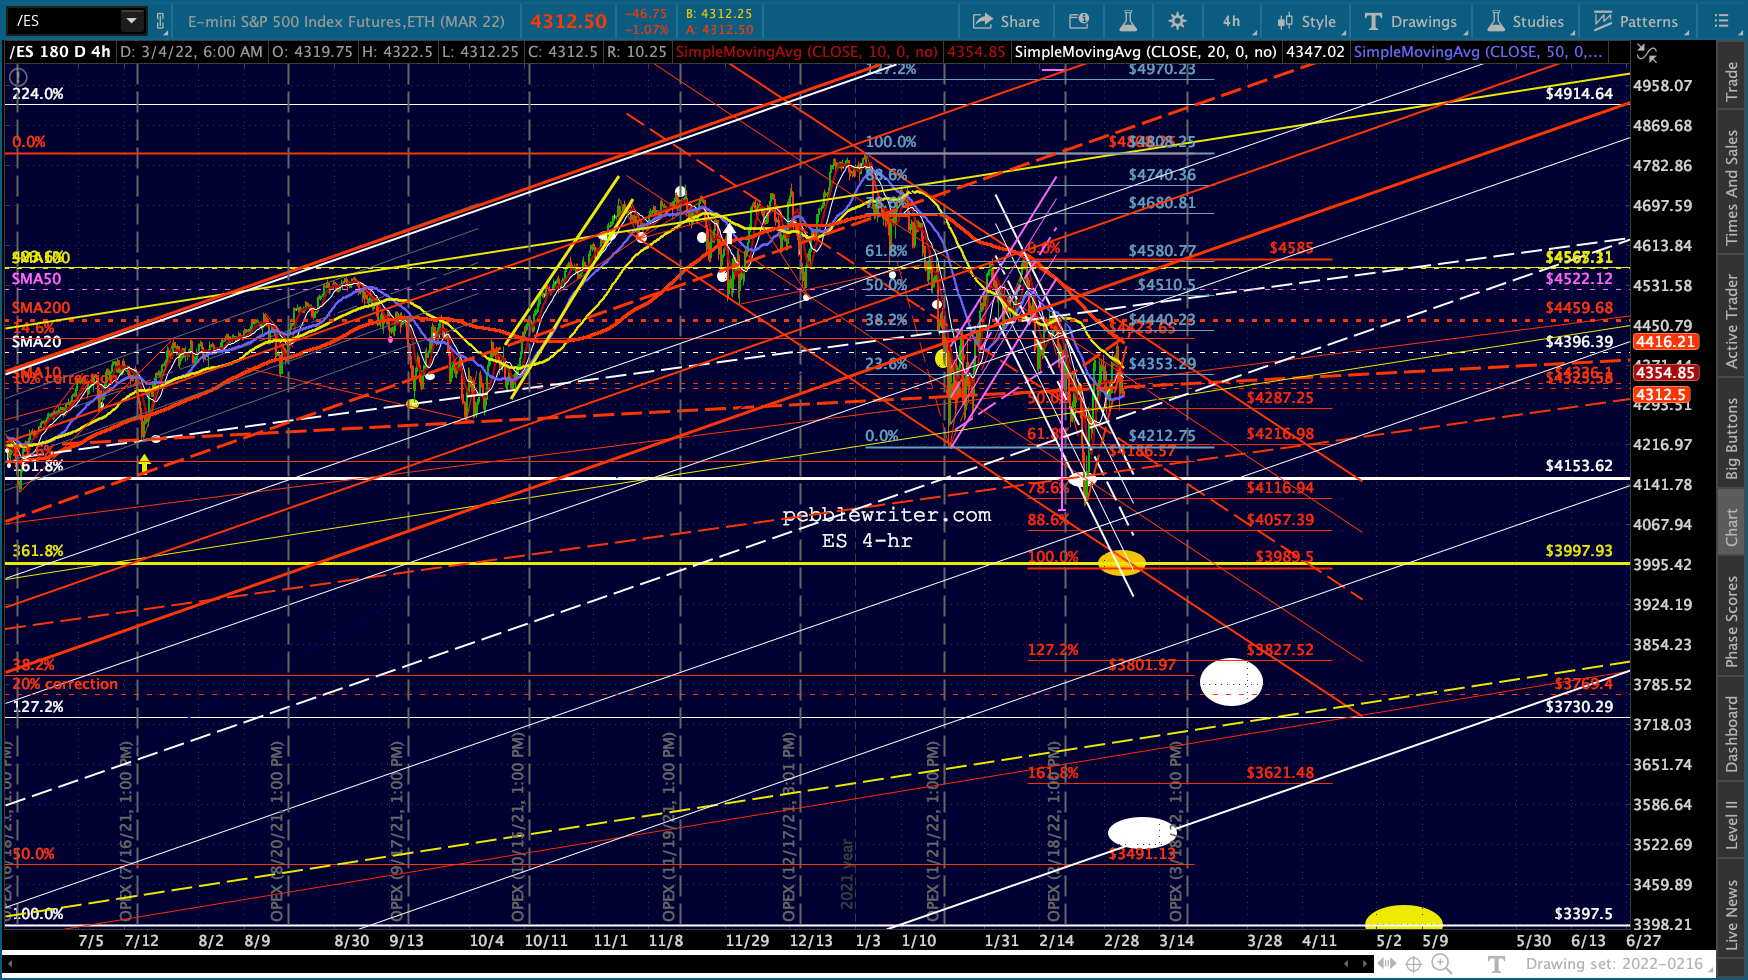
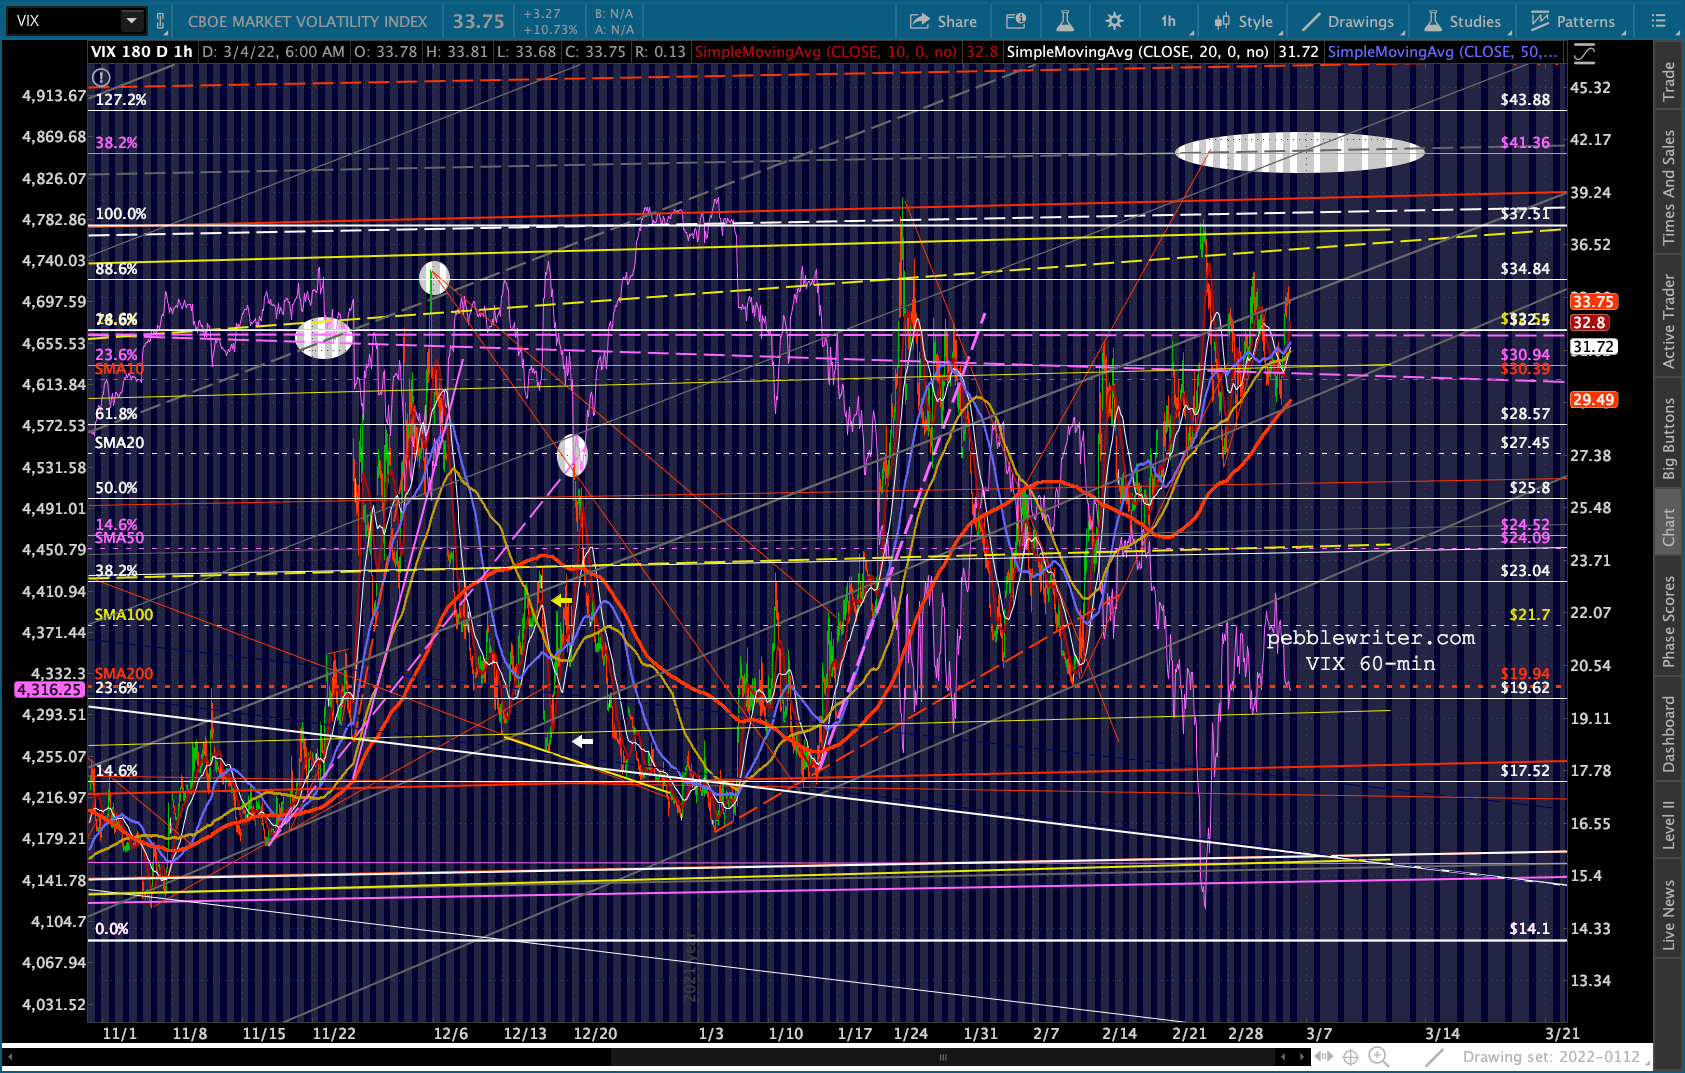
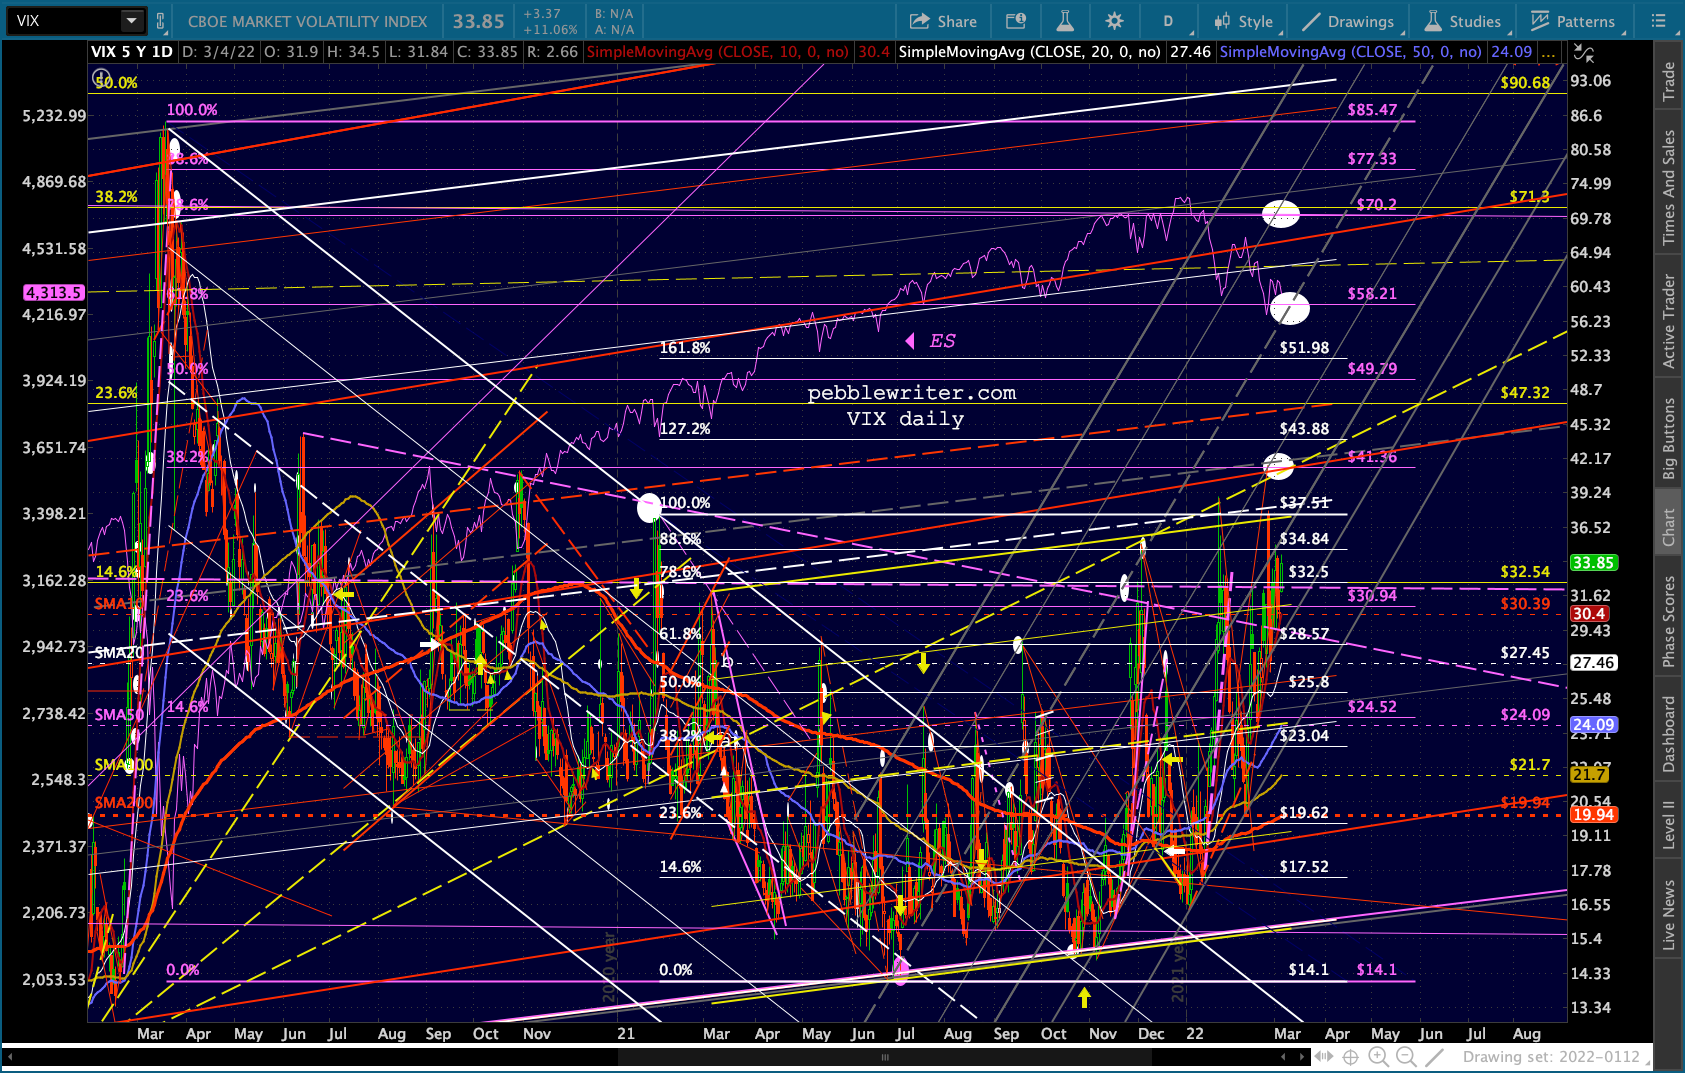
continued for members…A quick peek of the equity markets shows that the triangle has broken down and ES is once again below the SMA10.
 Back to currencies…
The situation in Ukraine continues to worsen. It is hard to see a viable offramp for Putin that results in a peaceful resolution and Russia’s reentry into the world’s good graces. It’s therefore difficult to see oil prices coming back down due to market pressures (supply and demand.) Even if Iran’s oil starts flowing again, that’s potentially 3.8 million bpd versus Russia’s 5 million.
Russia’s attack on the Zaporizhzhia nuclear power plant is obviously troublesome in many regards. IMO, it signals that Putin is dangerously unhinged and has no concern regarding global condemnation. But, it could also signal a more dangerous turn in the war, one in which Putin lays waste to broad swaths of Ukraine in order to create a more formidable buffer around Russia’s western flank.
At the very least, the defeat and occupation of Ukraine would increase the threat to the rest of Europe, thus requiring a significant increase in defense expenditures. NATO members in the EU spend an average of 1.7% of annual GDP. It’s not difficult to imagine this amount growing by 0.5% in the near future.
And, then, there’s the increased cost of fuel – the same factor which has caused US inflation to spike higher. Higher fuel prices in dollar terms are even worse in euro terms when the euro is falling the way it is.
Although inflation isn’t low in the eurozone, at 5.8% it is significantly lower than in the US. In light of the Ukraine situation, this is likely to change very soon. It has already broken out relative to the past 30 years…
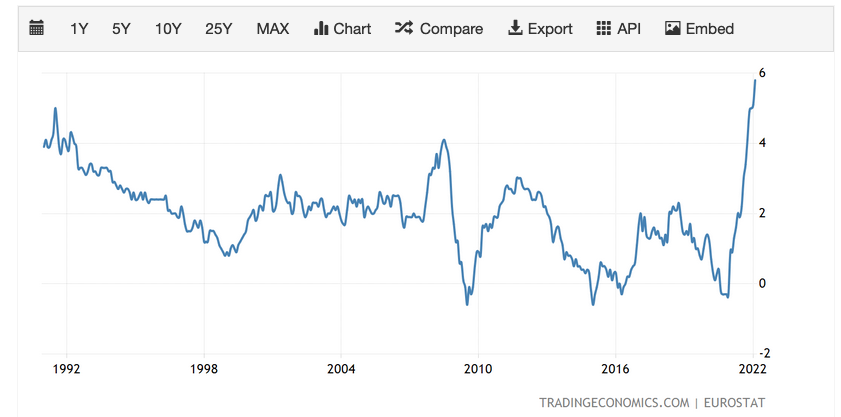 …though nowhere near where it has been in the past. As in the US, interest rates have acted as though there is no inflation whatsoever.
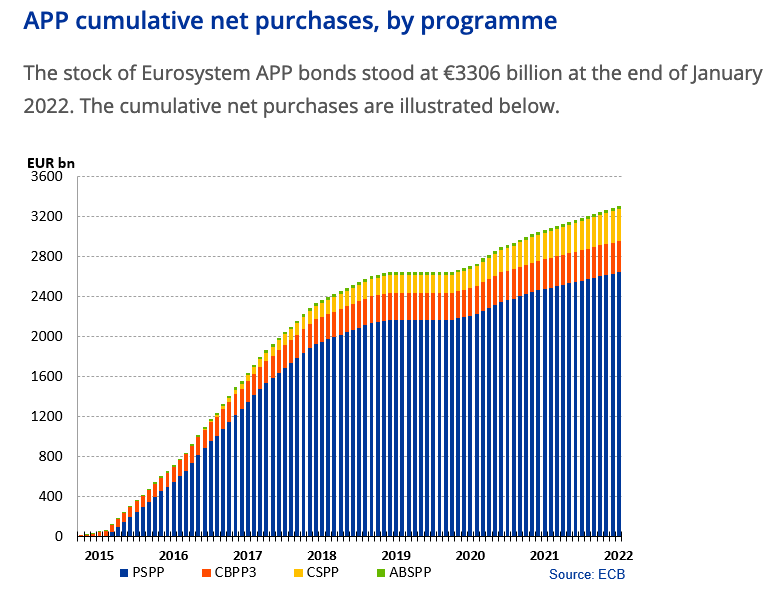
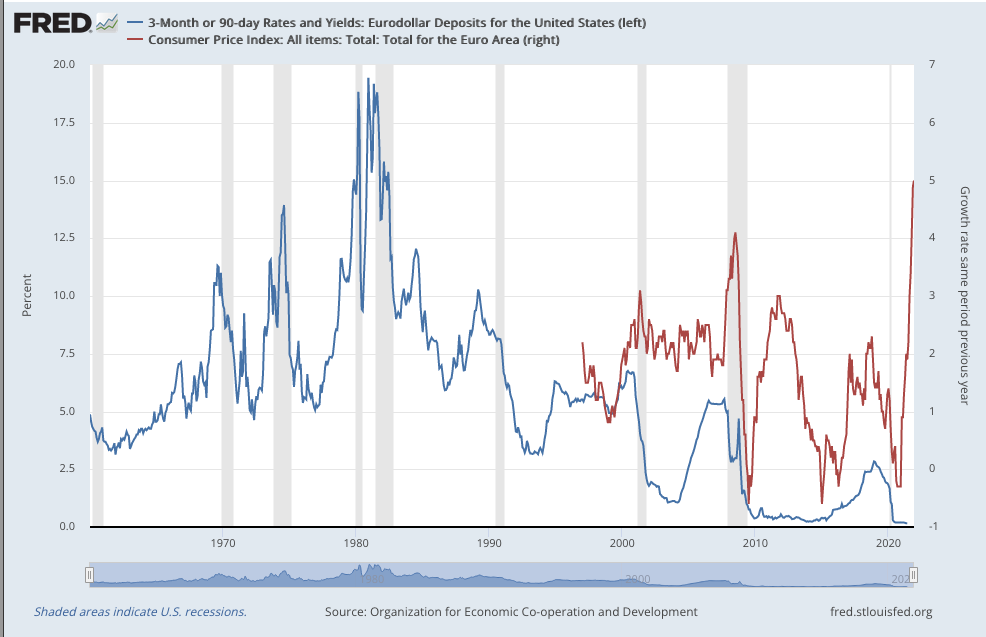 A few months ago, countries in the eurozone began raising interest rates slightly. This has likely already come to a screeching halt, and we are likely to see balance sheets continue to grow at whatever pace is necessary to keep rates near zero. Given the pressures from rising oil prices and increased defense expenditures, I think the growth will accelerate.
 As a result, I think it’s finally time we saw the white channel break down. Note that the yellow H&S pattern (the second, from 2003-2014) backtested in early 2018 but has yet to play out – forming an extended flag pattern instead.
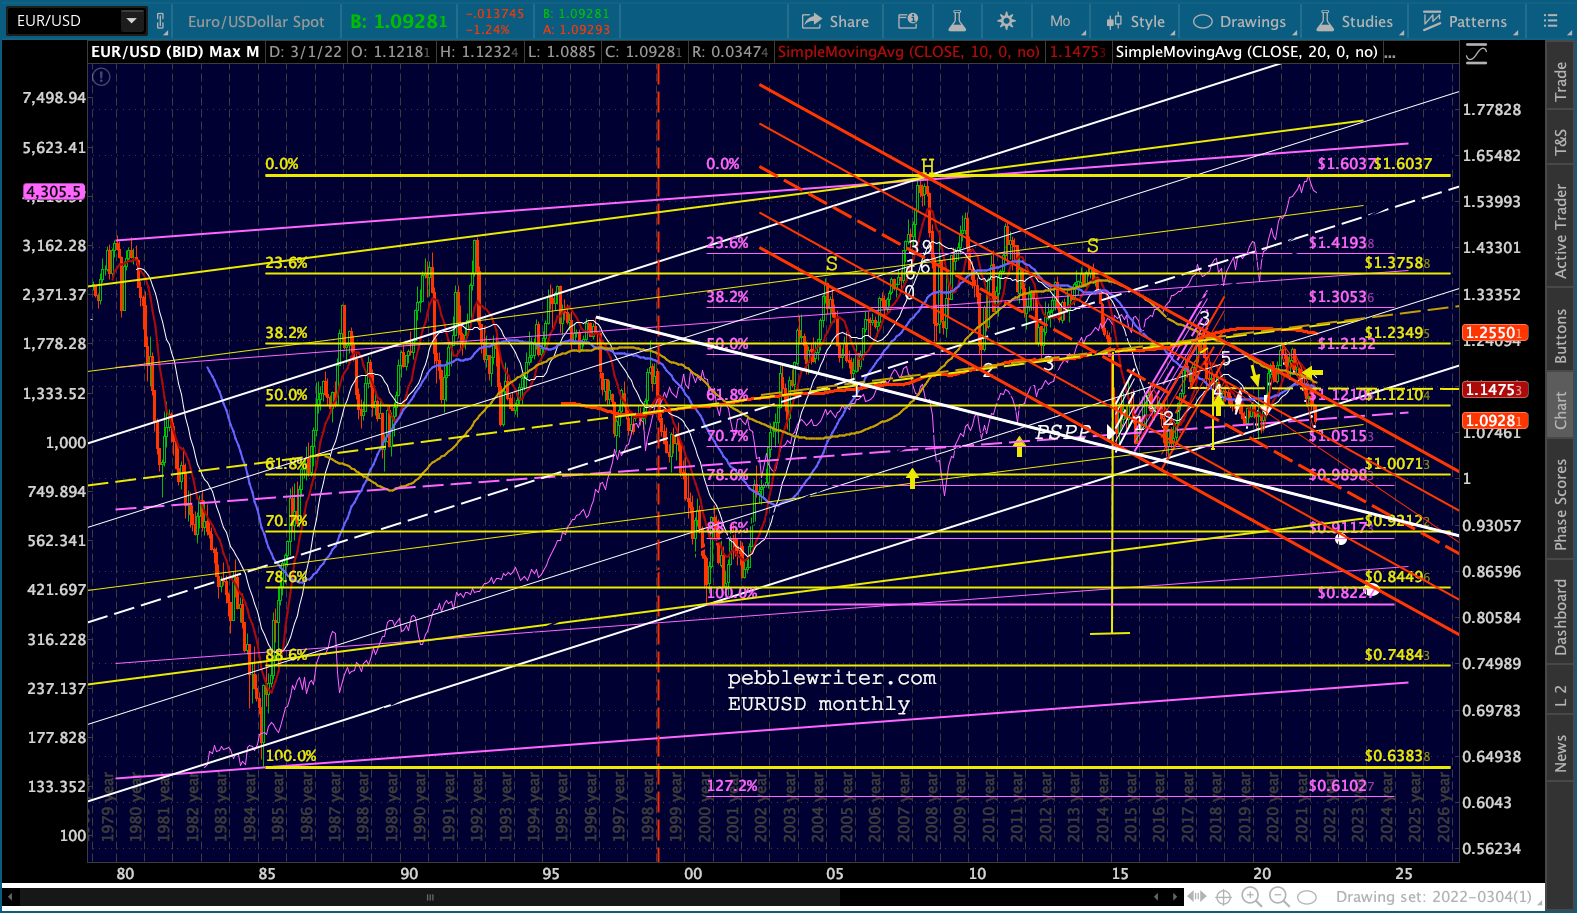 There are many potential targets between here and the H&S target of .785. The first is the 1.06 lows from 2020, followed by the 1.03 lows from 2016. Once those break down, of course, the euro will face the 1.000 support, also the yellow .618, possibly as early as mid-March. This could be exacerbated, of course, if the Fed hikes by 50 instead of 25 bps. I don’t think they will.
 A breakdown in the euro would mean a break-back-in in the DXY – especially if the Fed takes extraordinary steps to rein in inflation. For the past six months or so, we’ve been calling for a backtest of the broken purple channel.
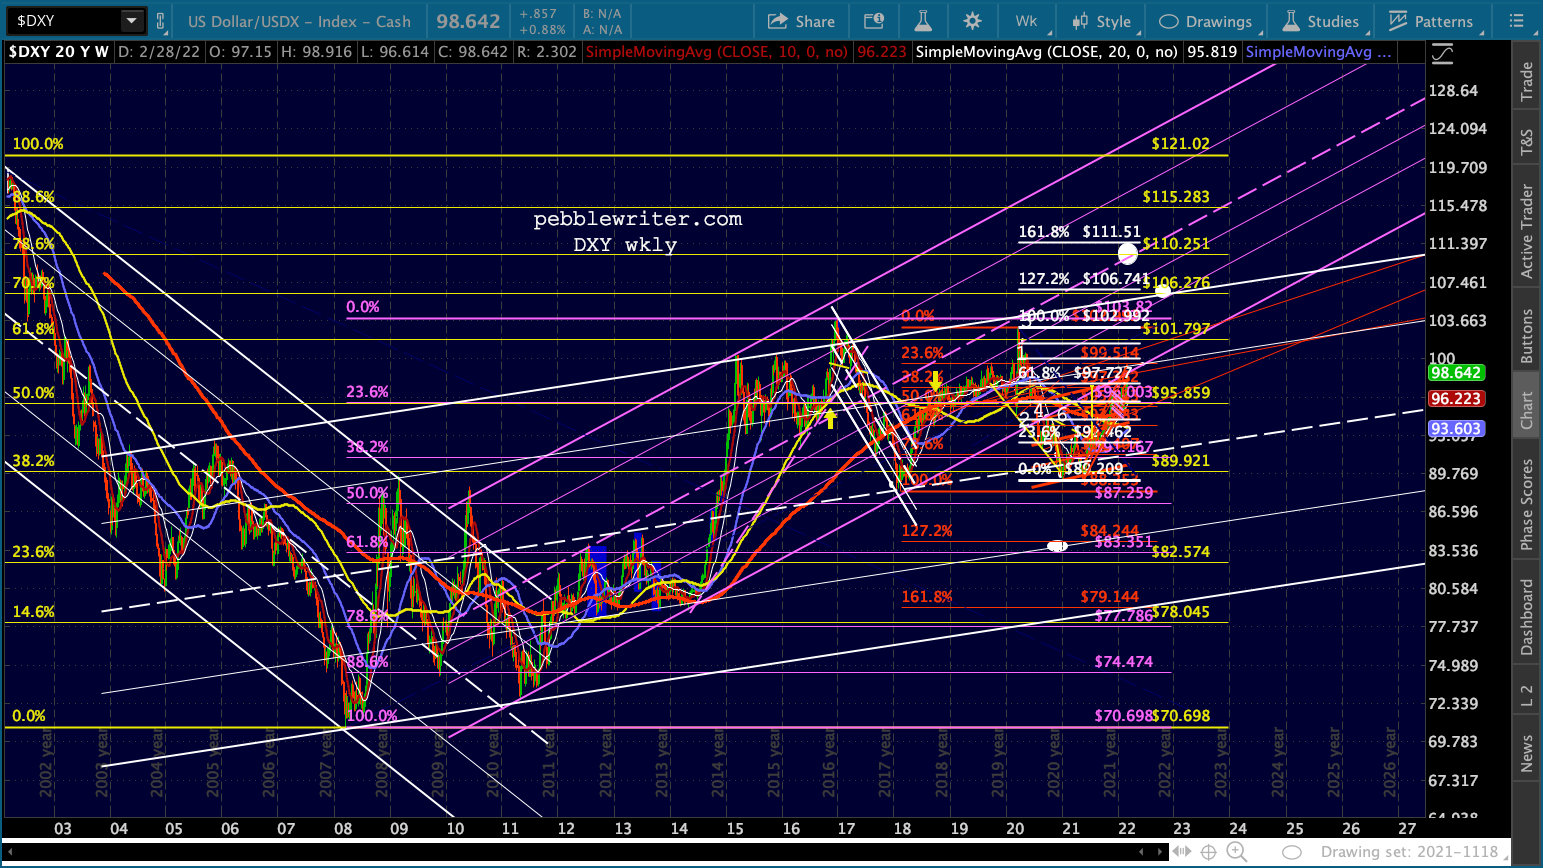
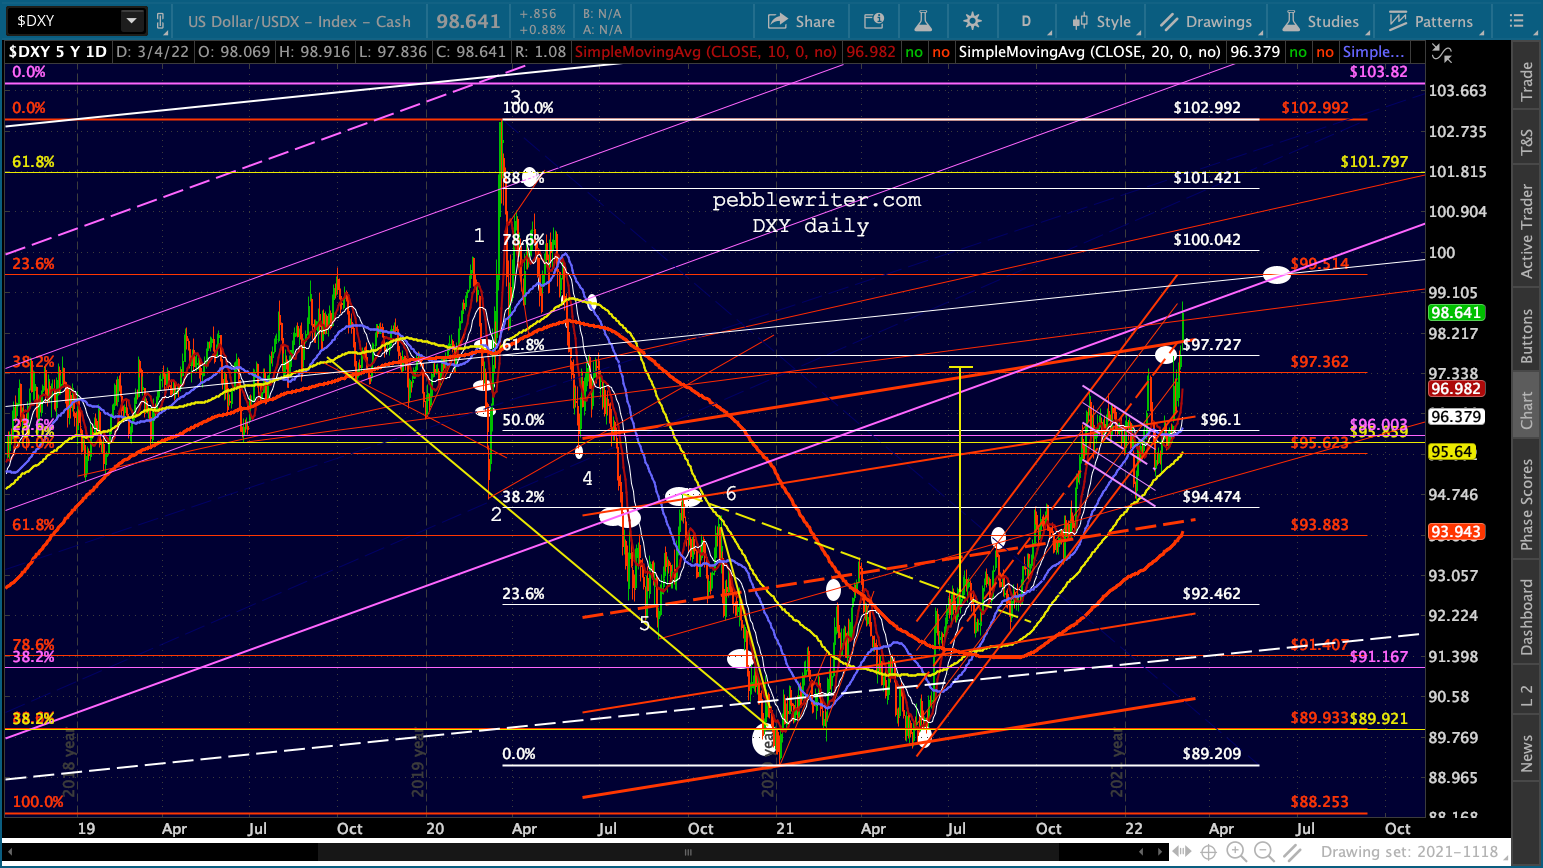 Odds are, this is too conservative a call. Once it breaks back in to the rising purple channel, it almost immediately runs into the rising white channel top at anywhere from 103-106.7. If/when it breads out of the rising white channel, it will face resistance from the purple channel midline at around 110.25.
 Part II on Monday…