One of my favorite childhood memories was playing Gin Rummy with my grandfather who, whenever he caught me with way too many cards in my hand, gleefully cried out “timber!”
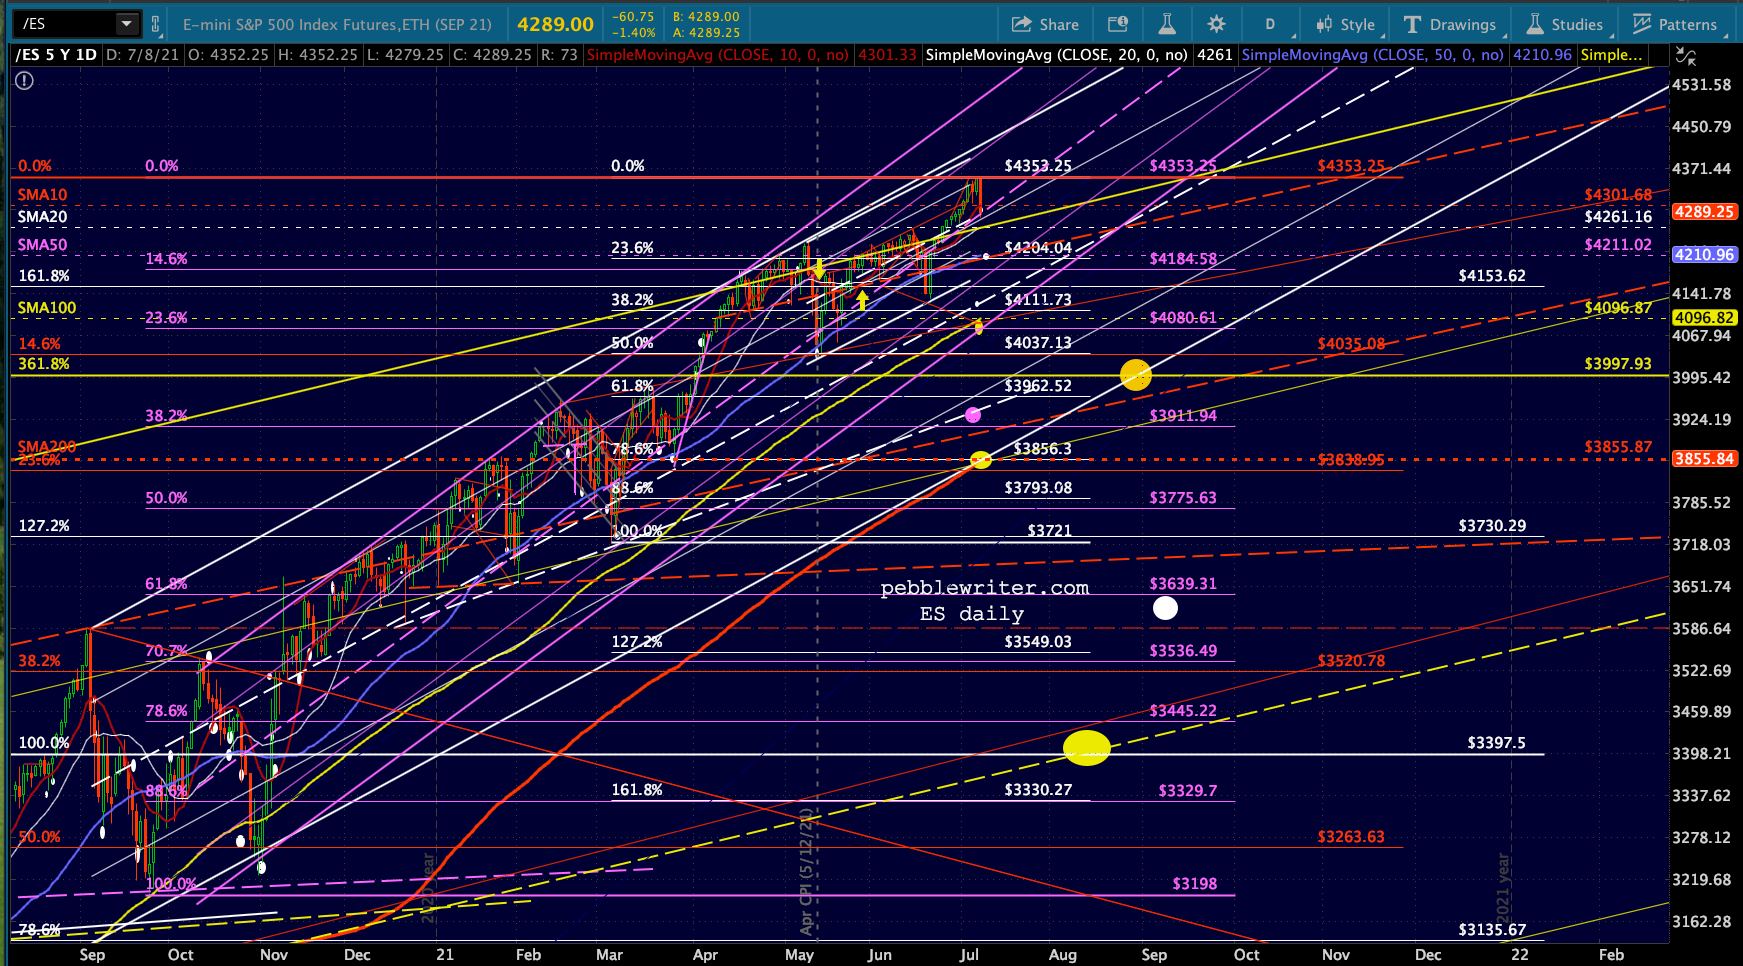
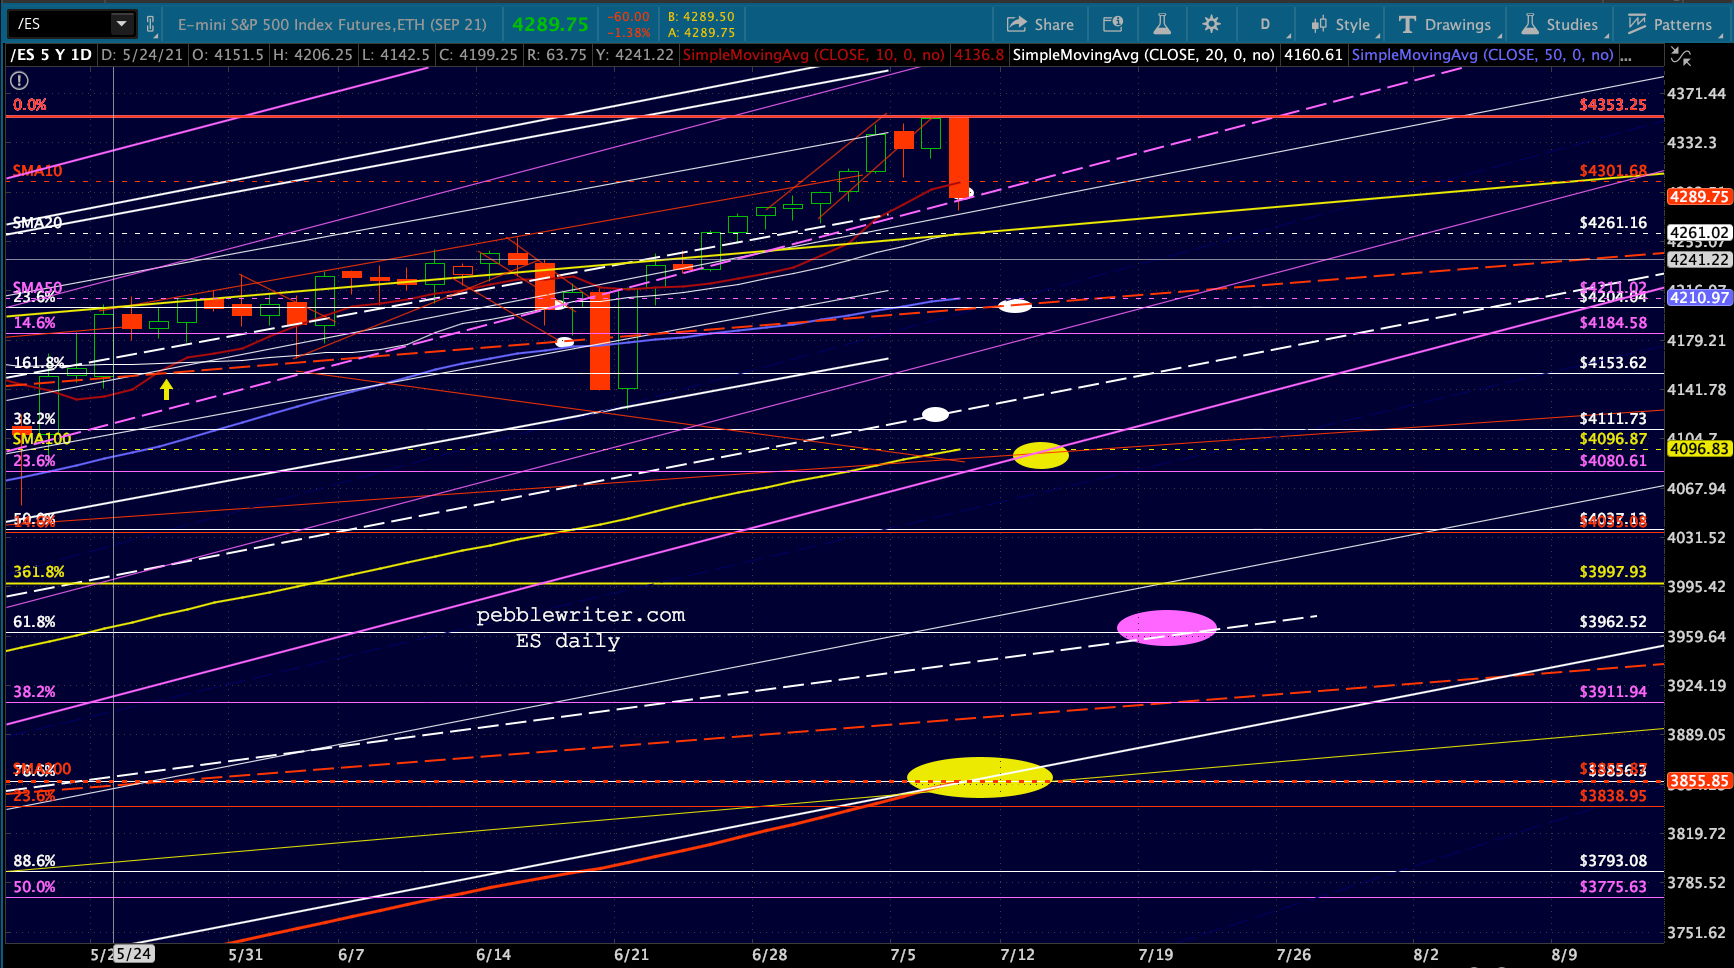
With seemingly everybody long equities and very few of them bothering with protection, this morning’s downturn has that kind of panicky feel. Sixty points on ES is a lot. The reality is it could be much more if some of the algo drivers currently hanging by a thread break down. Our favored targets are much lower.
I’m especially interested in the 10Y futures, which are nearing our upside target this morning…
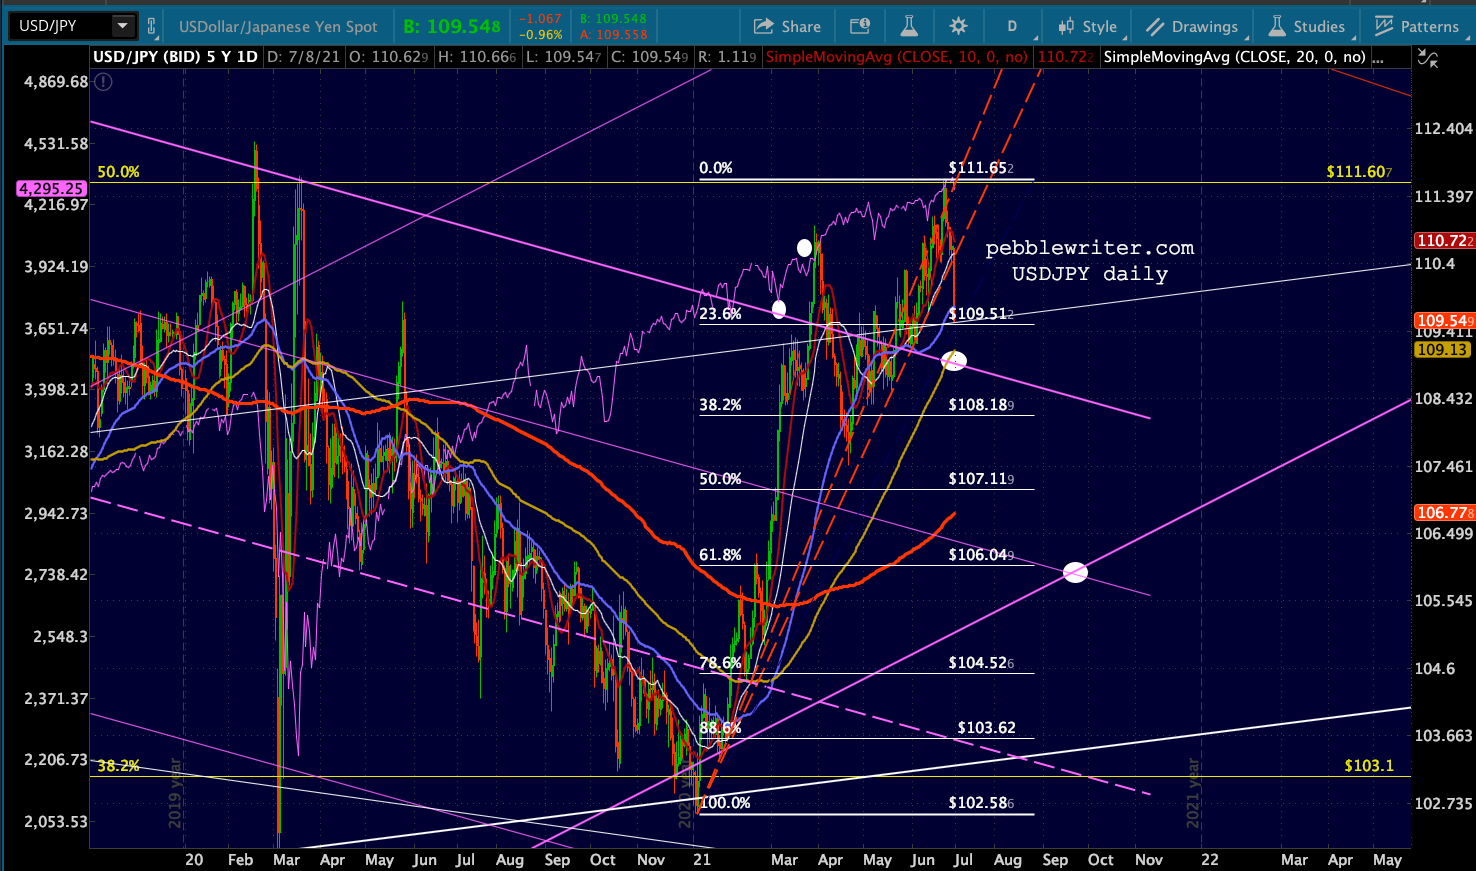
 …and USDJPY, which finally broke down after six months of central bank coordinated, stock-propping, ramp jobs.
 continued for members…
The equity picture: We might finally get some clarity on ES’ channel of choice.
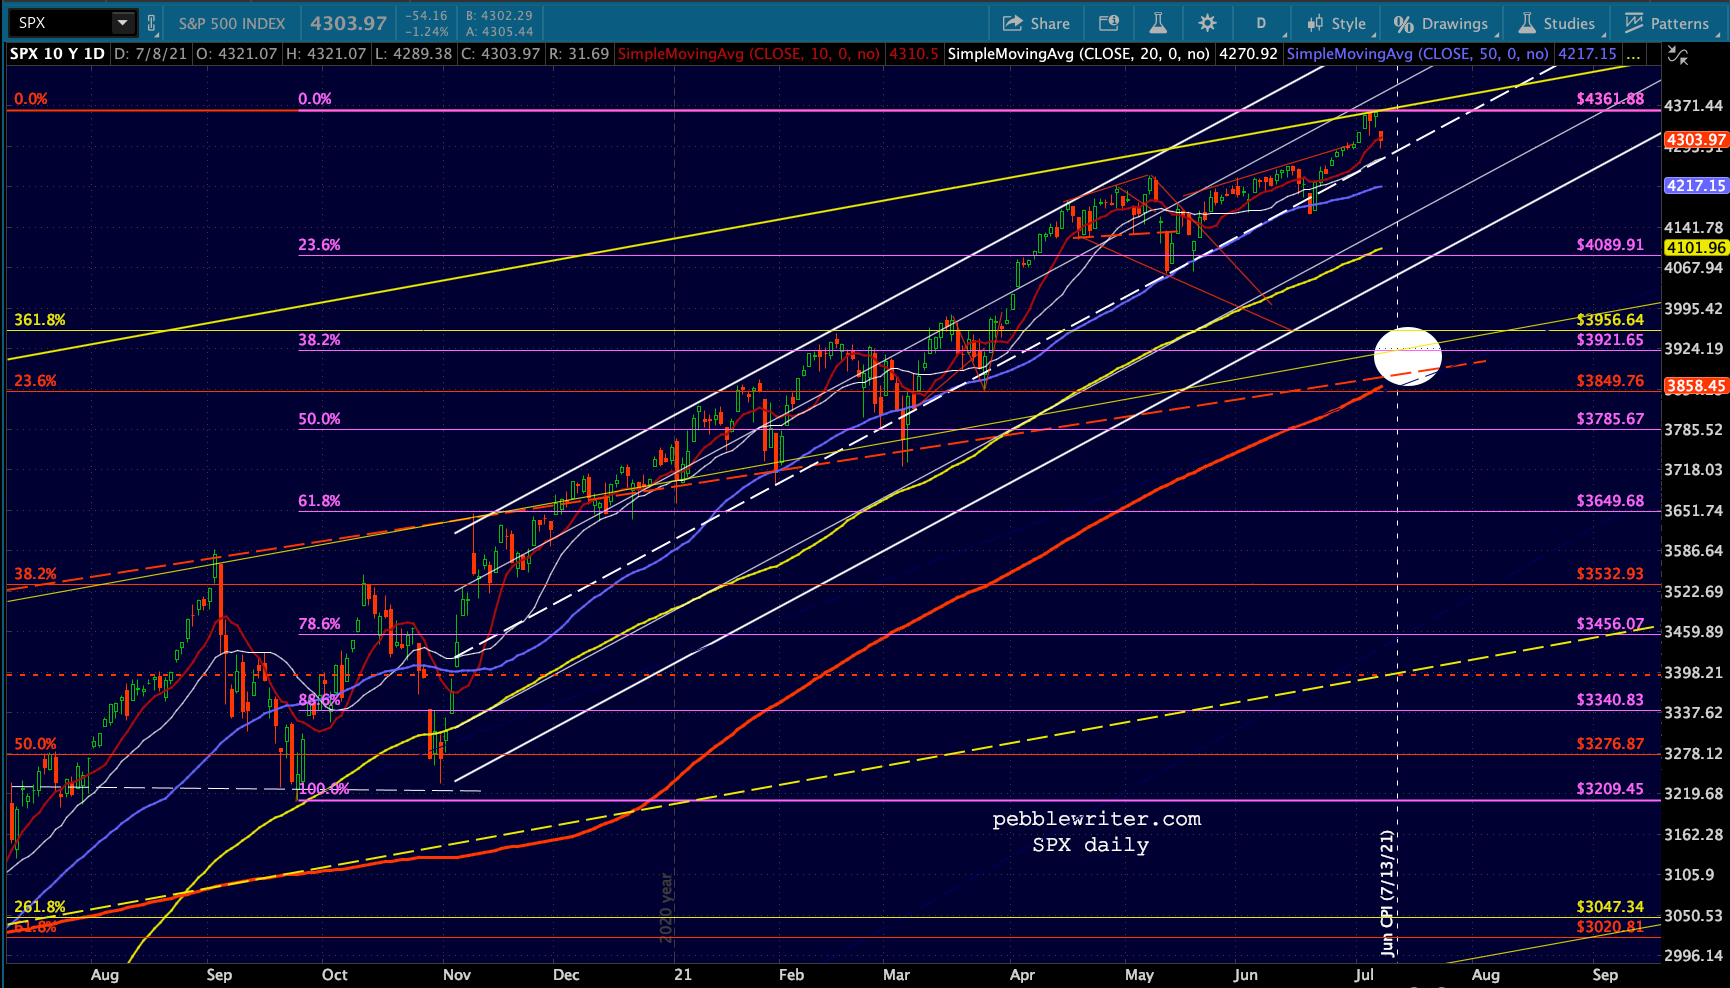
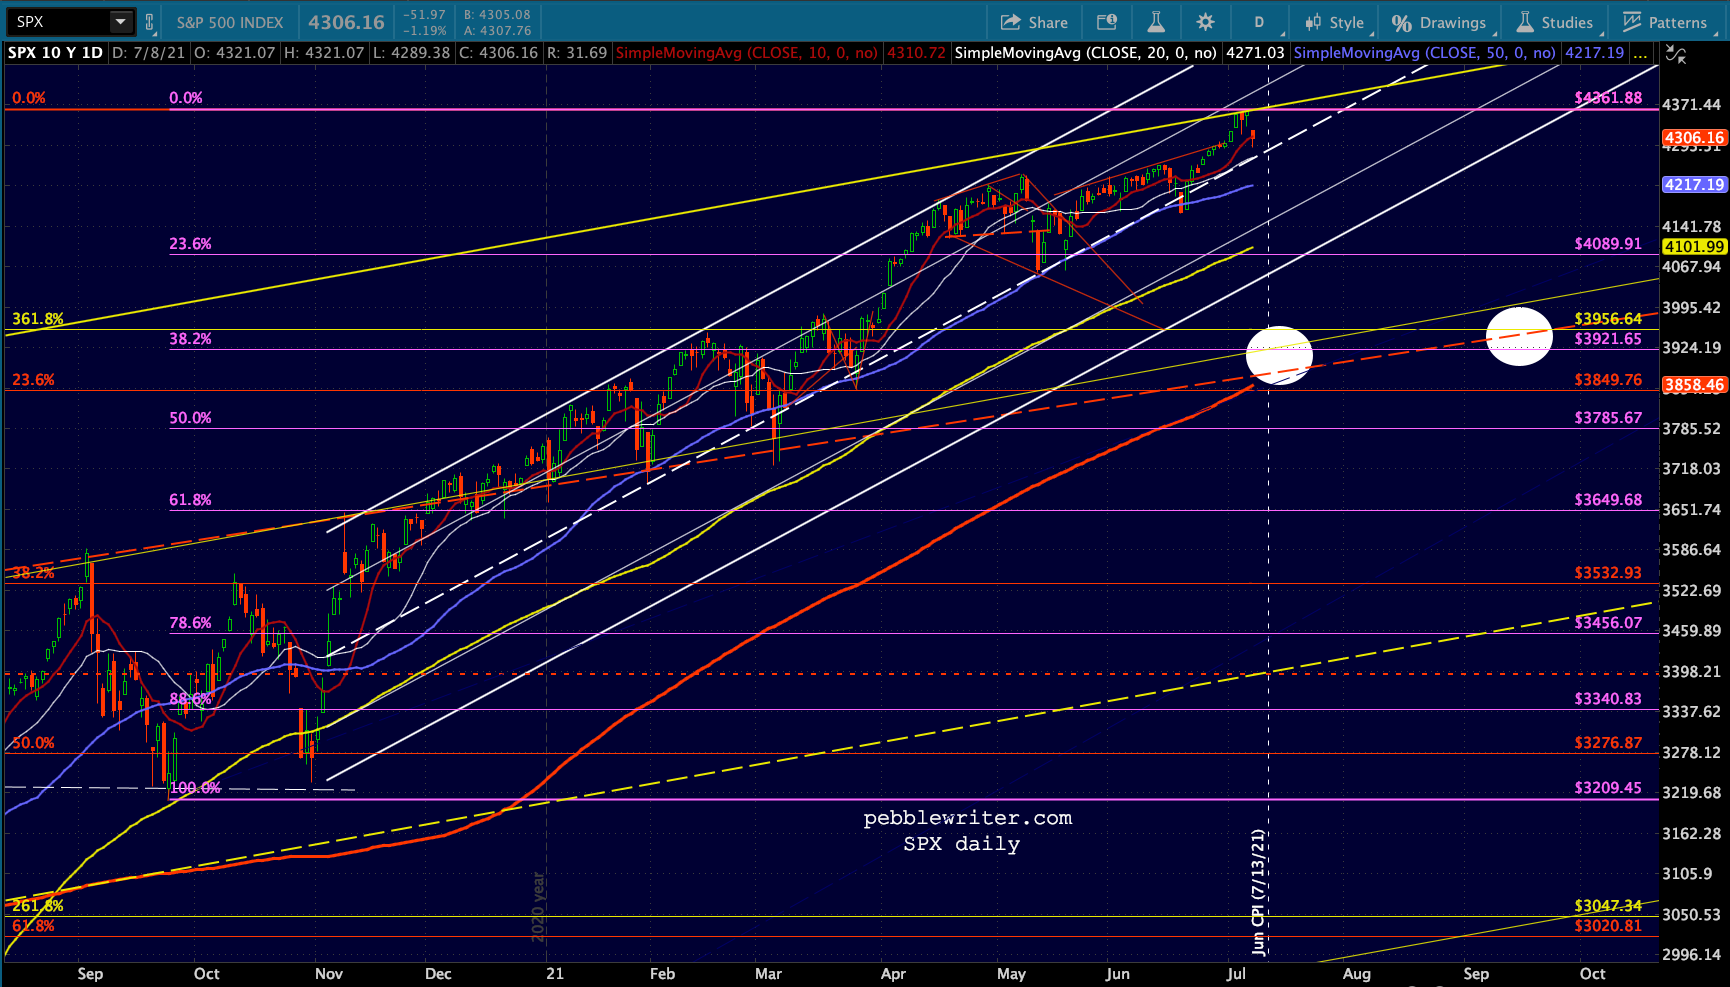
 I’ve tentatively reset SPX’s rising yellow channel to incorporate yesterday’s highs. Note that this also puts the Feb 2020 and Sep 2020 highs at the .786 channel line. The SMA200 should reach that same channel line where it intersects the 3.618 Fib at 3956.64 in early August.
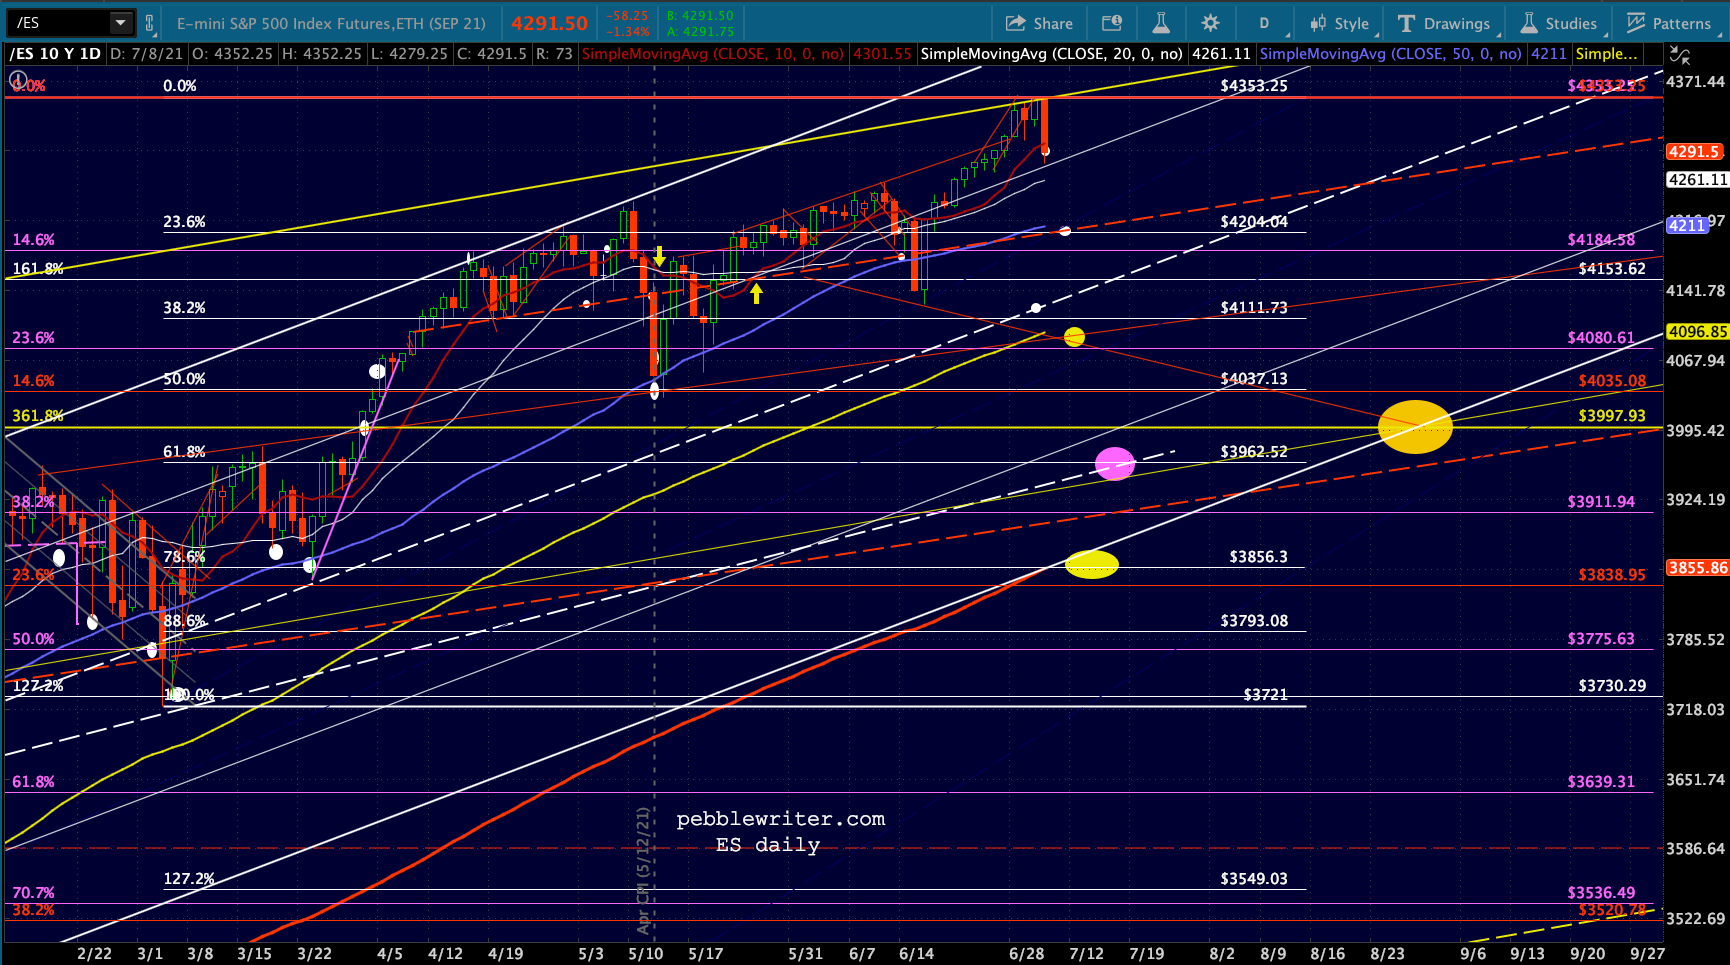
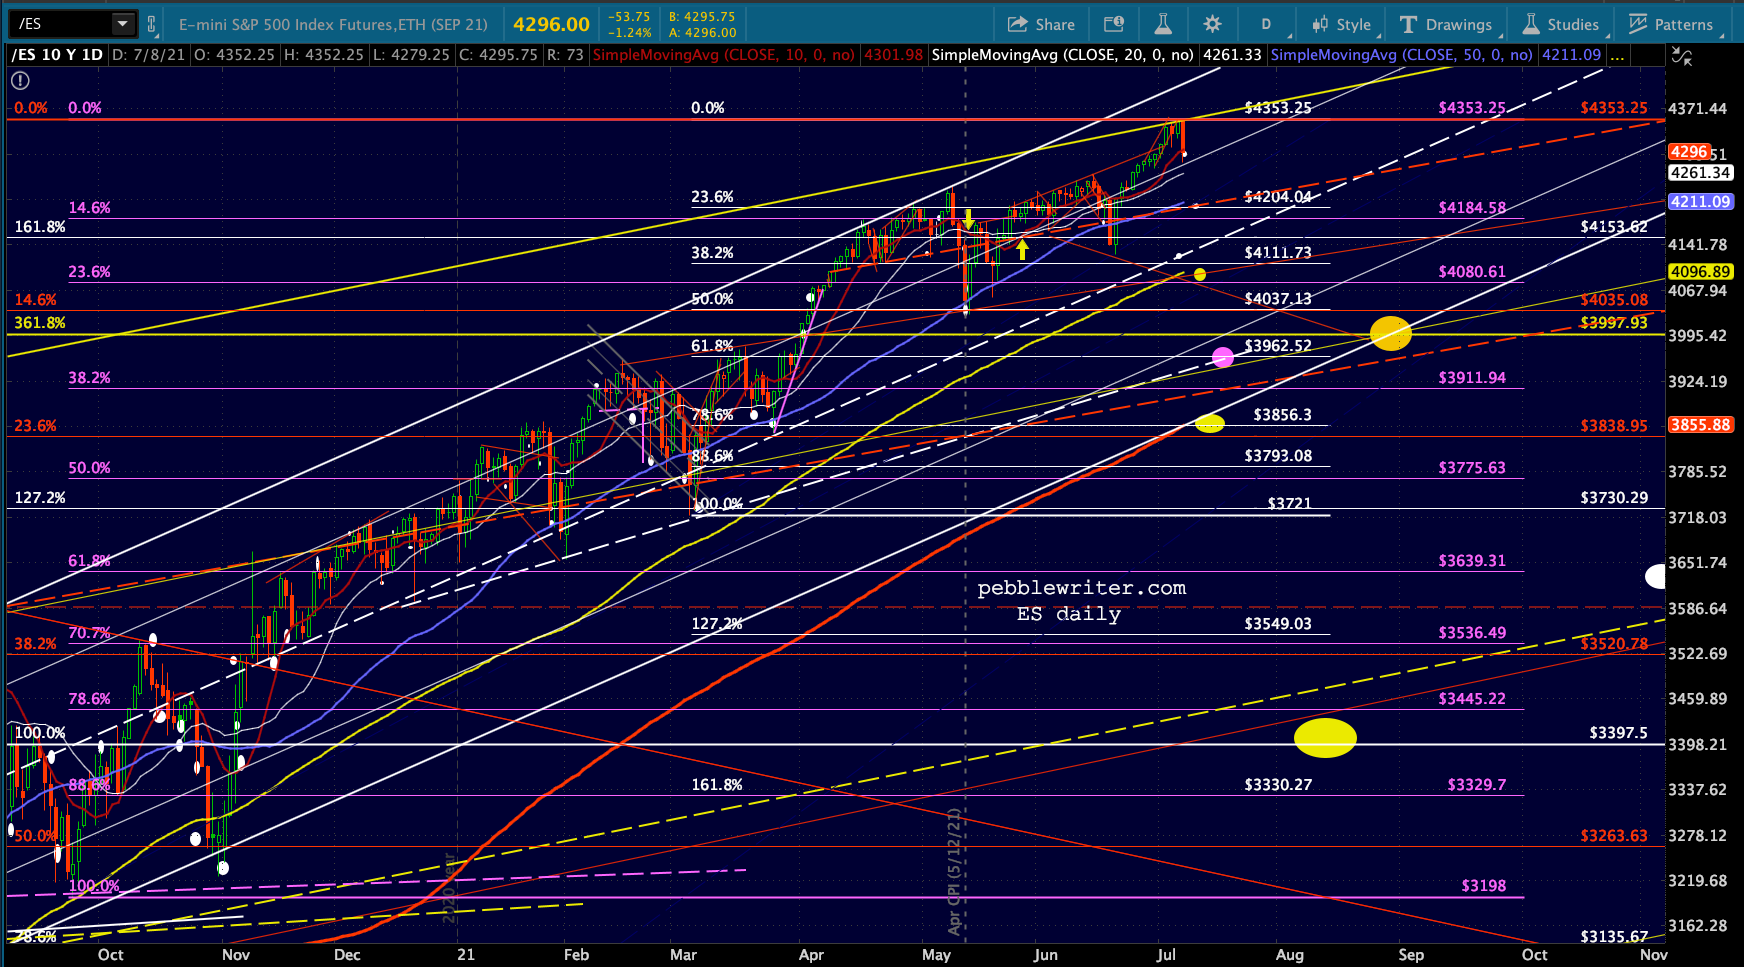
This would be a 9.2% drop from yesterday’s highs. A 10% drop would put it at 3925.69, so for now we’ll consider SPX 3925-3956 our most interesting downside target range. Note that this is very, very close to ES’ white .618 at 3962.52, which intersects with the white channel bottom around Aug 17 and, a scarier alternative, the white TL connecting the 12/21/20, 2/1/21 and 3/4/21 lows on July 20ish.
A 10% drop from ES’ high would be exactly 3918, pretty much in line with SPX’s 3.618 backtest.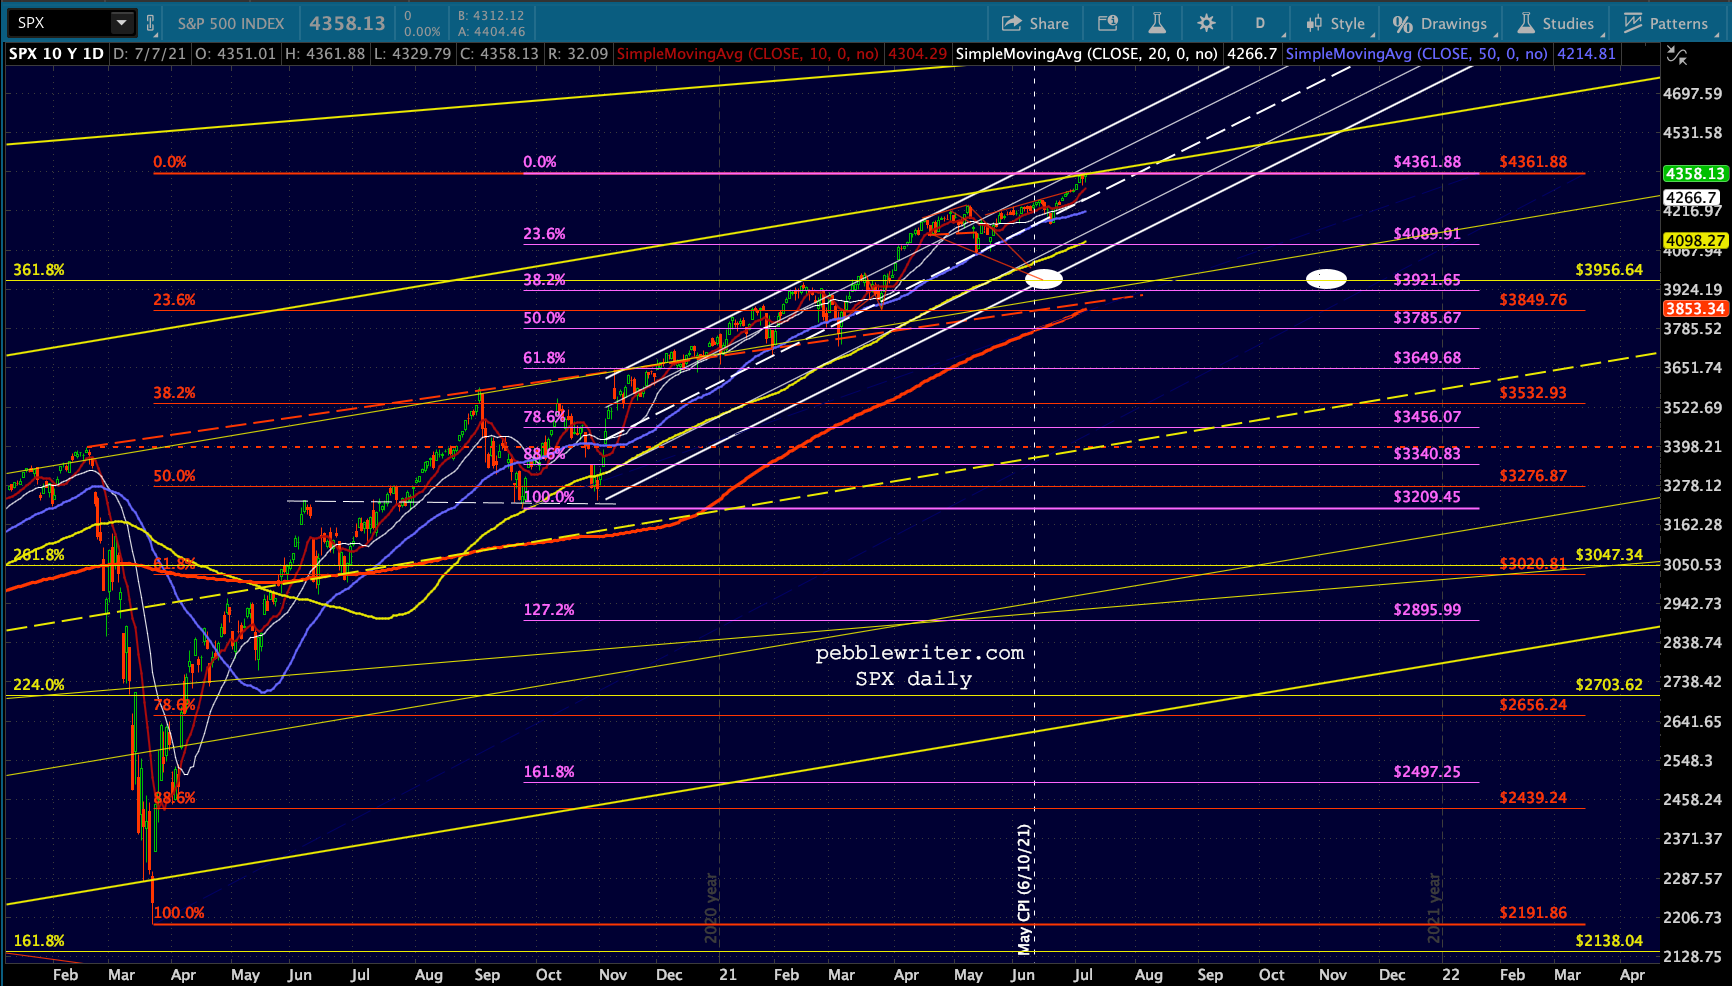
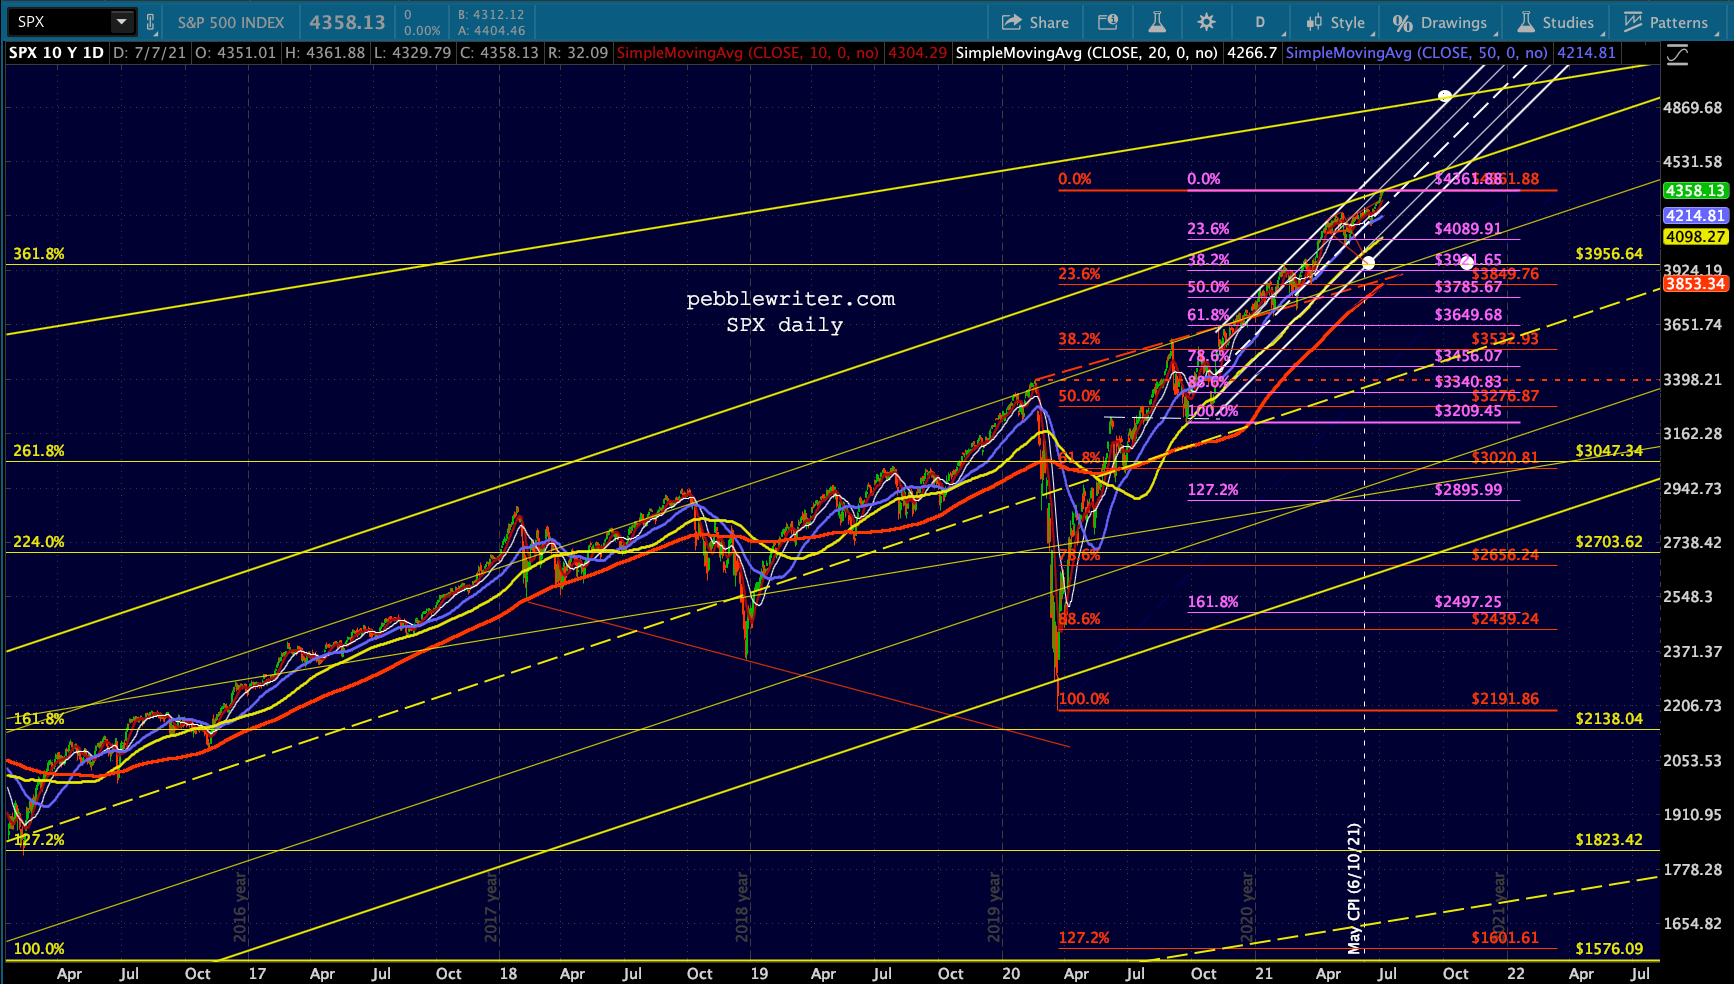 Here’s a cleaner view of both, with the quick, scary plunge and the less scary meander down to the 3.618 shown in each. As we discussed last week, backtesting the 3.618 now means SPX’s rising white channel would have to break down.
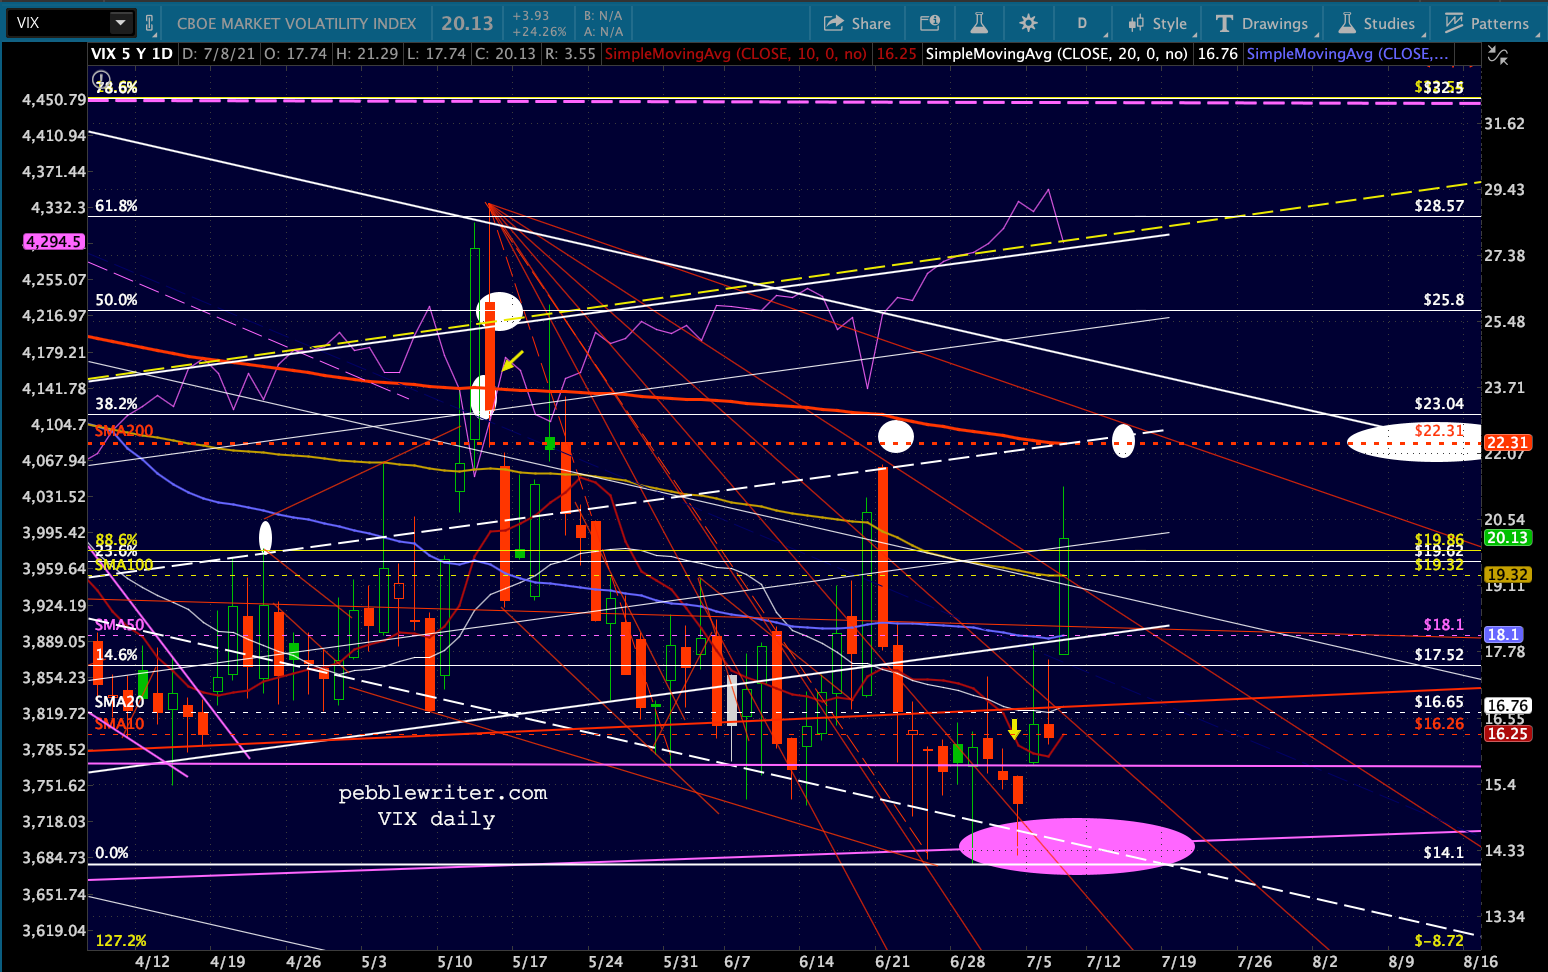
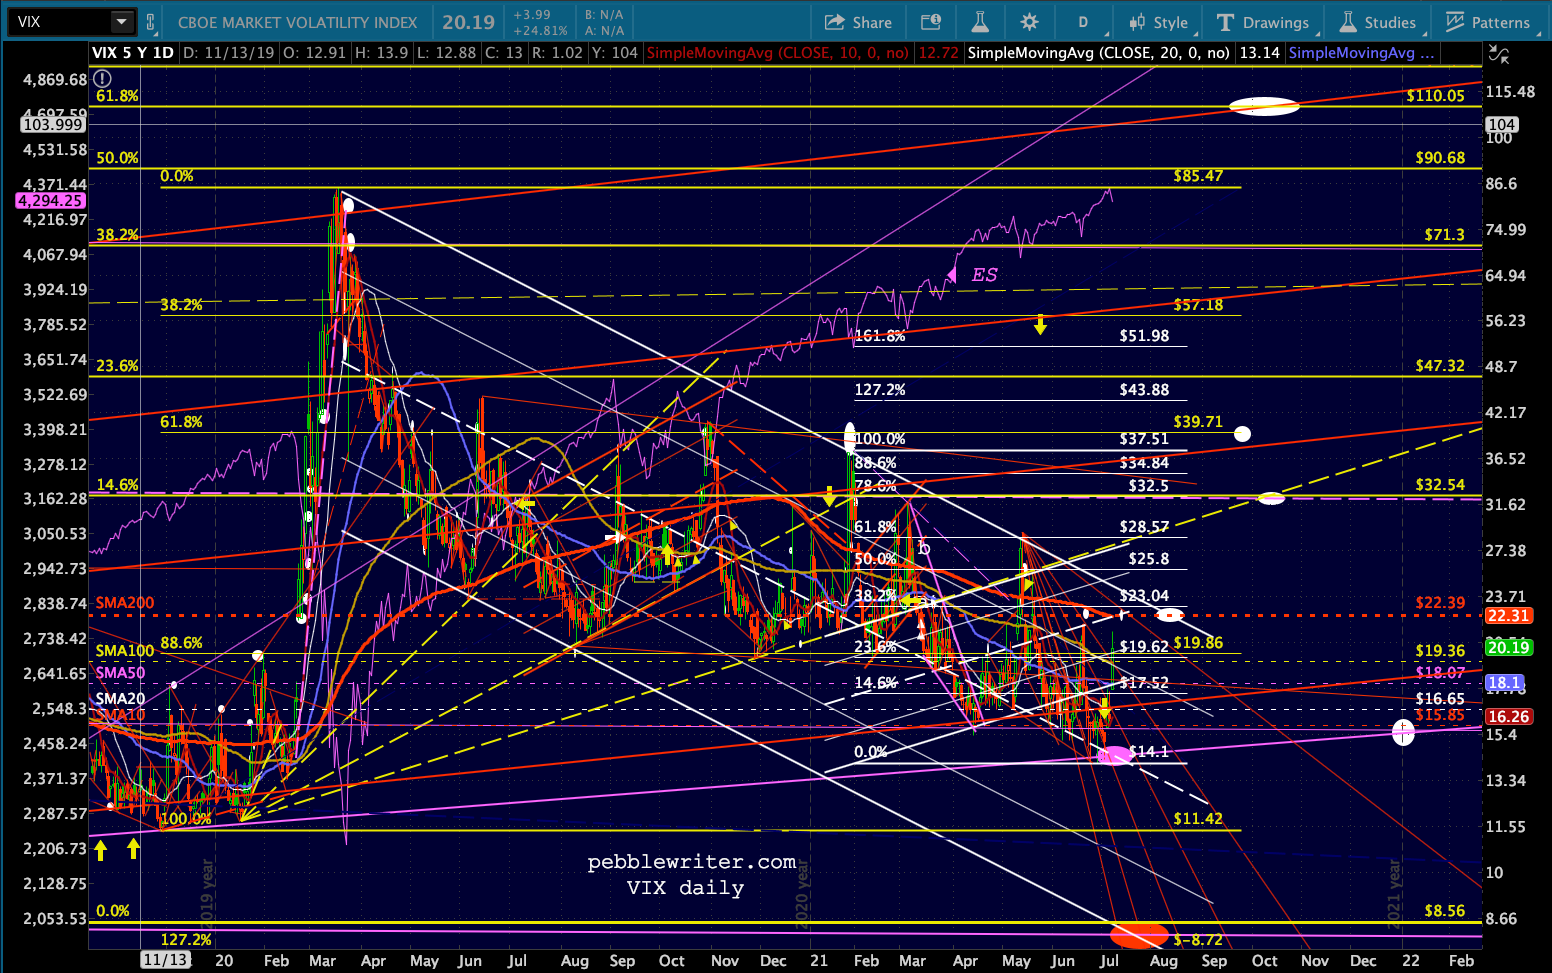
 VIX hasn’t gone too crazy just yet, though it certainly looks like it has potential to finally tag the SMA200 again. Note that a 10/20 cross isn’t all that far away.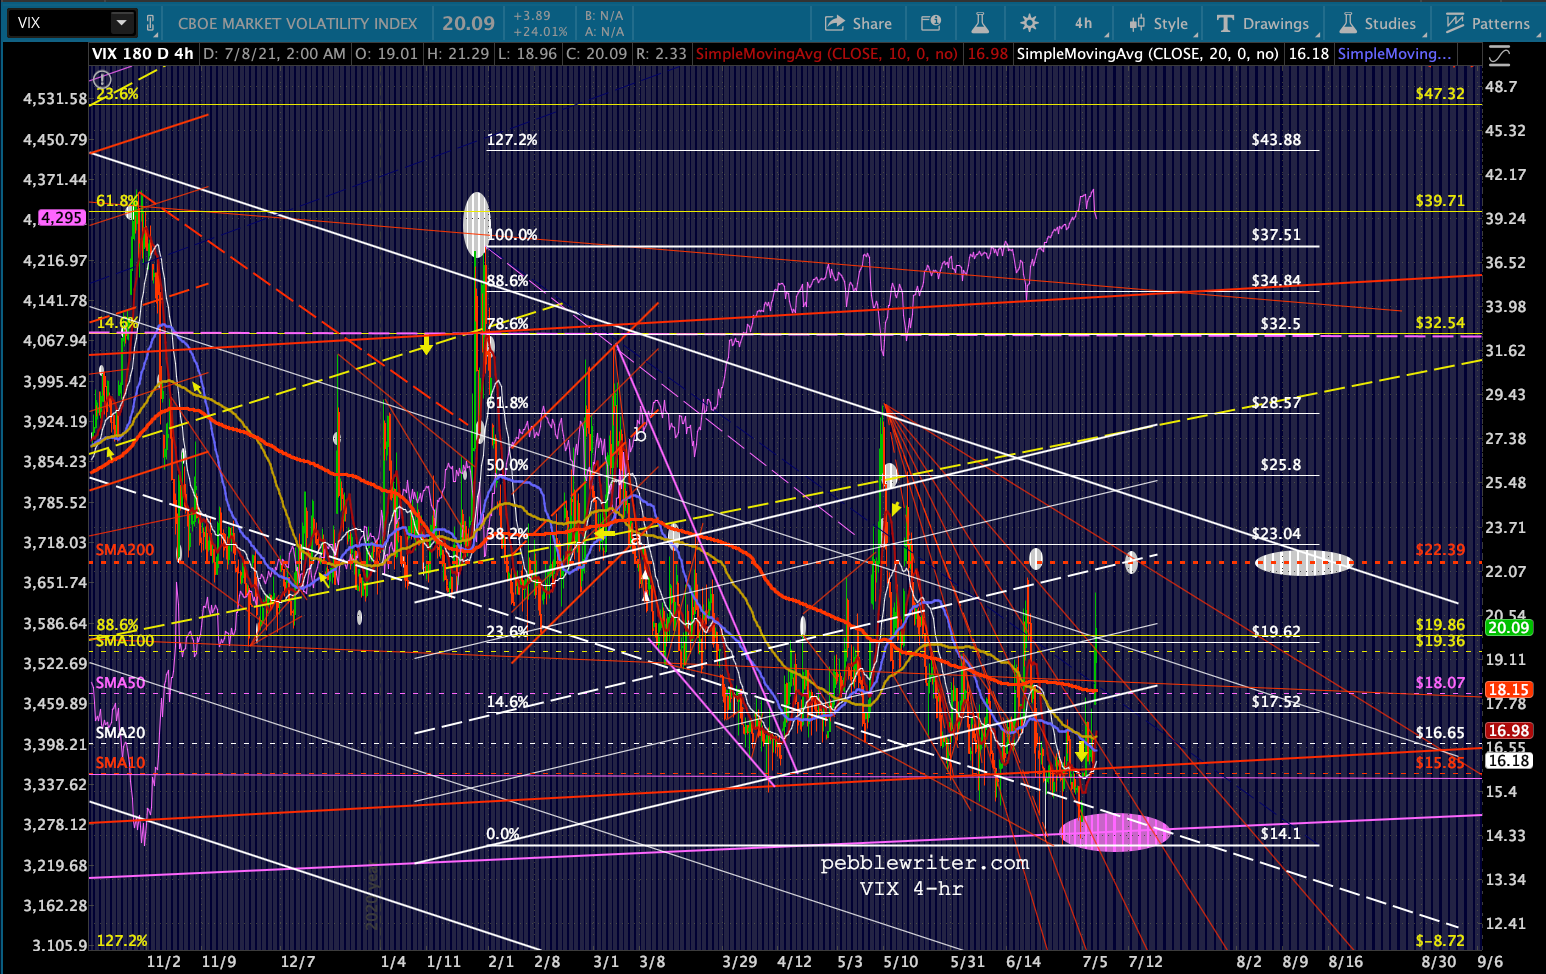
 The rest of our charts…
USDJPY is fast approaching a backtest of the purple channel it broke out of in May. If it bounces there where the SMA100 also is, that buys stocks some time. The SMA200 is rising rapidly. If it doesn’t bounce, stocks will be punished.
 EURUSD is getting some support, which is also supportive of stocks…
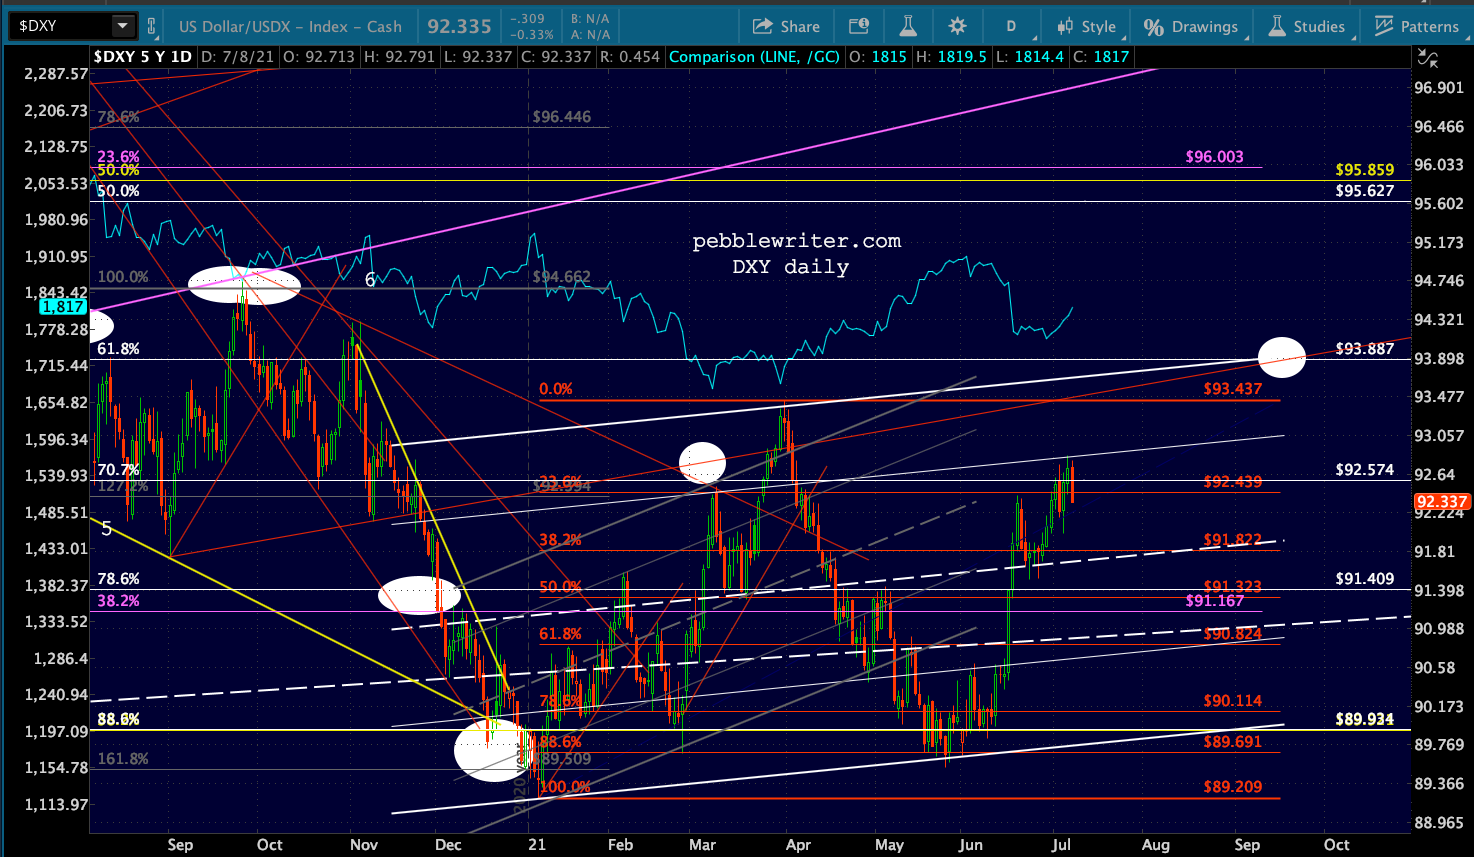
  …but I don’t expect DXY’s pullback to last.
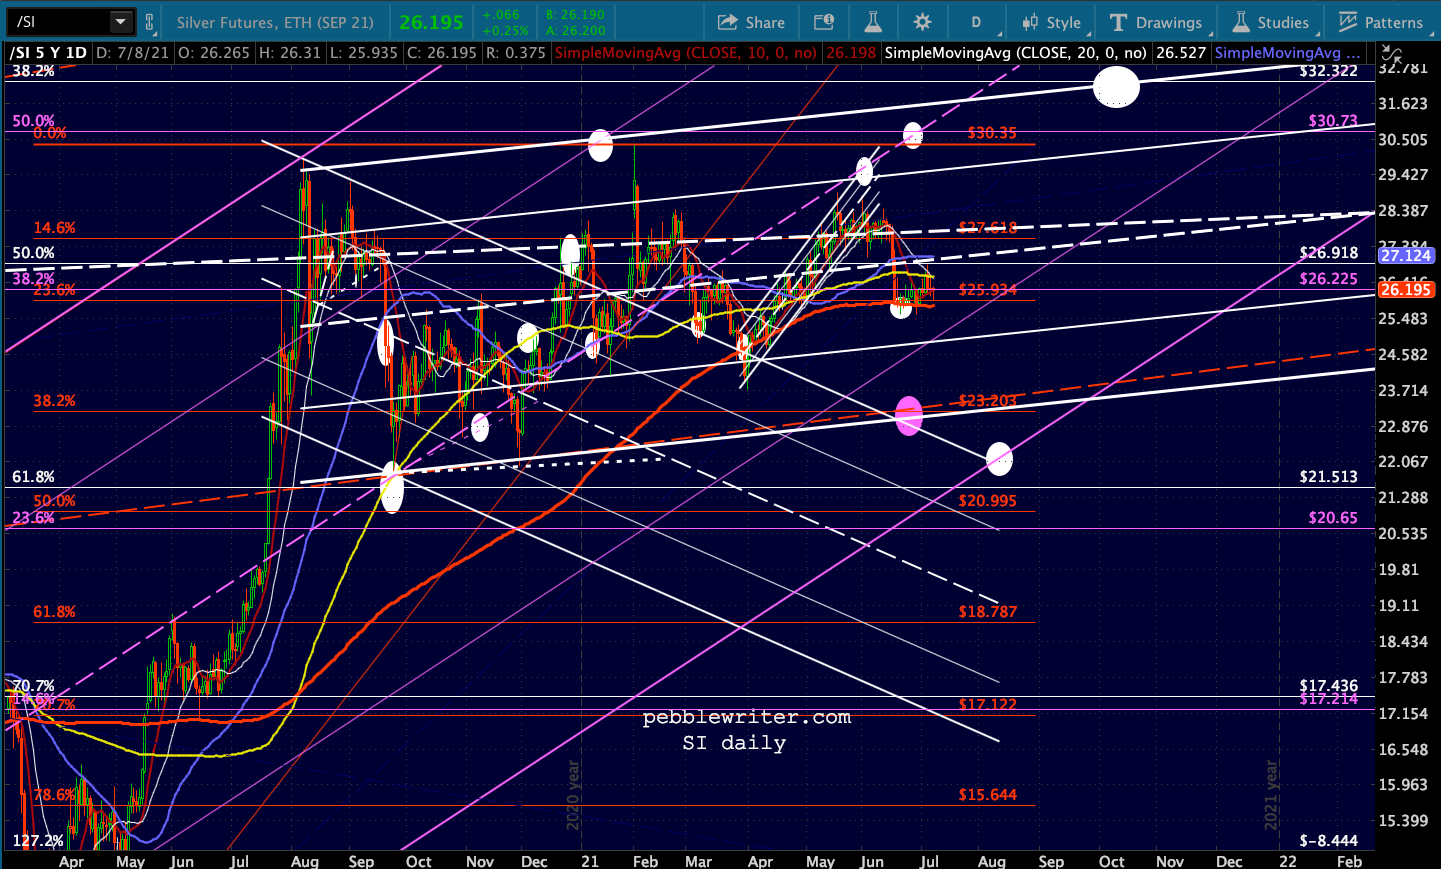
  Gold and silver are both also seeing support.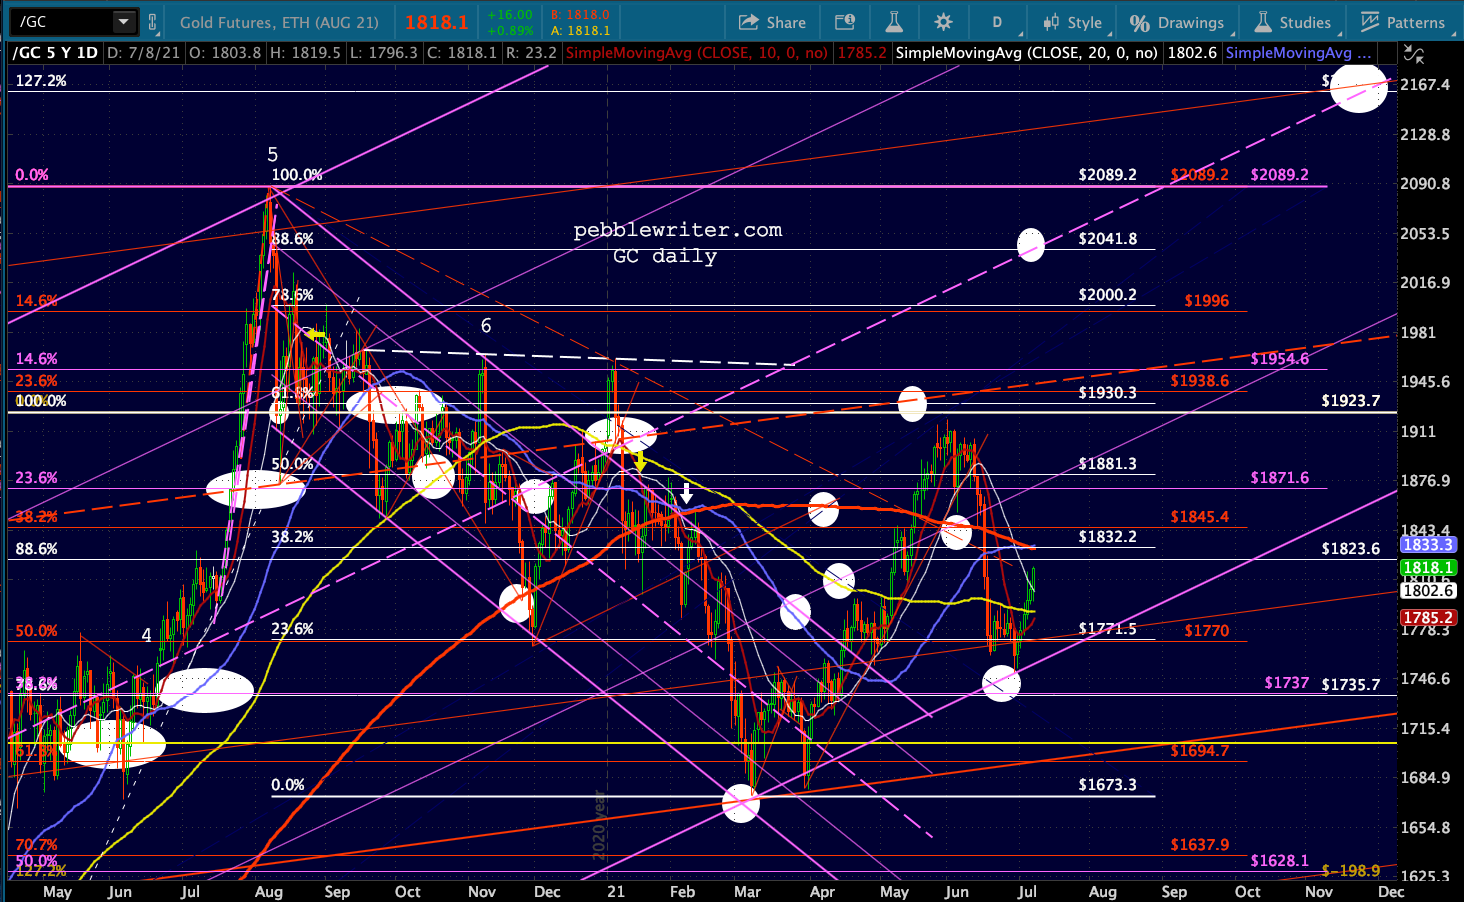
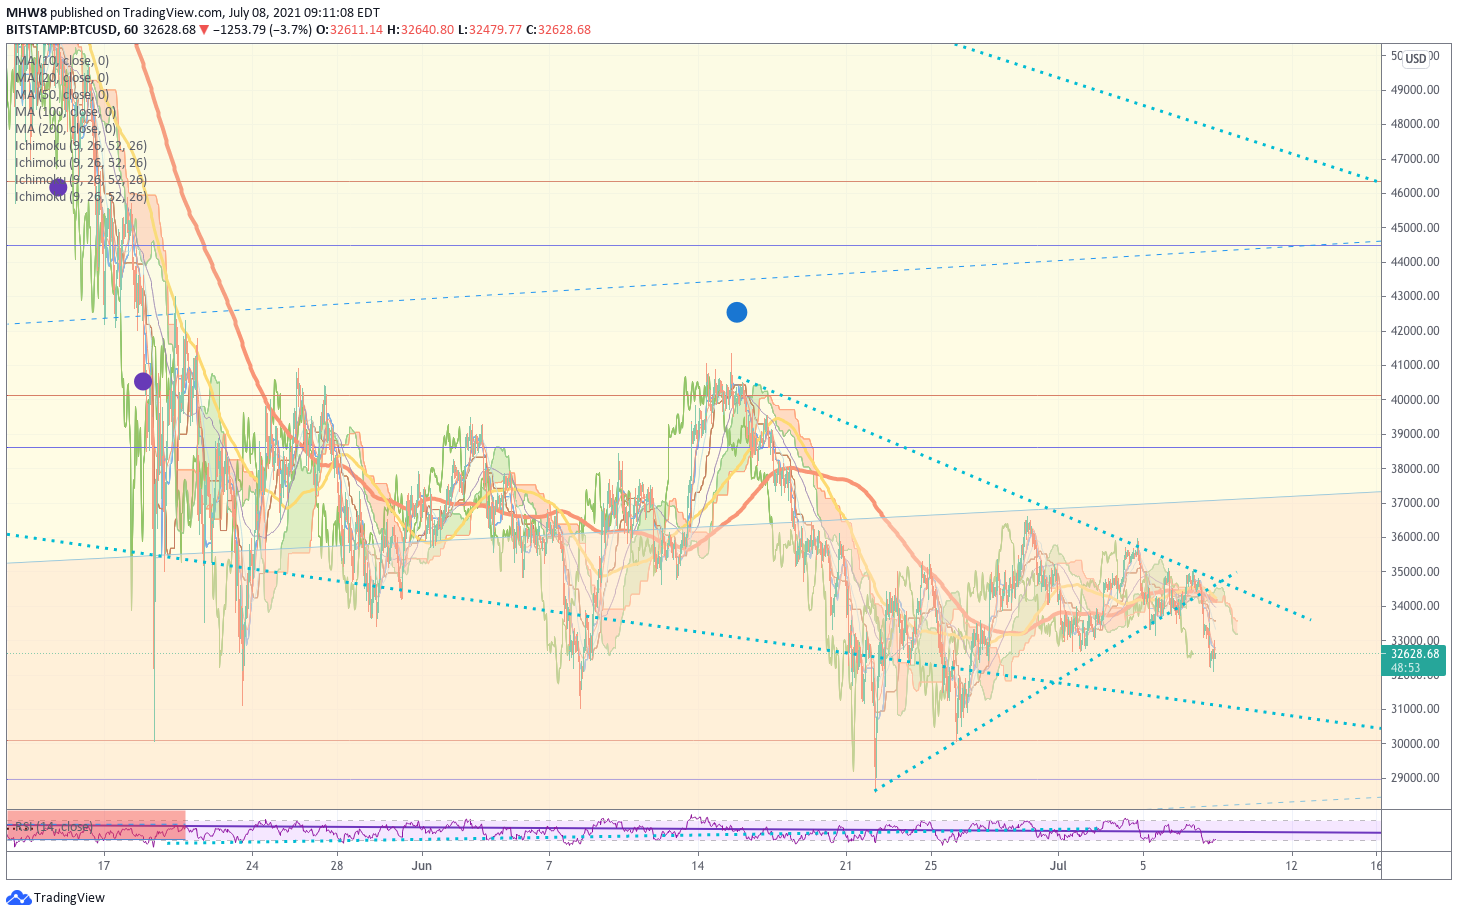
 But, BTC has seen its little triangle pattern break down – another nail in the coffin. I get that it has good potential as a store of wealth, but the charts are still firmly bearish and the potential for corporations to adopt something so volatile as an alternative to corporate cash is, IMO, very overblown.
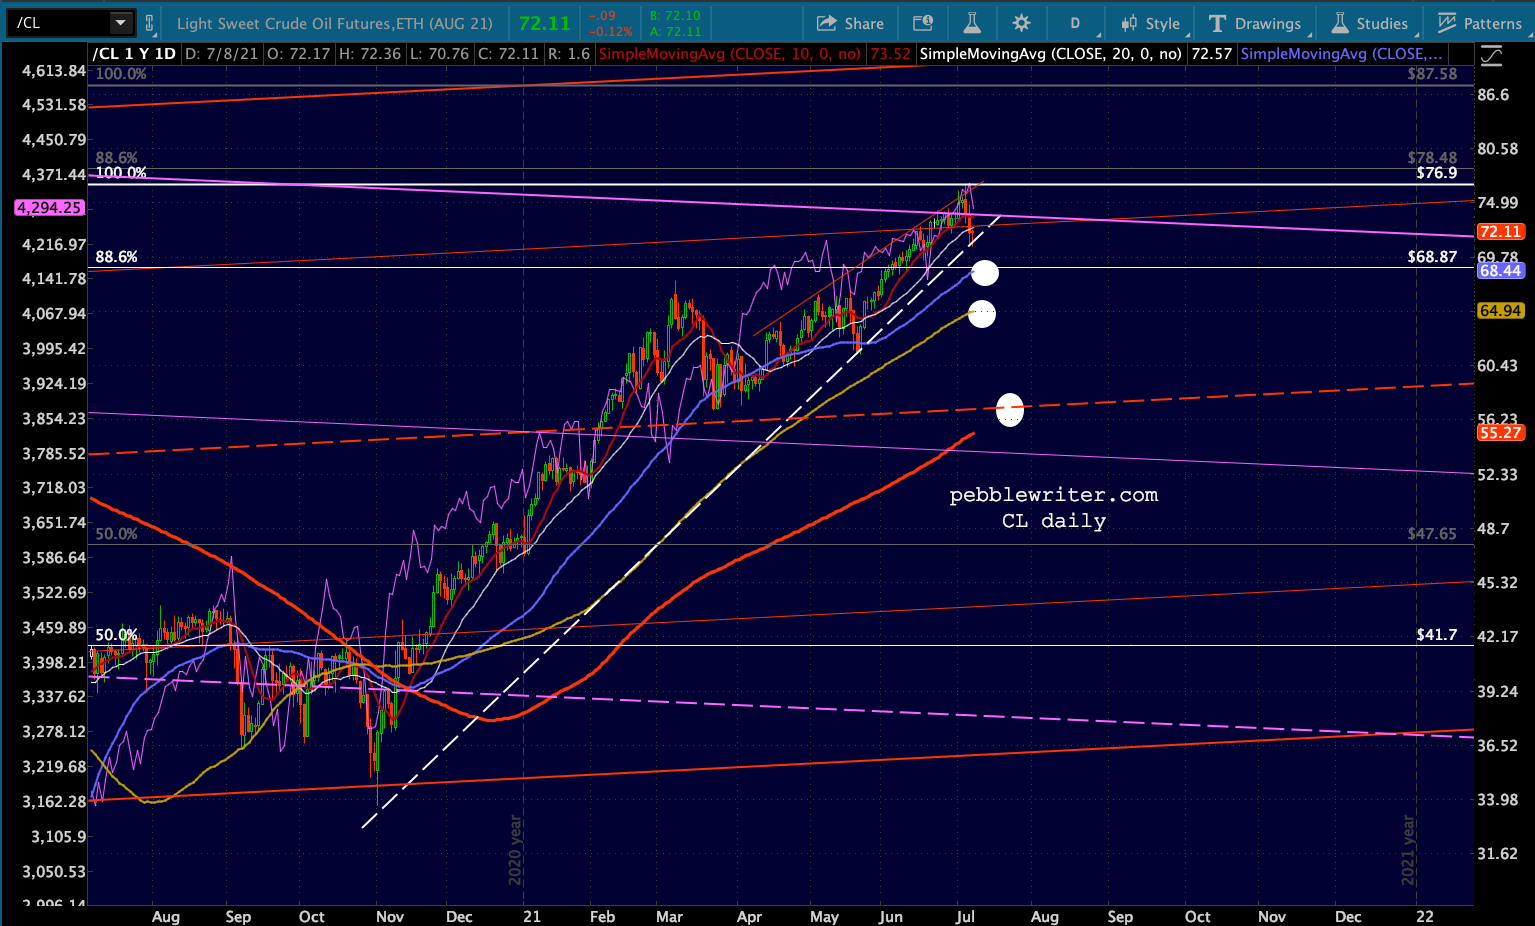
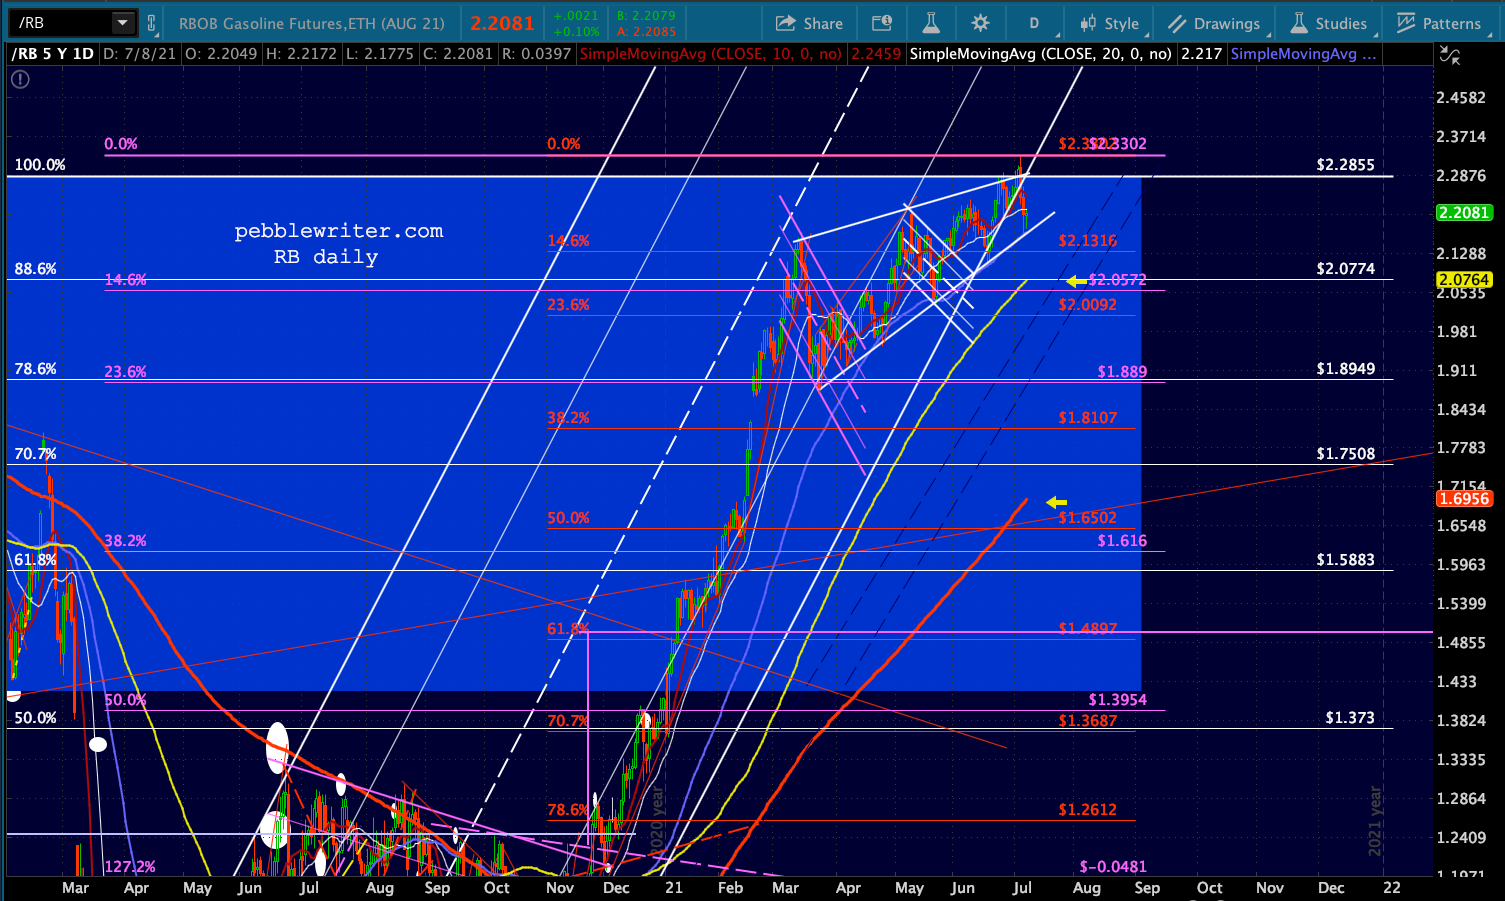
  CL is even more of a threat to the bulls than is USDJPY. It hasn’t broken down yet, but it’s sure looking shaky.
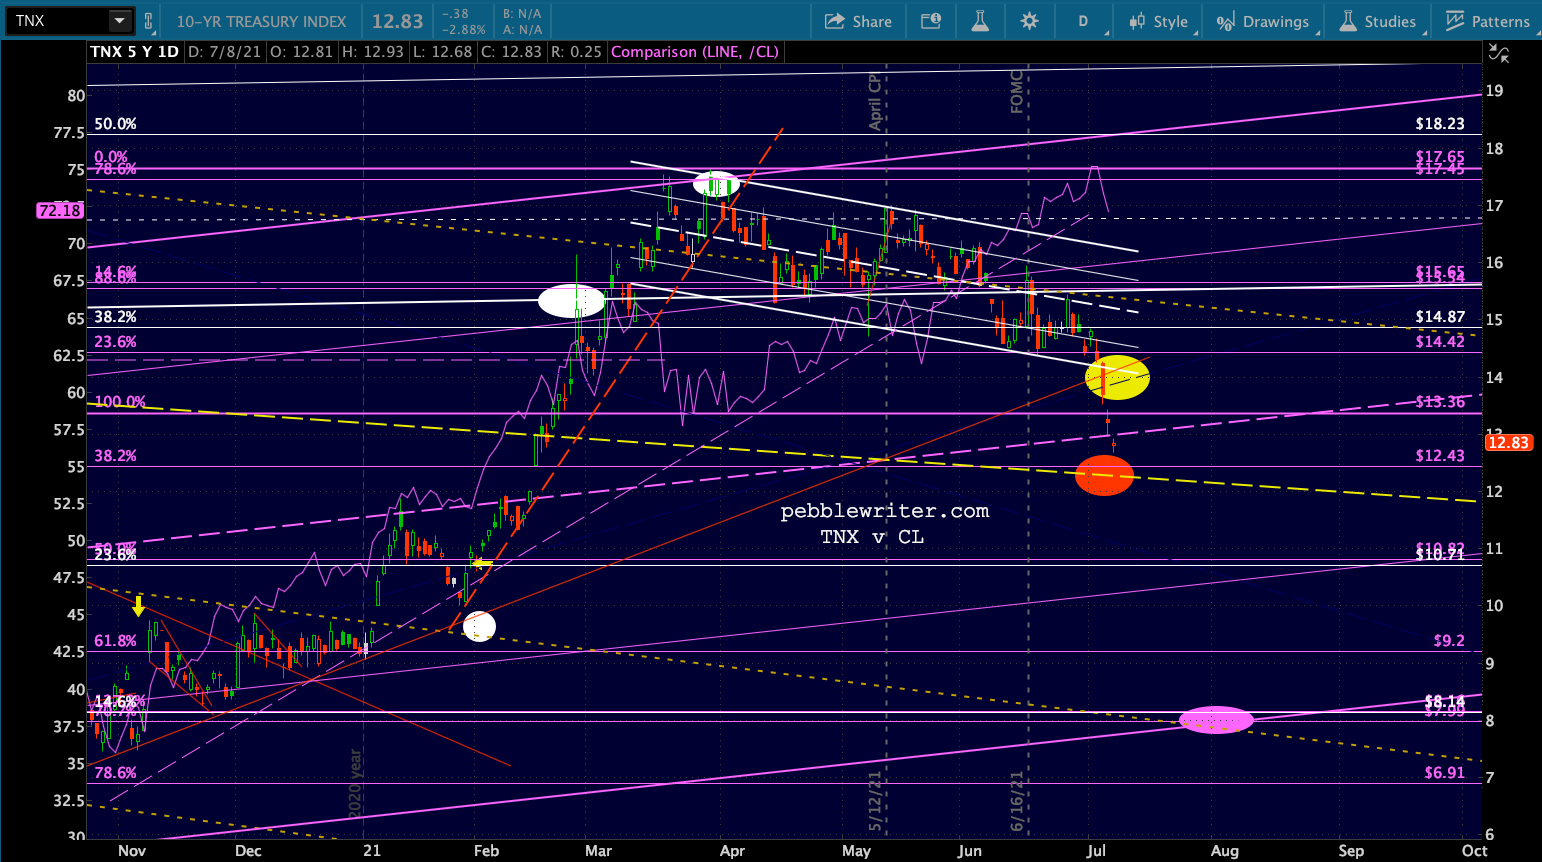
 On the bond side, TNX is very close to tagging the falling yellow channel midline and the gap close (1.202%) we discussed yesterday. If the 3.618’s mentioned above don’t hold, don’t be surprised if TNX reaches the purple target below 1%.
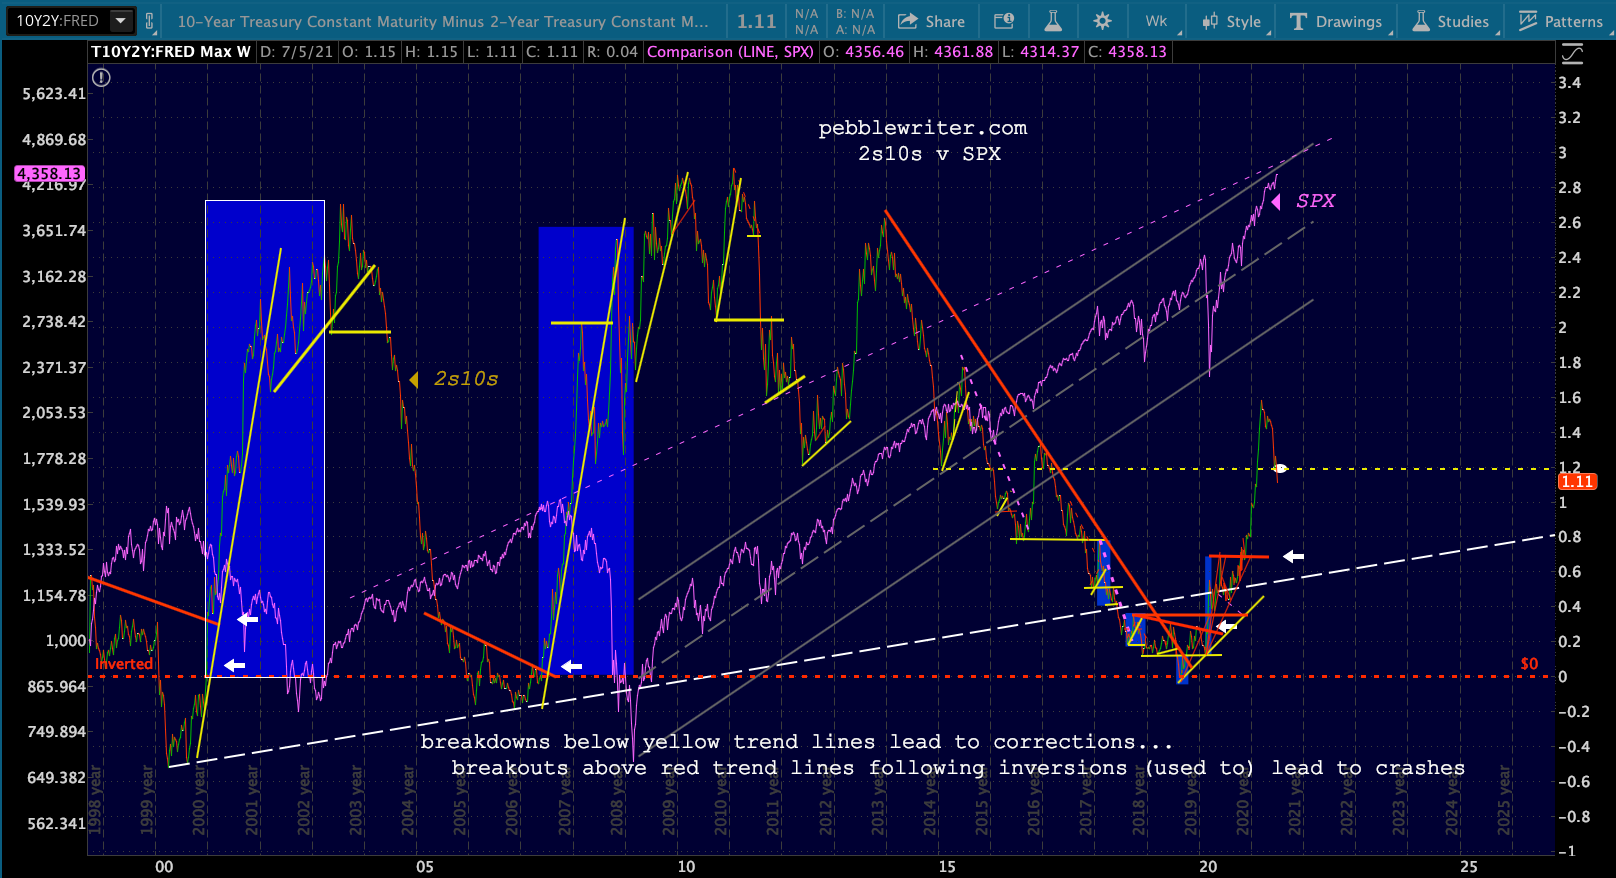
 And, let’s not forget the 2s10s. Although the Fed wrecked price discovery by buying all the Treasury’s net issuance, nasty things could happen if they pull their support due to spiking inflation that turns out to be not terribly transitory.
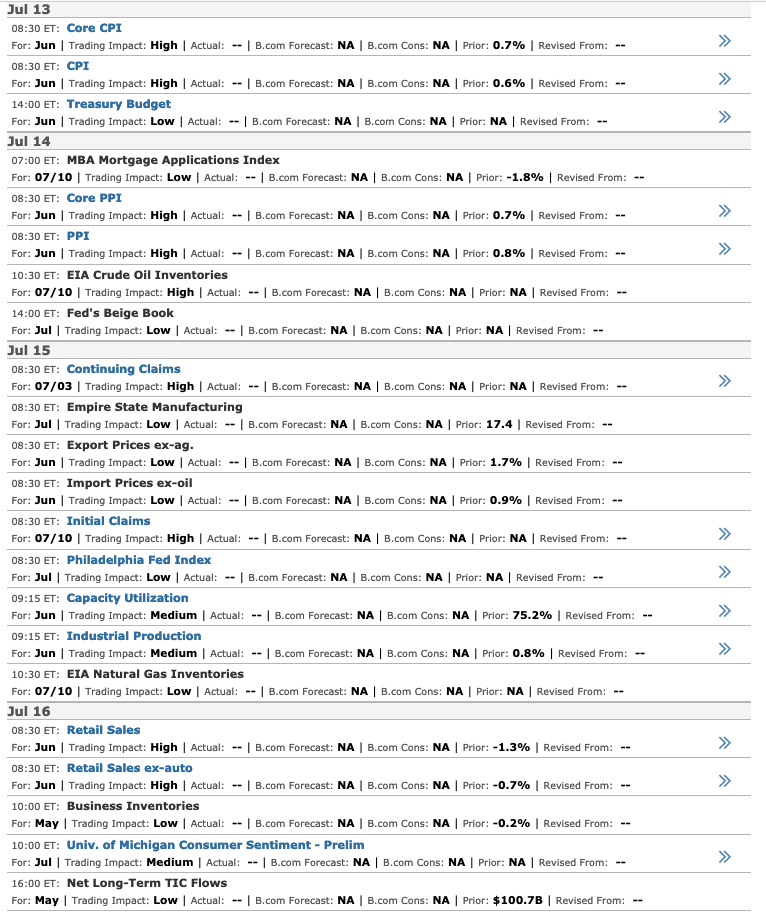
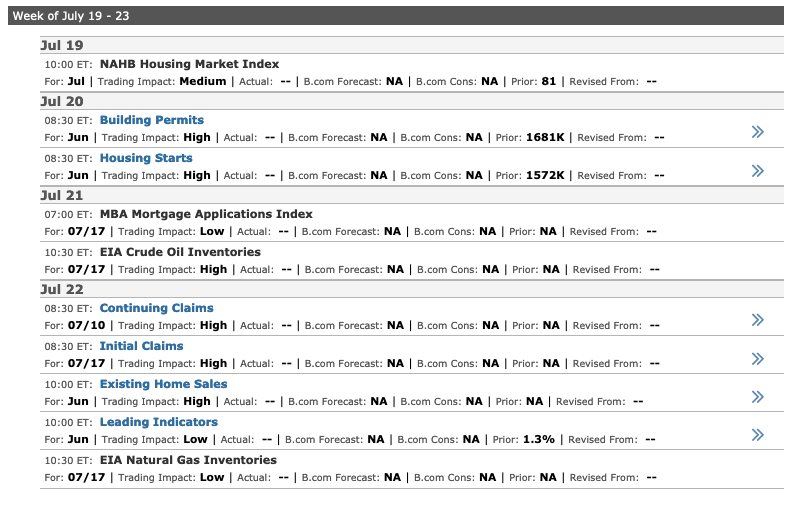
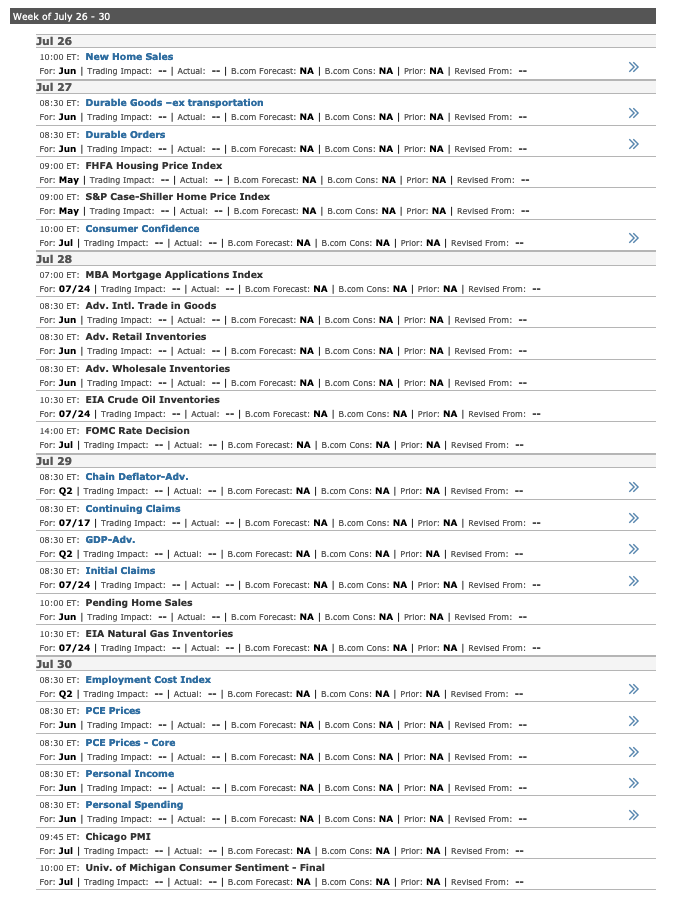
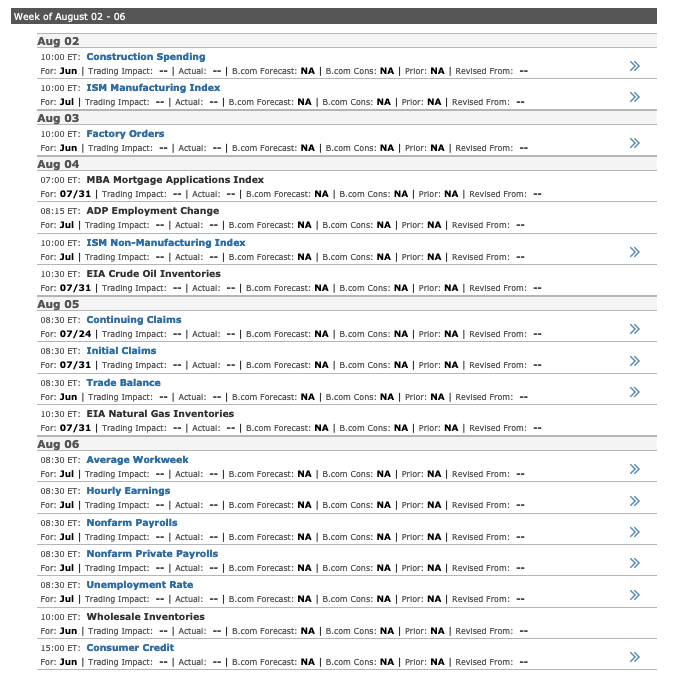
 While we’re on that topic, I looked ahead at various economic data which might fit in with the above equity scenario. There are many coming up, with June CPI and retail sales arriving next week.