

The 10Y tagged our next downside (yellow) target yesterday, the trend line from the Aug 2020 lows, trading as low as 1.352%. In reaching those lows, it actually broke below both the trend line and the bottom of the falling white channel it’s been locked in since mid-March.
 This target has been on our radar since March, when we plotted it in anticipation of a blowout April CPI print. We got the print (4.16%) but the market’s downturn was limited and short-lived, resulting in a gentler, more carefully governed decline than we originally anticipated.
 Yesterday, however, the decline turned into a breakdown. Today, we’ll discuss the implications.
continued for members…
First, the big picture for equities…
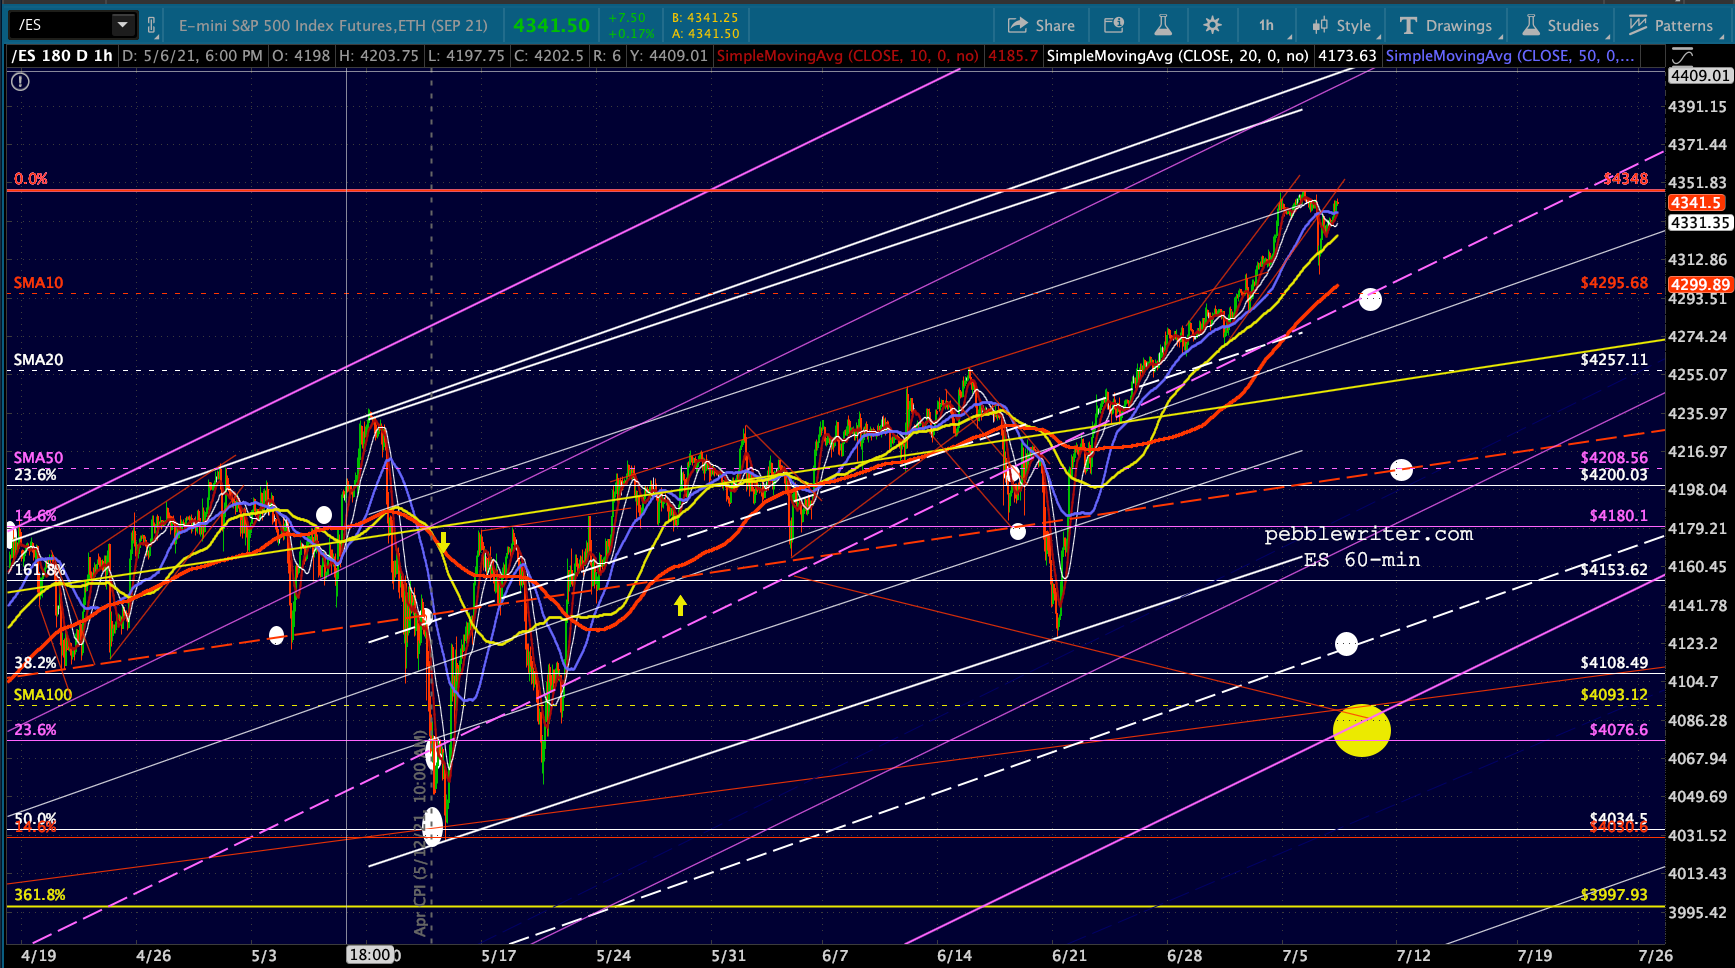
 … which still relies heavily on what VIX is up to…
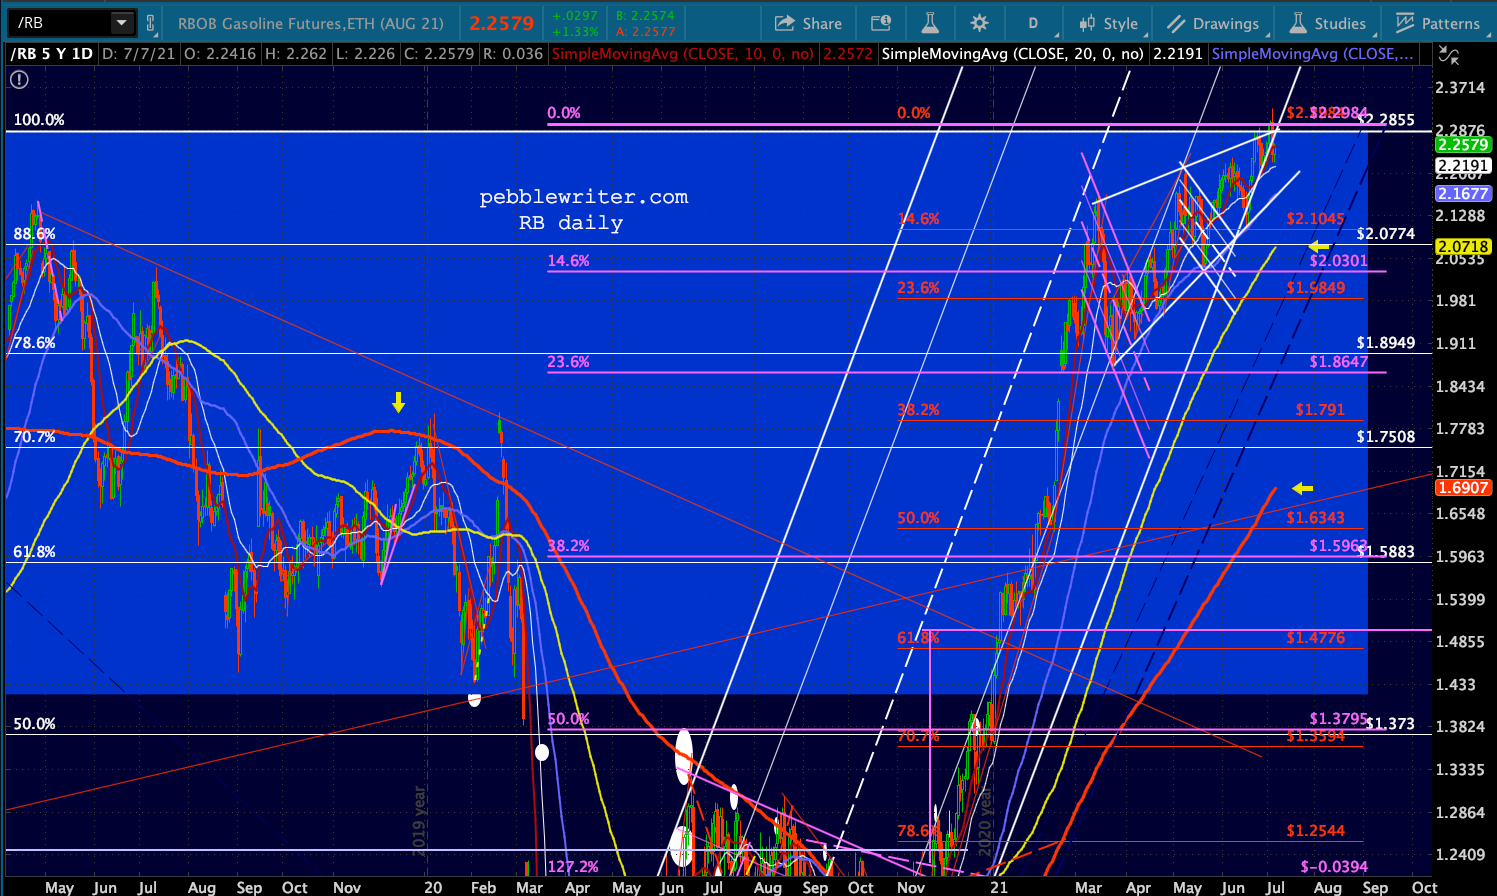
 …as well as whether CL/RB have actually topped out here.

 USDJPY is still poised to go higher if needed – but most of the action is coming courtesy of the euro which is picking up steam and should be a drag on stocks as it continues to break down.

 Getting back to TNX…the major feature of the chart is still the gigantic falling yellow channel…
 …which TNX didn’t quite tag the bottom off last year. Instead, it bounced at the .236 line, zipped through the midline, and is probably in the process of backtesting the midline. It would have made perfect sense for that to happen back on May 12 when the rising purple midline crossed it at the purple .382 Fib at 12.43.
 But, TPTB got nervous when the market puked all over that CPI print. ES plunged 210 points.
  They obviously reasoned (correctly) that stocks would be happier if the backtest was slow and steady instead of a panic inducing plunge.
 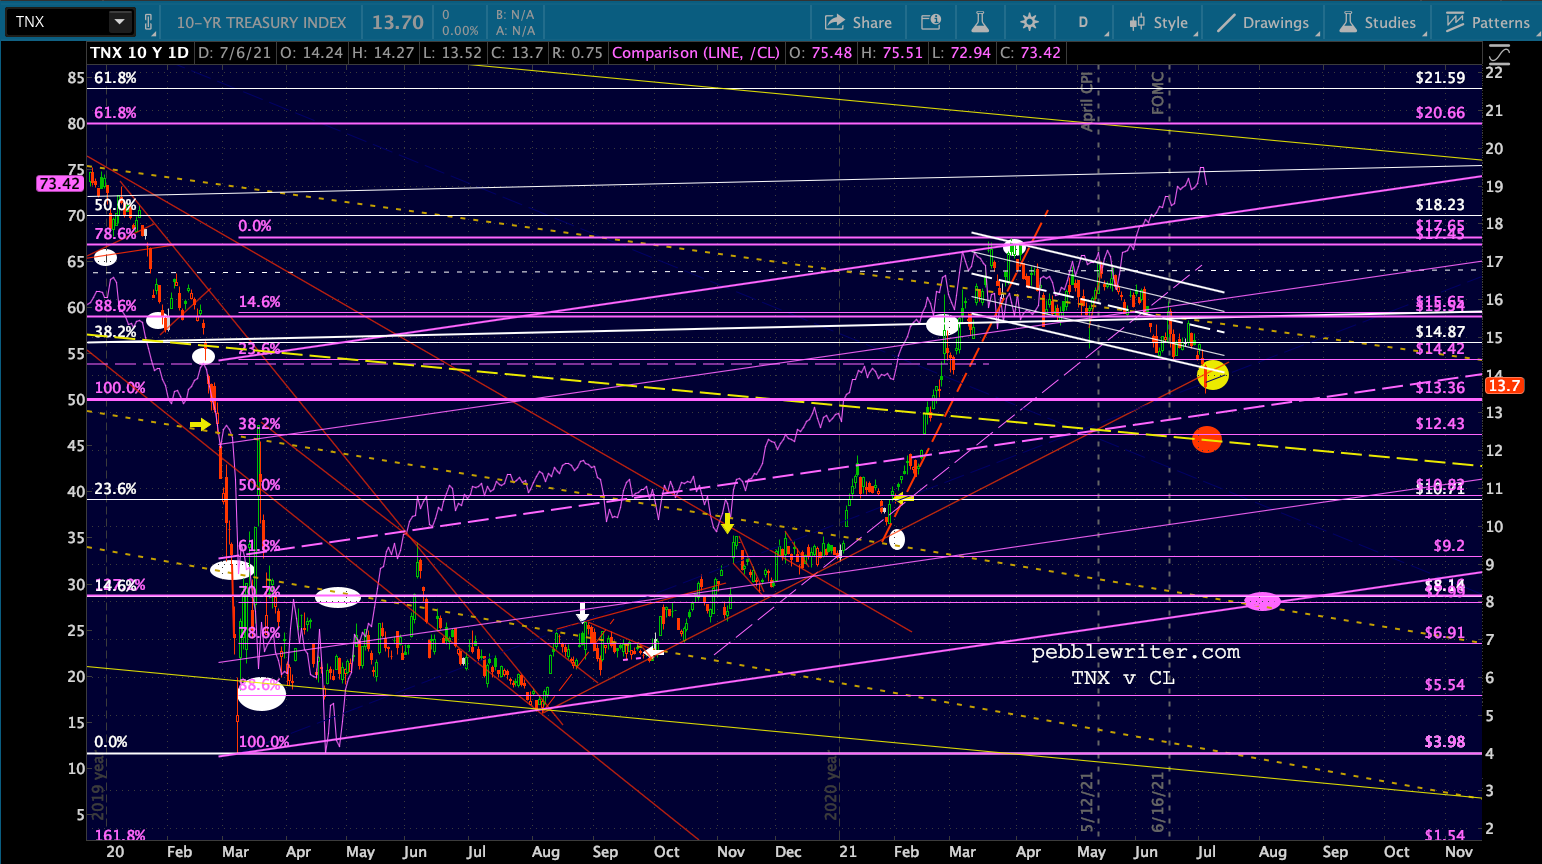 I know it’s counterintuitive for rates to be dropping at all during a spike in inflation. But, this is what happens when the Fed takes control of the bond market via their $120 billion monthly “investment.” They would like us all to think that spiking inflation isn’t a problem at all. If it were, rates would be rising – not falling!
Now that the purple channel midline has been tagged, the support question gets a little trickier. Note that TNX is slightly below the July 2016 lows (13.36) which also provided a bounce in Aug 2019. If it remains below 13.36, then there’s a gap to close from Feb 12 at 12.02 and the falling yellow midline at about 12.26.  If the yellow midline holds (I think it should) then the resulting bounce could reach the falling yellow channel .786 line way up at 19.6. It would also be the top of the rising purple channel – which looks more and more like a flag pattern every day. If it broke above this channel line, then the next serious resistance would be the white .618 at 21.59, followed by the white .786 and yellow channel top at 26.38.
The 19.6 target is presently situated around late December (Dec 20?) which would tie in nicely with the usual equity year-end sprint to new all-time highs.
If the yellow midline doesn’t ultimately provide support, then TNX has good downside potential to 9.2 – the purple .618 Fib and bottom of the rising purple channel around the same time. It that broke down, then we’re looking at .15% or even lower.
Bottom line, we’re at a very important juncture here. At the end of the year, the 10Y could easily be as high as 2.64% or as low as .92%.
At the upper end of that range, inflation will have proven not to be transitory and, while the Fed’s credibility will be even worse, stocks might be caught up in that inflationary surge. The euphoria would likely last until folks realized that our current debt picture makes higher rates truly terrifying and housing sales dry up.
At the lower end, the Fed’s credibility will be even worse and stocks will probably suffer significantly – until folks realize that this is likely to usher in more QE.
GLTA.