

Friday’s onslaught easily reached our first downside target (two days late) and very nearly reached our second (two days early.) I’m continuing to work on the big picture forecast [ see: Macro Factor Cycles and Regime Shifts.] In the meantime, here are today’s charts and a reminder of our targets.
continued for members…
USDJPY’s small white channel, after breaking down, yields to the larger consolidating triangle — the bottom of which lines up with the .618 at 108.41 (if you ignore the Jan 3 debacle.) If/when the triangle breaks down, things will get really nasty.
 Though we had a big headfake with the push back up through the yellow TL, it has rebroken and the 2s10s is heading for horizontal support at the white TL. If/when it breaks, we should get a resurgence of equity weakness. In December, this signaled the arrival of the Dec 3-24 plunge from 2800-2346.
  The line in the sand is 11 bps – which we already reached intraday on Friday.
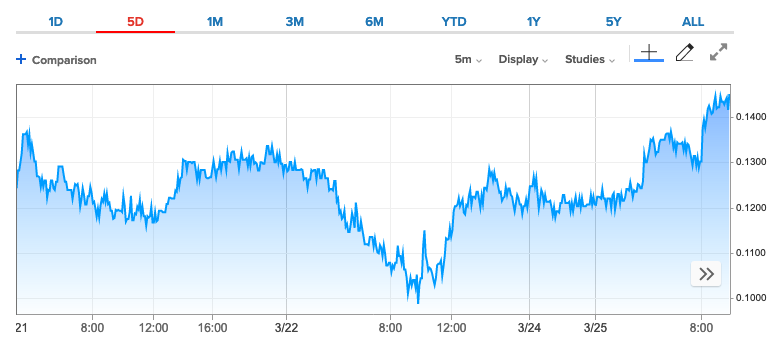 Note that I’ve added another downside target for TNX: 22.94. It represents the white .786 and purple .500 and the intersection of a new channel I added this morning – seen below in purple. It parallels the red TL connecting the Dec 2016 and Oct 2018 tops. The previous version…
 …and, the new. I’ve also officially added the purple .886 into the picture, as it matches up with our highest ZN target.
 VIX has overhead resistance at 18.16, the big white channel midline, and then at 20ish – the red channel top.
 The white channel may be seen more easily on the daily chart. Our .786 and .886 targets are still up there, waiting.

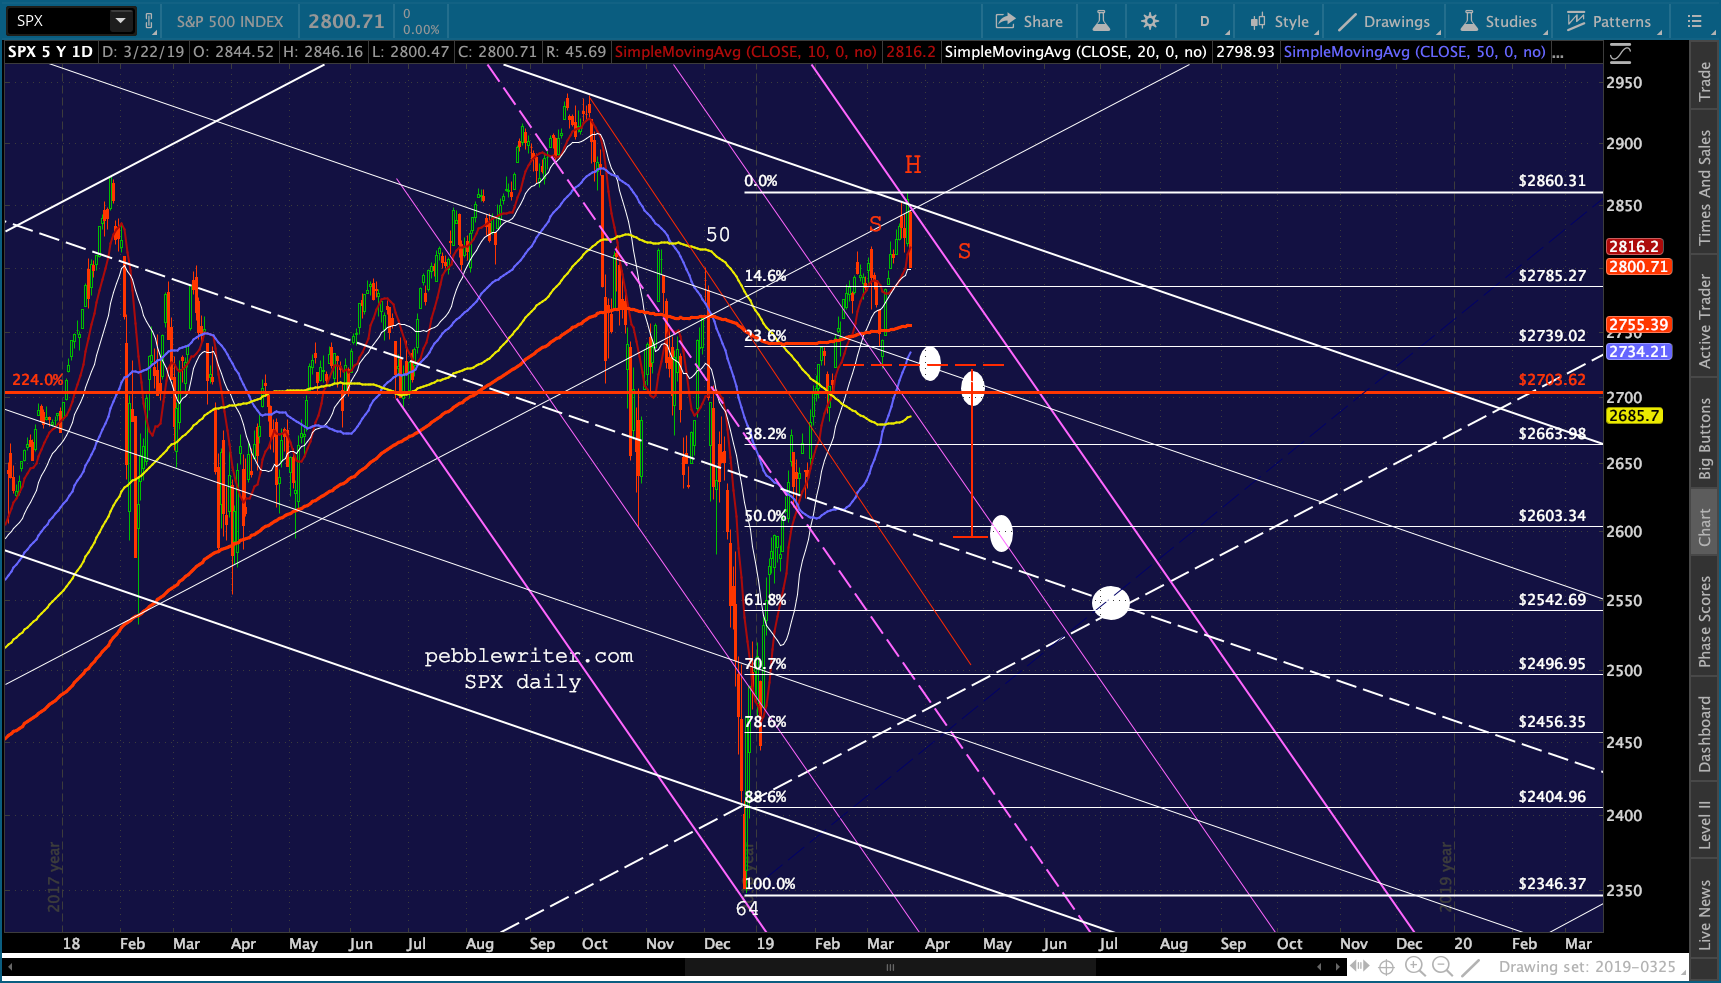
 Support for SPX comes in initially at the SMA20 at 2799.47, followed by the SMA200 at 2755.51, the potential neckline at 2722ish and then the 2.24 at 2703.62. I have it intersecting with the arrival of the SMA100, but the timing is up in the air.
 ES’s .618 at 2779 is the next downside target.
  CL’s comparison to 2015 still looks spot on.
  And, RB can’t do much more to help stocks without pushing further into the year-ago range. If it breaks below the SMA10 at 1.8826 its next support is the SMA200 at 1.7852.
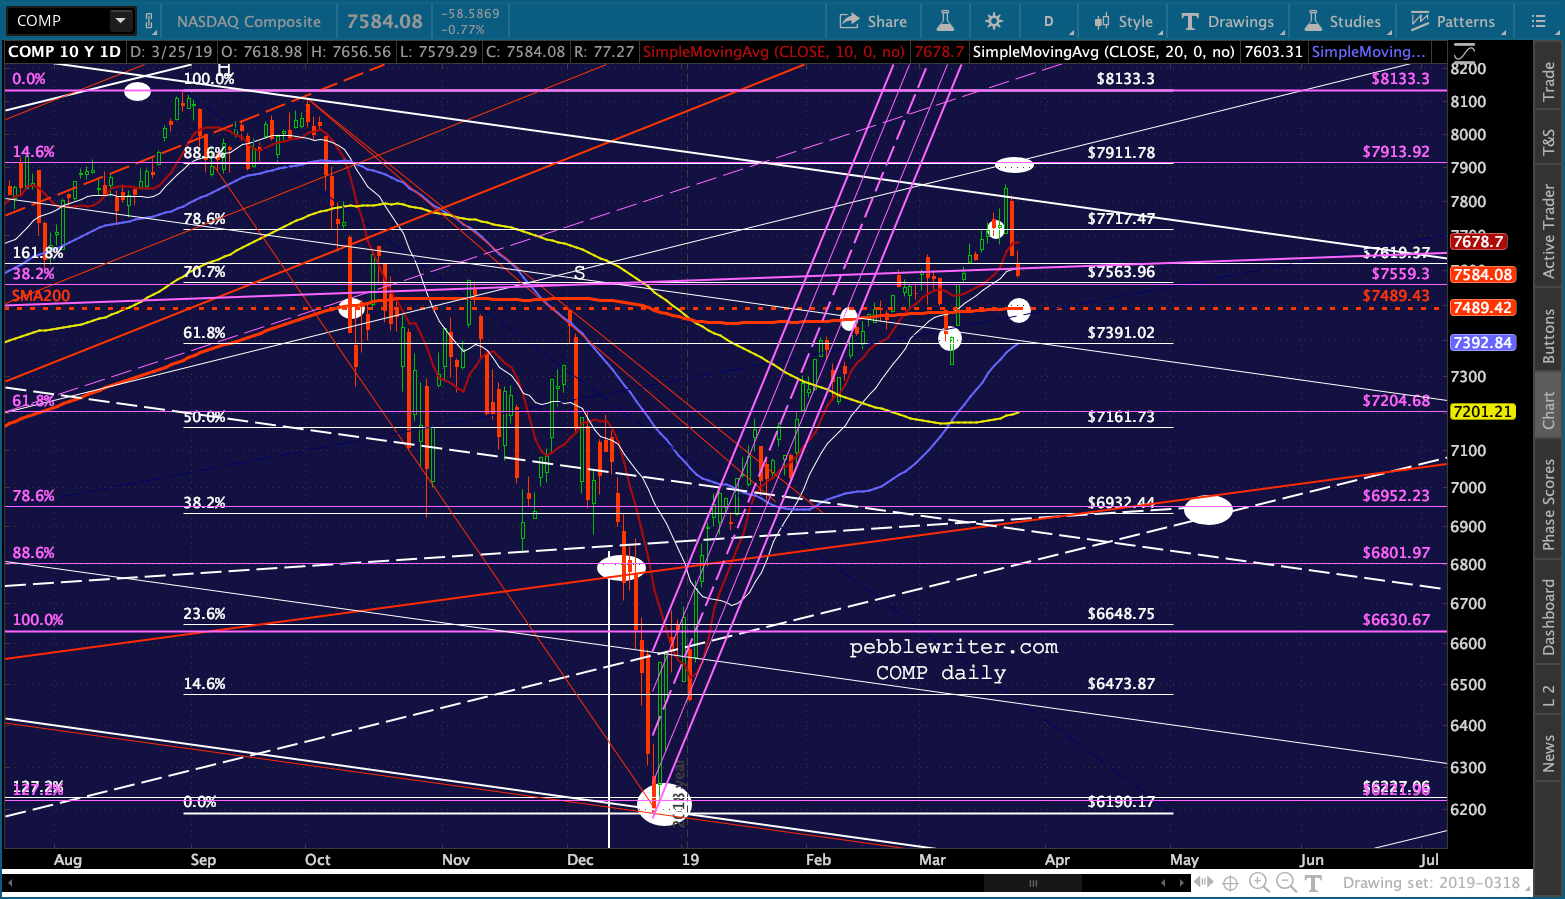
 There’s an important test for COMP coming up at its SMA200 as well.
 A couple of other charts worth keeping an eye on…
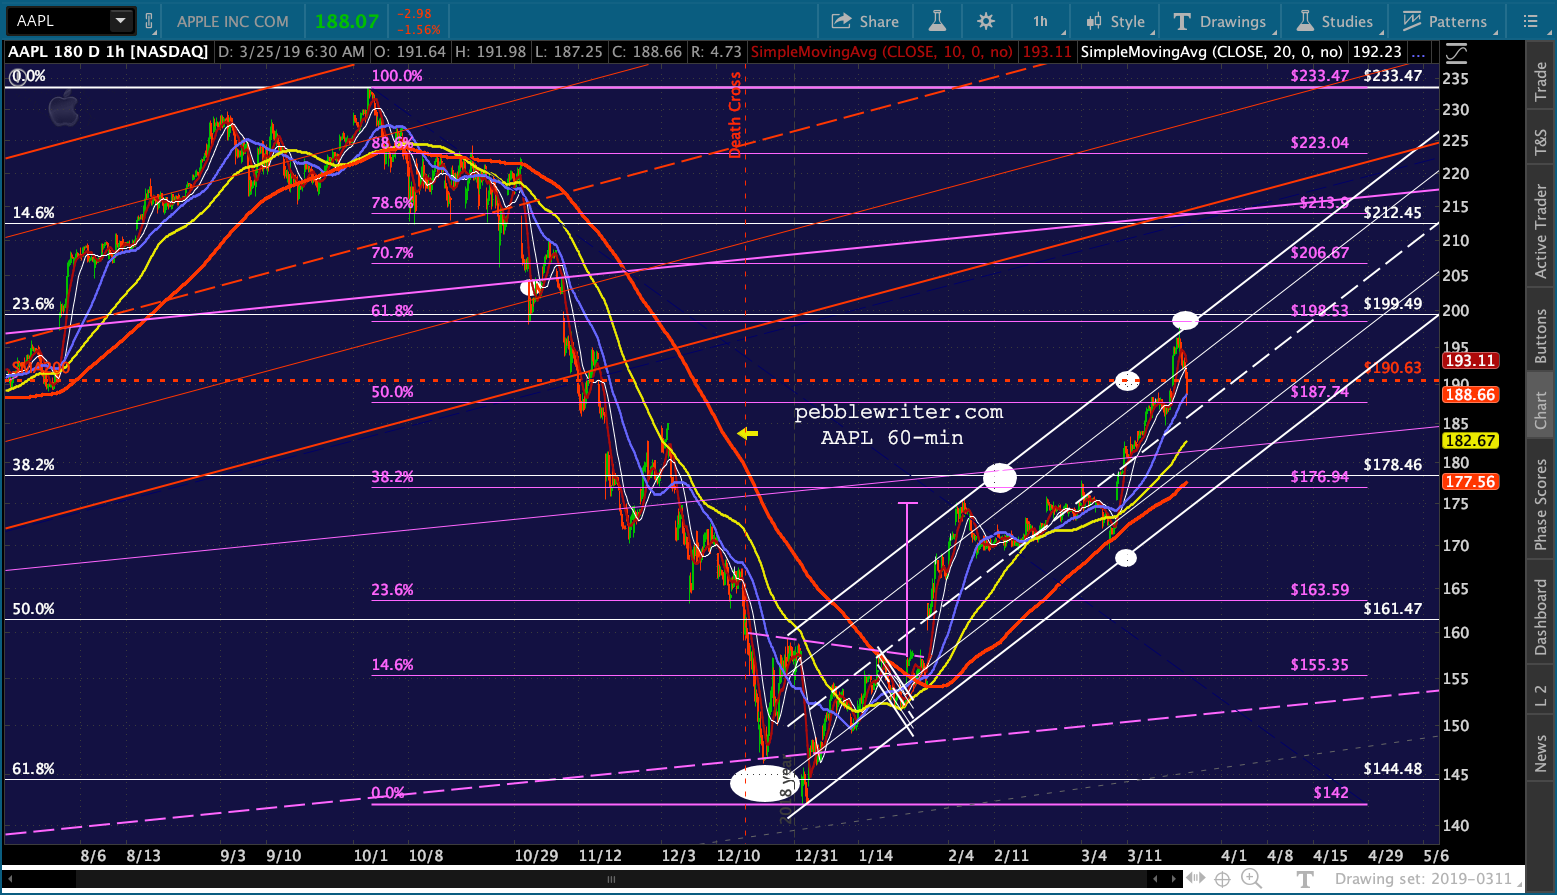
AAPL has dropped back through its SMA200 and is testing its .500 – after never quite reaching its .618. A drop through 187.74 would point to the .382 at 178.46.
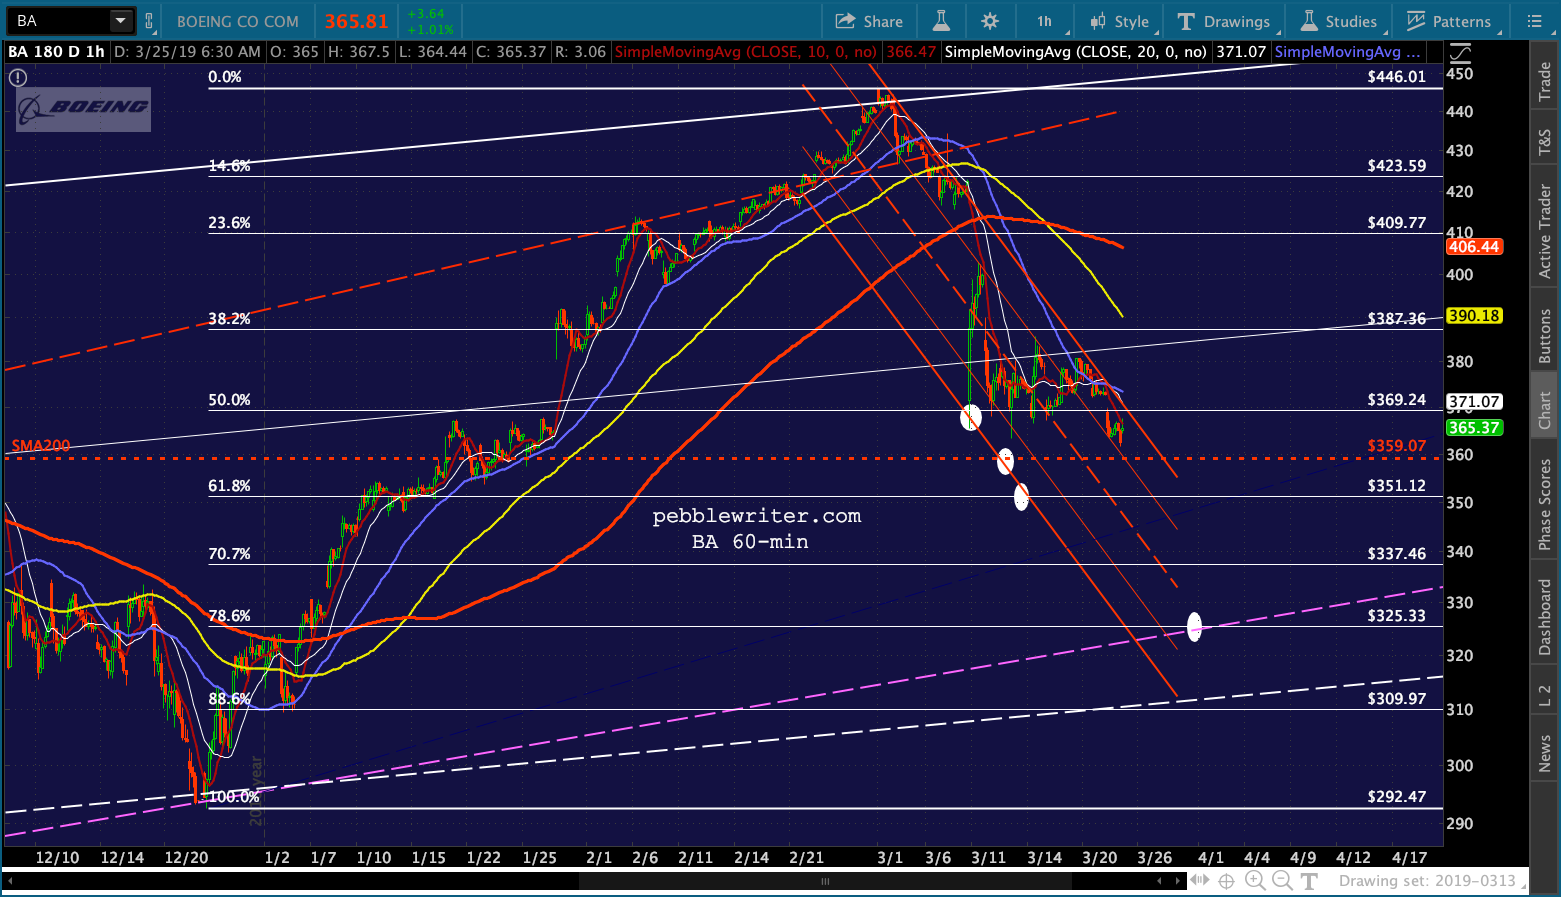
 And, BA is gradually dropping down to test its SMA200. A drop through 359 would open up our 351.12 and 325.33 targets.
 Though we’re off to a pretty sharp start, I expect we will get some vicious bounces along the way. I’ll do my best to add them as they occur to me. October 2020 and SPX 2138 is a long way away and, like any distant target, is nothing more than an educated guess. The bounces along the way will help establish falling channel bottoms and give us a better idea of the timing.
I’m going to sign off now and work on the economic data for the big picture. I’ll check back in at the end of the day if not sooner.
GLTA.