

Last night was a quiet session for ES, CL and USDJPY. With the futures off just 2 points and our upside target within easy reach, the question is whether it’ll occur today or towards the middle of the month — which actually suits the charts a little better.
USDJPY shed some of its gains, but is holding on to channel line support. continued for members…
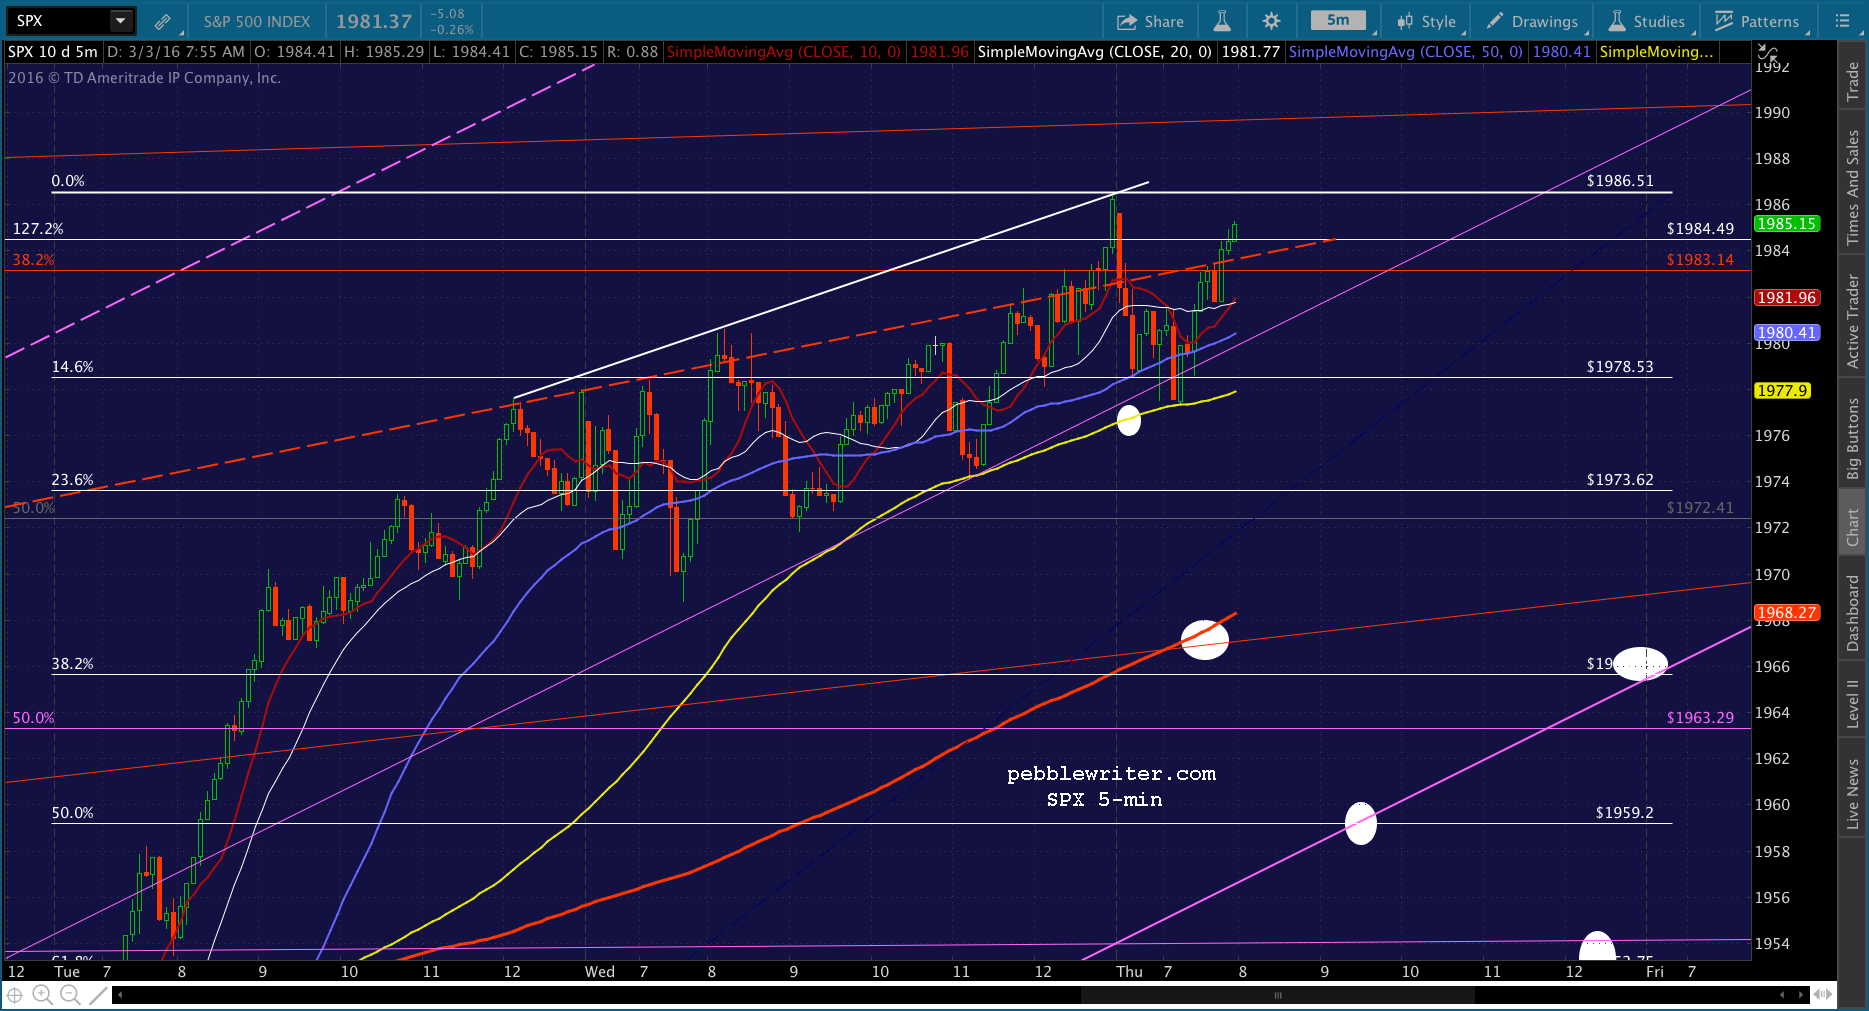
While, CL is easing down toward channel bottom support — which it couldn’t quite reach Monday, Tuesday or Wednesday. A tag on the red TL at 34.11 would do for starters. Look for SPX to at least backtest some of the resistance it broke through yesterday. The initial line is the TL connecting the most recent highs — about 1982.
  I’d start out short and look for a tag at the SMA5 100 at 1976.71. This will also represent the .236 purple channel line. If it doesn’t hold, then the SMA5 200 at 1968 would make a nice target. The final downside mark would be the purple channel bottom at 1952ish.
 I show the ES chart because it’s indicative of the multiple time frames in which an upside push could take place. It also shows how the latest rally has, so far, merely backtested the bottom of the broken purple channel from 2009.
If the rally is to continue, it must push through this channel. It can bump along underneath it and still gain some ground. But that would be a painfully long, slow way to stage a rally. More likely that TPTB will use something big and dramatic — say, whatever the ECB has up its sleeve next week — to leapfrog this serious resistance.
 UPDATE: 9:49 AM
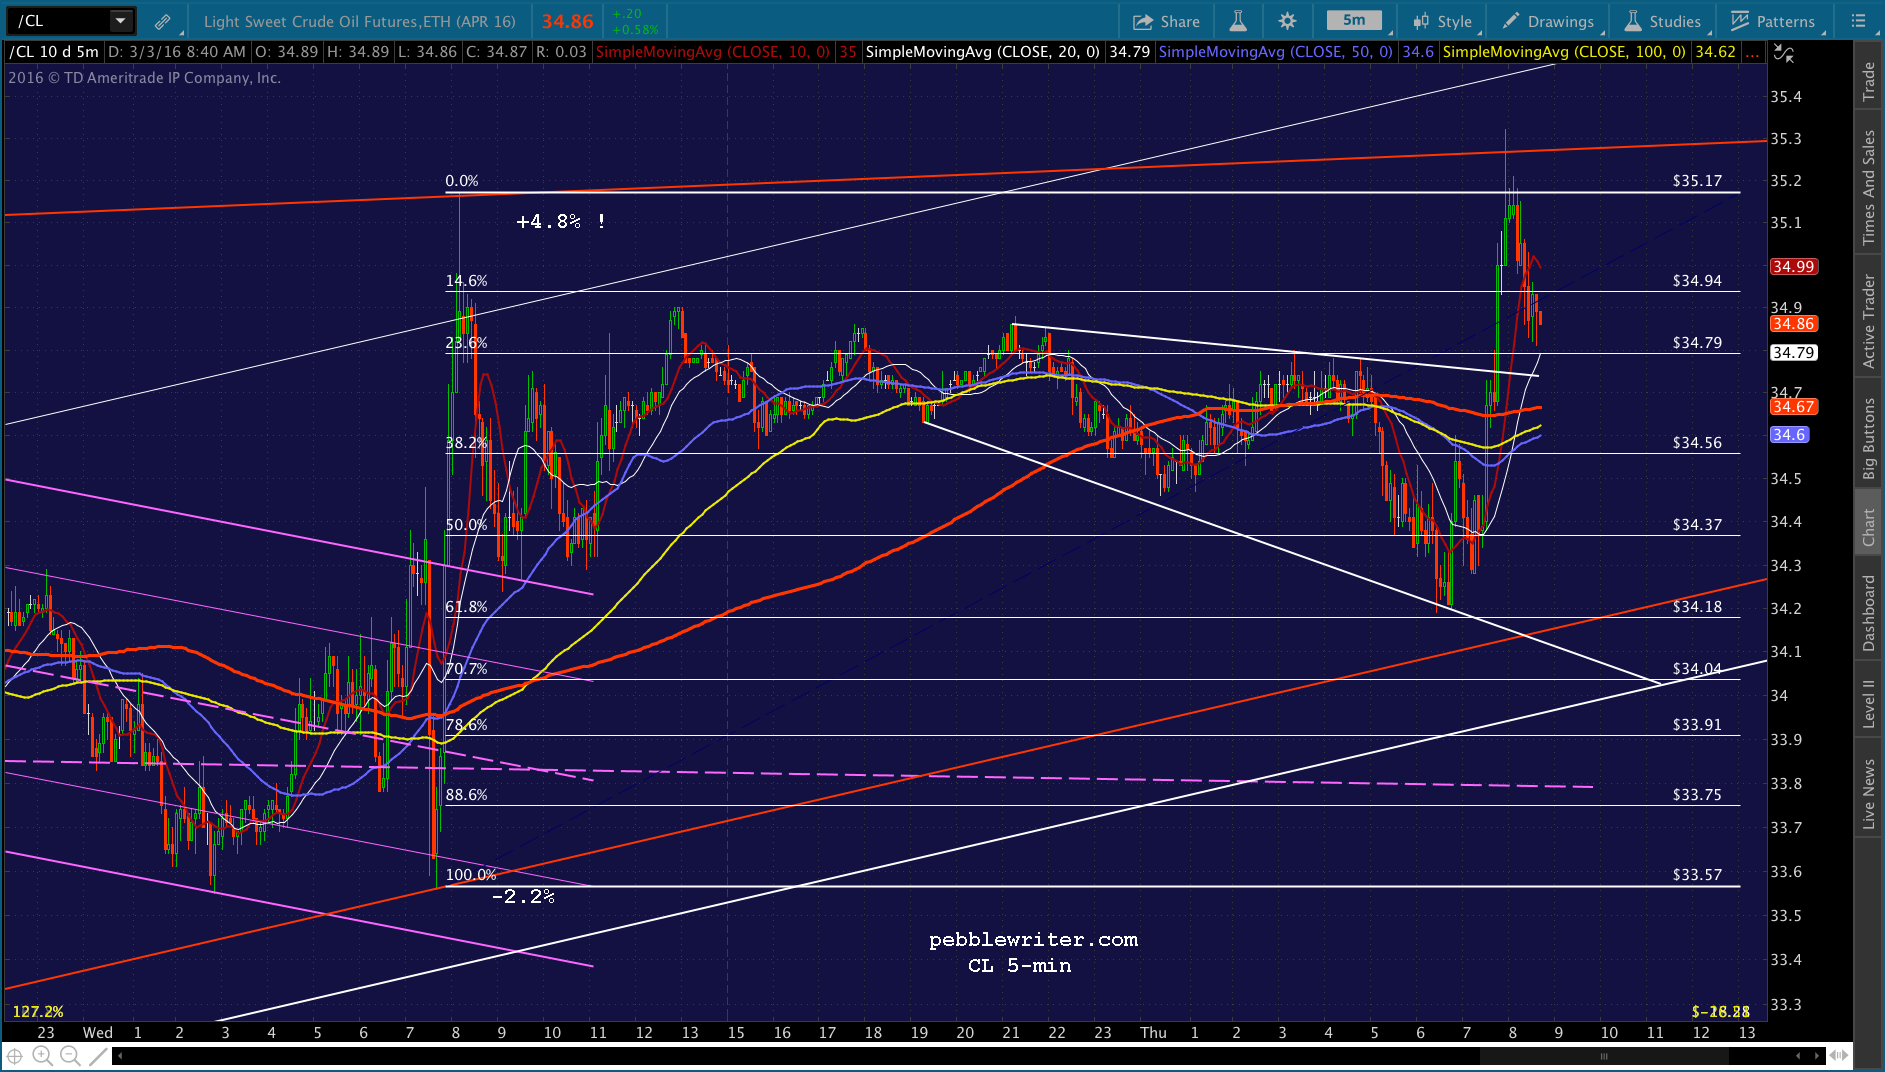
USDJPY has broken through initial support and is backtesting the falling white midline again. It has further potential to the .618 at 133.08. CL was making progress toward the red TL, but just bounced near its .618 retrace of yesterday’s lows.
 And, SPX is bouncing at the SMA5 50, short of the SMA5 100.
 The media is talking up the ISM services report due out shortly, but the key to the timing of SPX 1999 will likely be CL. If it takes off on another tear like yesterday’s, then we should bag it today. If it makes a lower low of any kind, then the thrill is gone and we’ll probably have to wait until Mar 14.
UPDATE: 10:25 AM
Pretty crummy data sent SPX almost to its SMA5 100 — 1977.42 v 1977.36. It might be as close as we get, as USDJPY is pushing back above the white channel midline. However, CL is making noises like it wants to tag that red TL or, horrors, the channel bottom itself. So, we’ll hang in there with the short — for now. 
 UPDATE: 10:28 AM
The SMA5 10 has caught down with SPX and it isn’t heading lower. I’d revert to cash here. and see whether it finds more downside momentum at the SMA5 20. UPDATE: 10:35 AM
Here we go again… CL just drove SPX right through all its short-term SMAs in a matter of minutes. It could reverse here at the red TL, but it’s unclear whether or not CL is breaking out or just screwing with us. I’d revert to short here and take a chance on the SMA5 100 tag again. It’s now up to 1977.53.
 The CL situation is dangerous to shorts, so keep a close eye on it. In other words, if it suddenly spikes through that white TL, go long. Don’t wait to read it here first! I’m a pretty fast typist, but I can’t keep up with CL.
FWIW, USDJPY still seems to have more downside potential, though the risk of a bump here is increasing. UPDATE: 10:47 AM
CL is pushing through the TL, so I’m going long here. Overhead resistance at ES 1893, so tight stops are advised.
 UPDATE: 10:53 AM
ES just tagged the SMA5 200. Potential pullback here… but, CL certainly hasn’t reversed.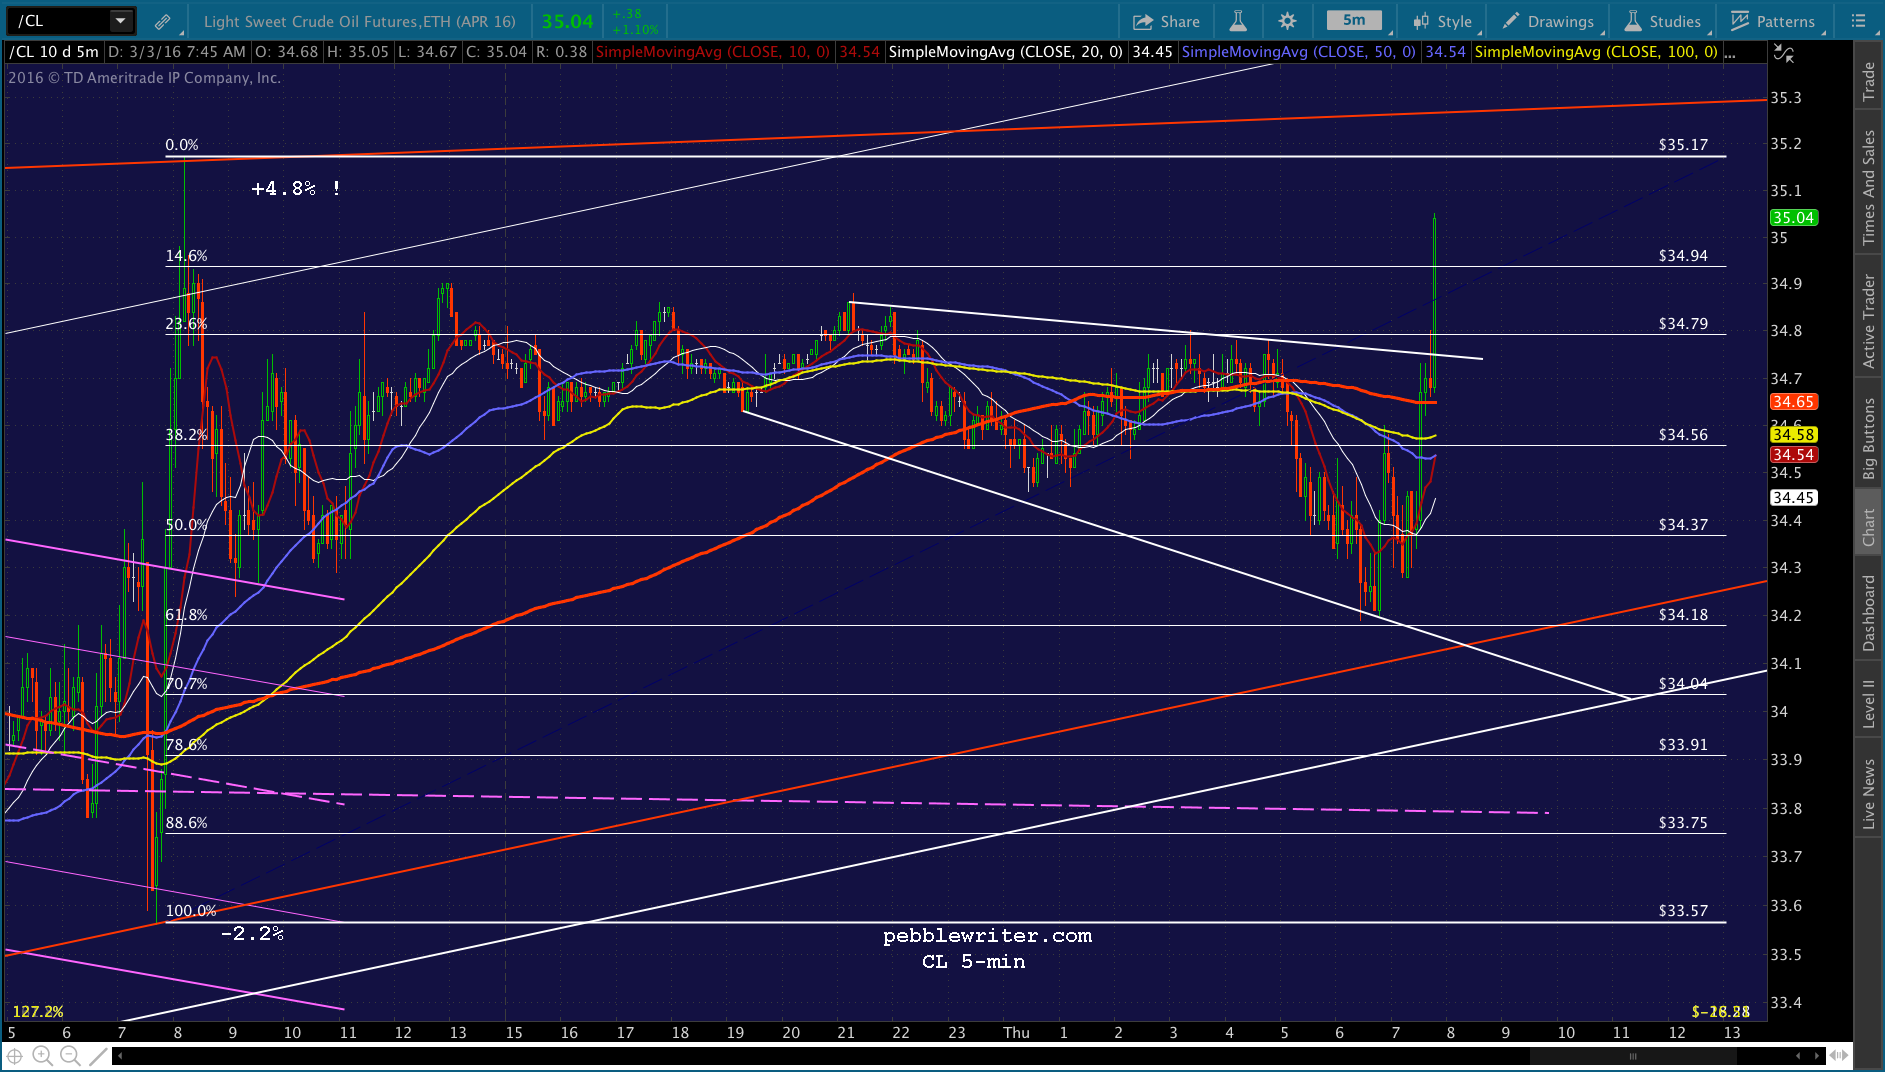
 UPDATE: 10:57 AM
CL just made another new high. ES resisted for a bit, but just relented, pushing up through the SMA5 200 before reversing. I’d close the long position and go to cash here, as it’s likely to catch down to the SMA5 10/20.
 Ordinarily, I’d say short it. But, this is a whole new level of fast-moving manipulation going on this morning.
UPDATE: 11:20 AM
SPX dropping through the SMA5 20, so back to short here. Note the SMA5 100 is now at 1978.31, so the downside could be limited to another tag of a TL connecting the last 24 hours lows. But, USDJPY is pushing lower…
 …and, CL’s upside might be limited. Note the red TL has hindered 3 previous rallies.
 UPDATE: 11:32 AM
ES is having a heck of a time tagging its .618. I’d close the short here and revert to wait and see mode. UPDATE: 11:38 AM
I think that was premature. USDJPY clearly has more downside just ahead of it. And, CL is indicating a backtest of the white TL. Even NKD has broken support. I’ll take one more crack at a short position here if ES drops through the .618 at 1974.46,


 UPDATE: 12:01 PM
I’ll give a short position another try here. USDJPY has backtested the white midline and CL has dropped through and backtested its white TL. NKD has backtested its TL and the SMA 5 10.


 UPDATE: 12:46 PM
ES just popped up above the SMA5 50, but CL and USDJPY immediately reversed — presumably because they’re guiding SPX lower — or, at least trying to kill some time. Sure enough, SPX responded with a reversal off of a little breakout. Hanging on to the short.
 UPDATE: 1:02 PM
I don’t know where this thing is headed, and I suspect TPTB don’t know either. Back to cash here.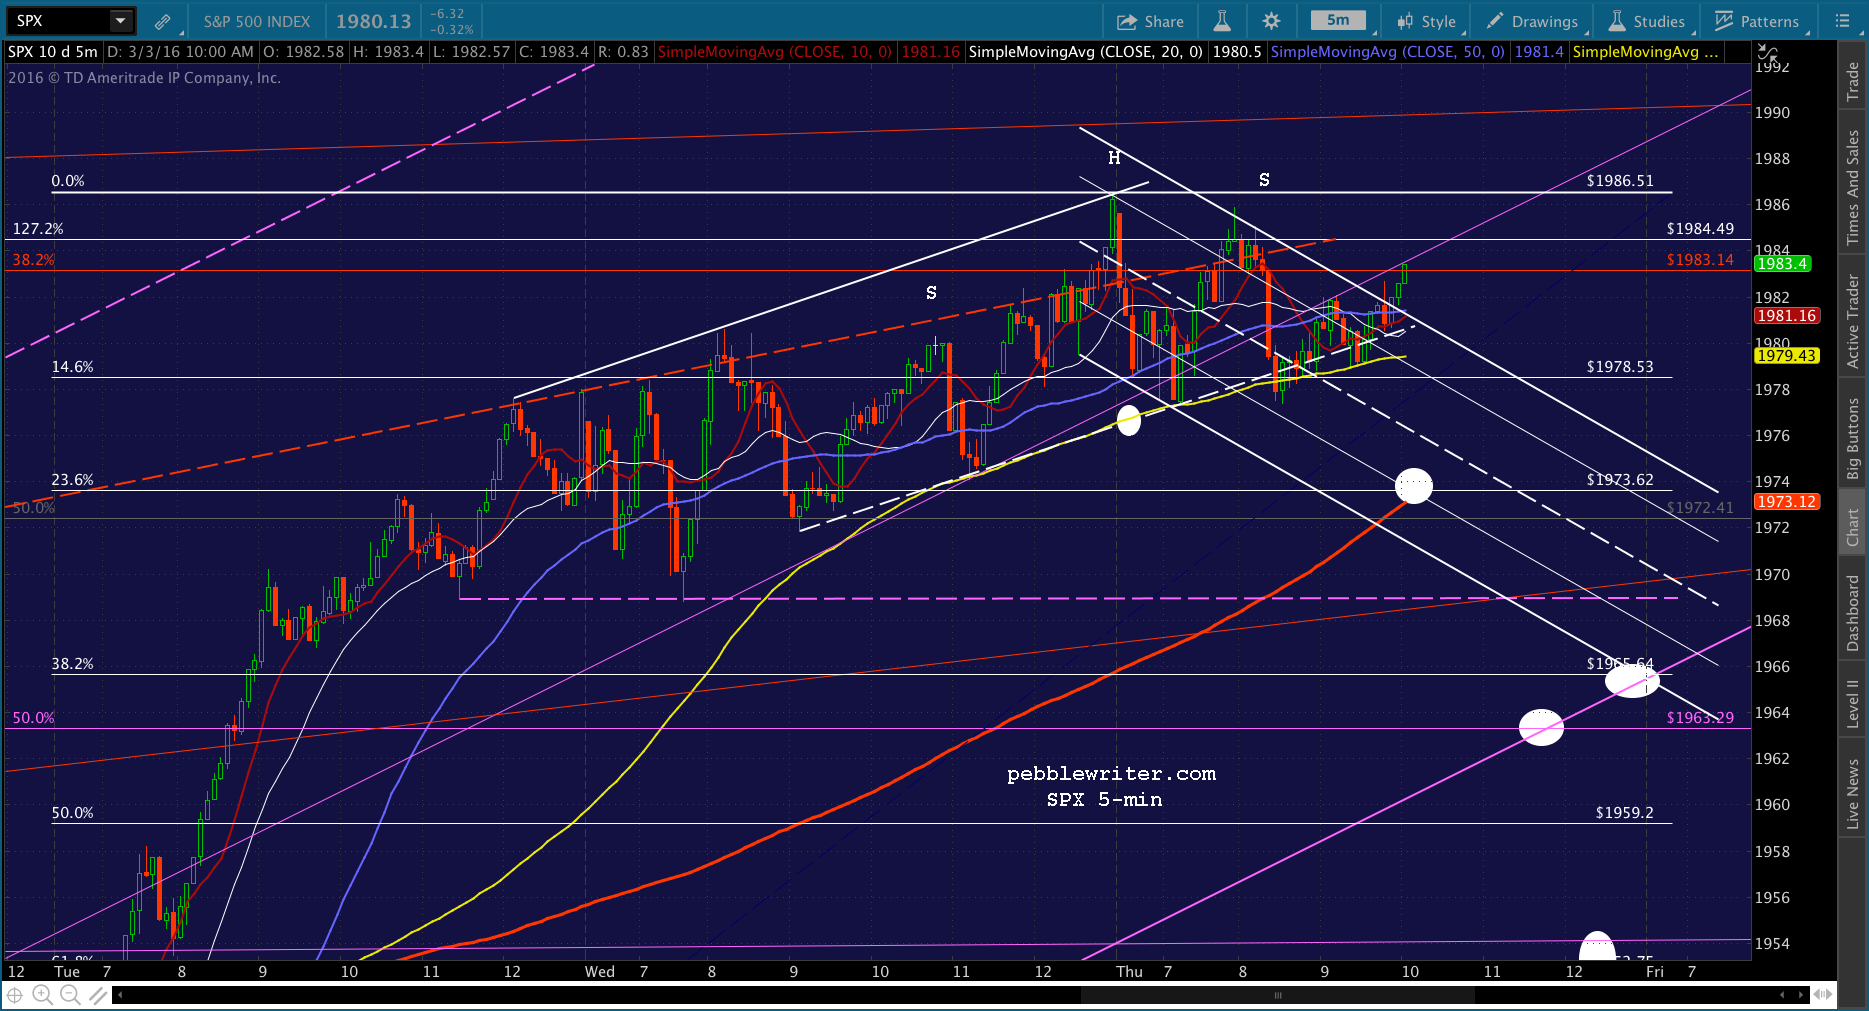 USDJPY is clearly guiding lower, but CL keeps popping up just enough to keep it from dropping. Apparently the competing algos are of equal strength, because it’s gone back and forth all morning.
There’s a potential reversal point coming up at ES’ SMA5 200 again — about 1982.50. I’ll consider shorting there, but I’m probably done for now. A very frustrating day…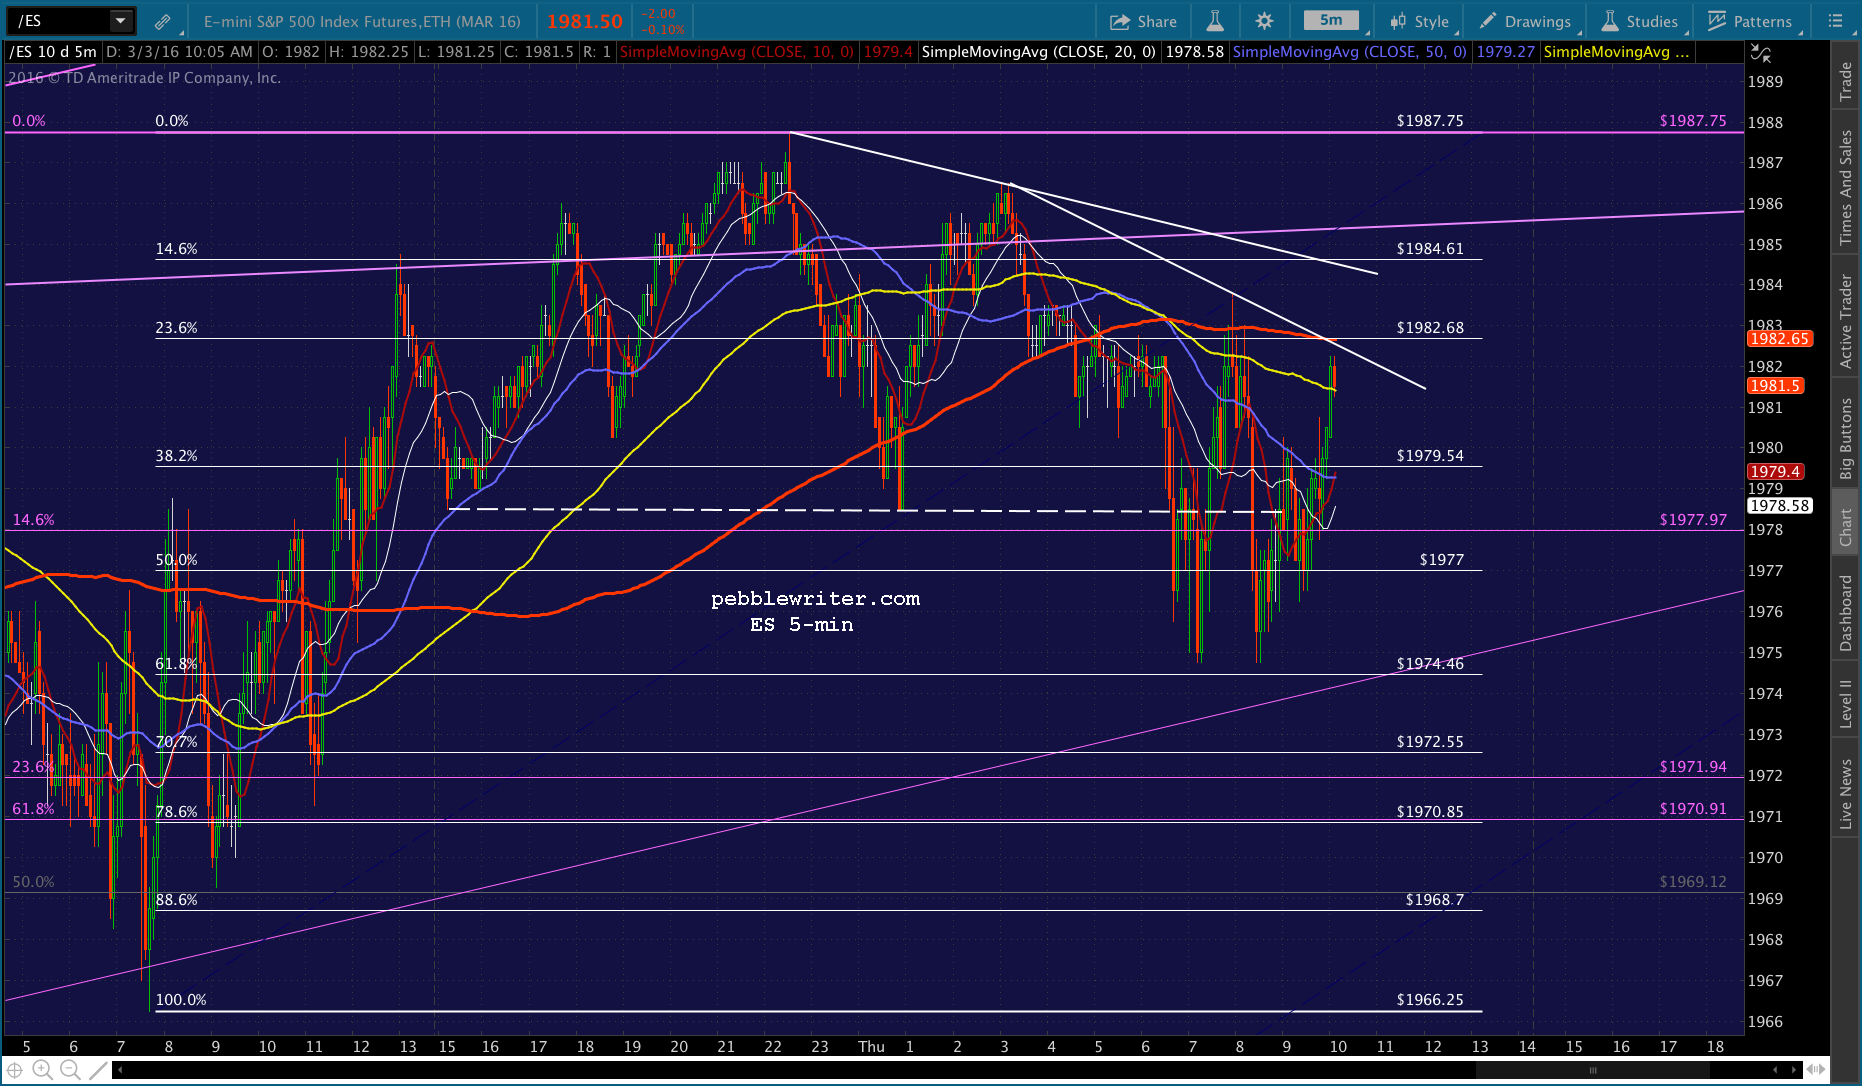 UPDATE: 1:10 PM
Probably the last try for the day. Shorting. UPDATE: 1:21 PM
Not reversing. I’m out. UPDATE: 1:24 PM
Got head-faked. I hate it when that happens. Back to short. If this play out, it’s just to get ES back to 1974.50 at the purple channel bottom in a few minutes. If not, then the drop is the head fake.
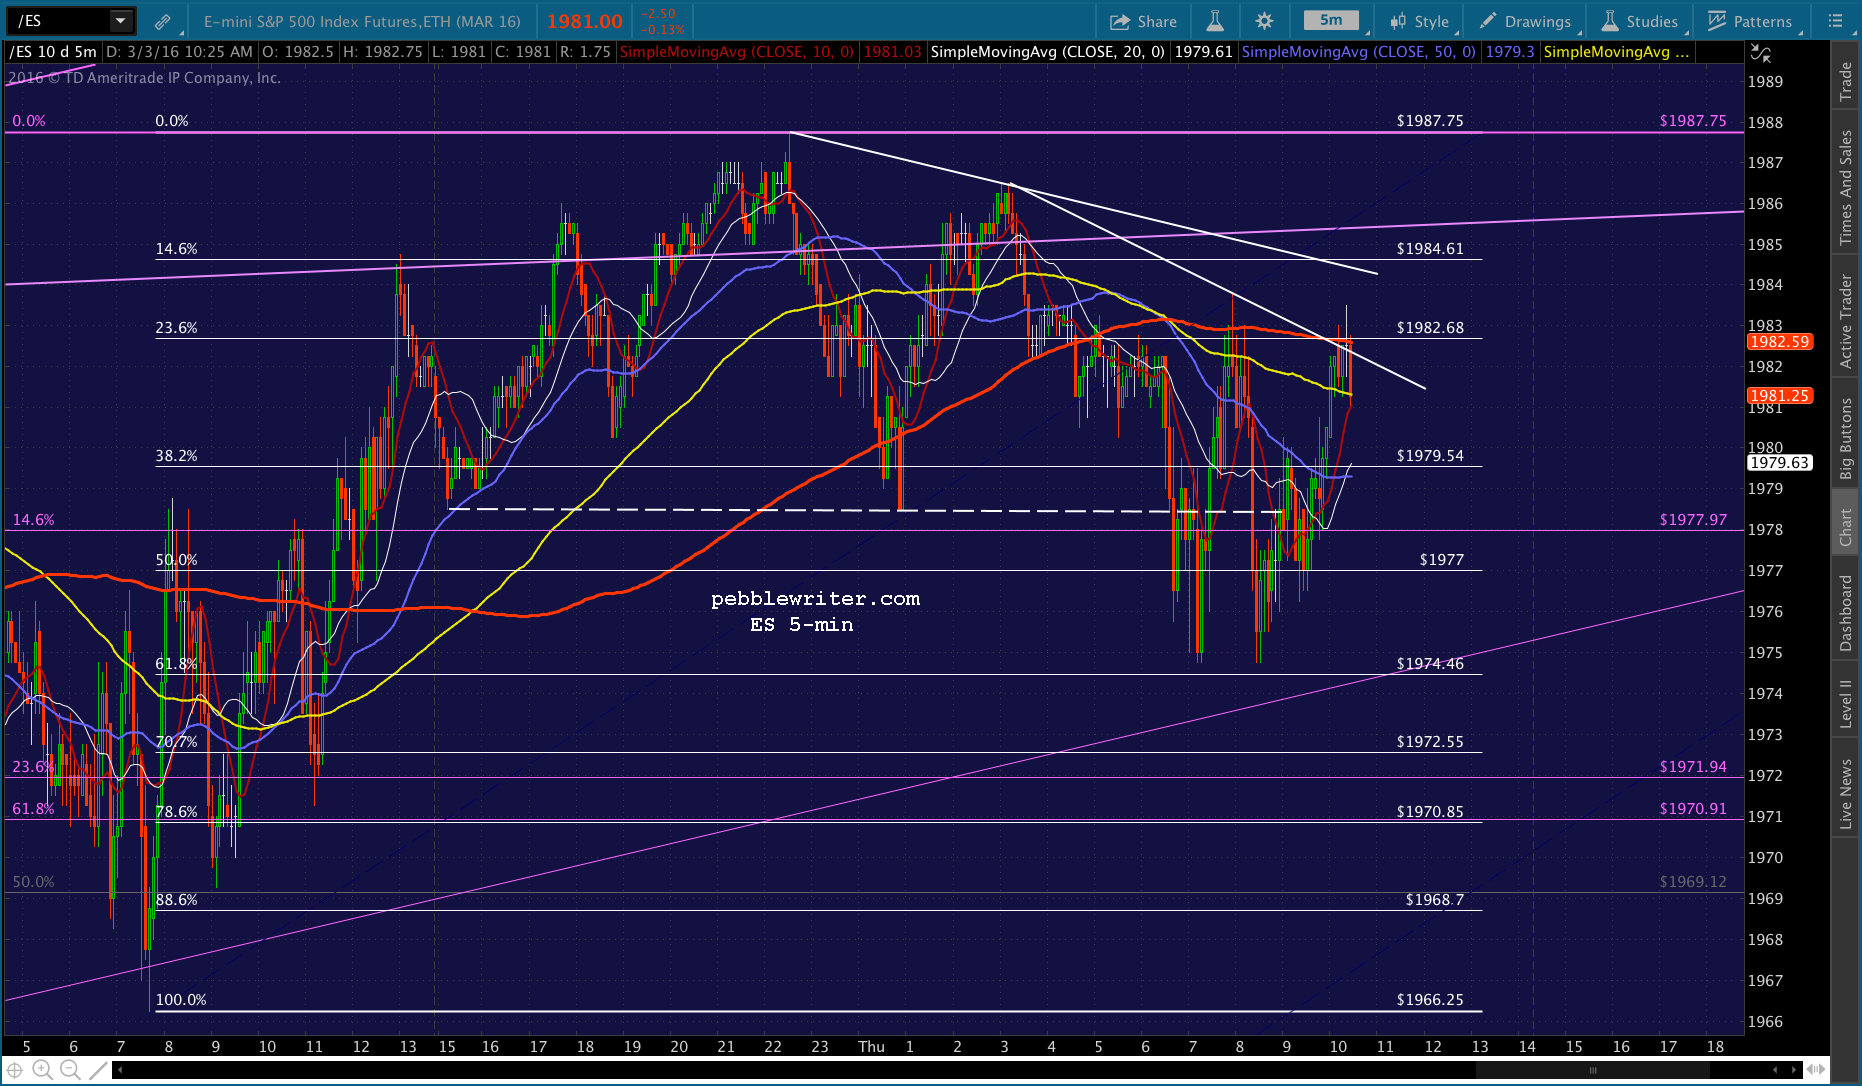 UPDATE: 1:31 PM
CL is spiking higher again. I’m done. If ES breaks above the top white TL, I’d go long. For now, I’ll salvage what’s left of my pride and go for a walk around the block. Maybe it’ll make more sense after I get back.
 UPDATE: 3:53 PM
ES just tagged the purple channel midline and, in any case, is a few points away from the .618 at 1993.36. SPX, meanwhile, is about 7 points shy of its target. I suspect it’ll drop here rather than try to surmount the resistance at the close. I’d revert to cash at this point rather than ride it into the close.
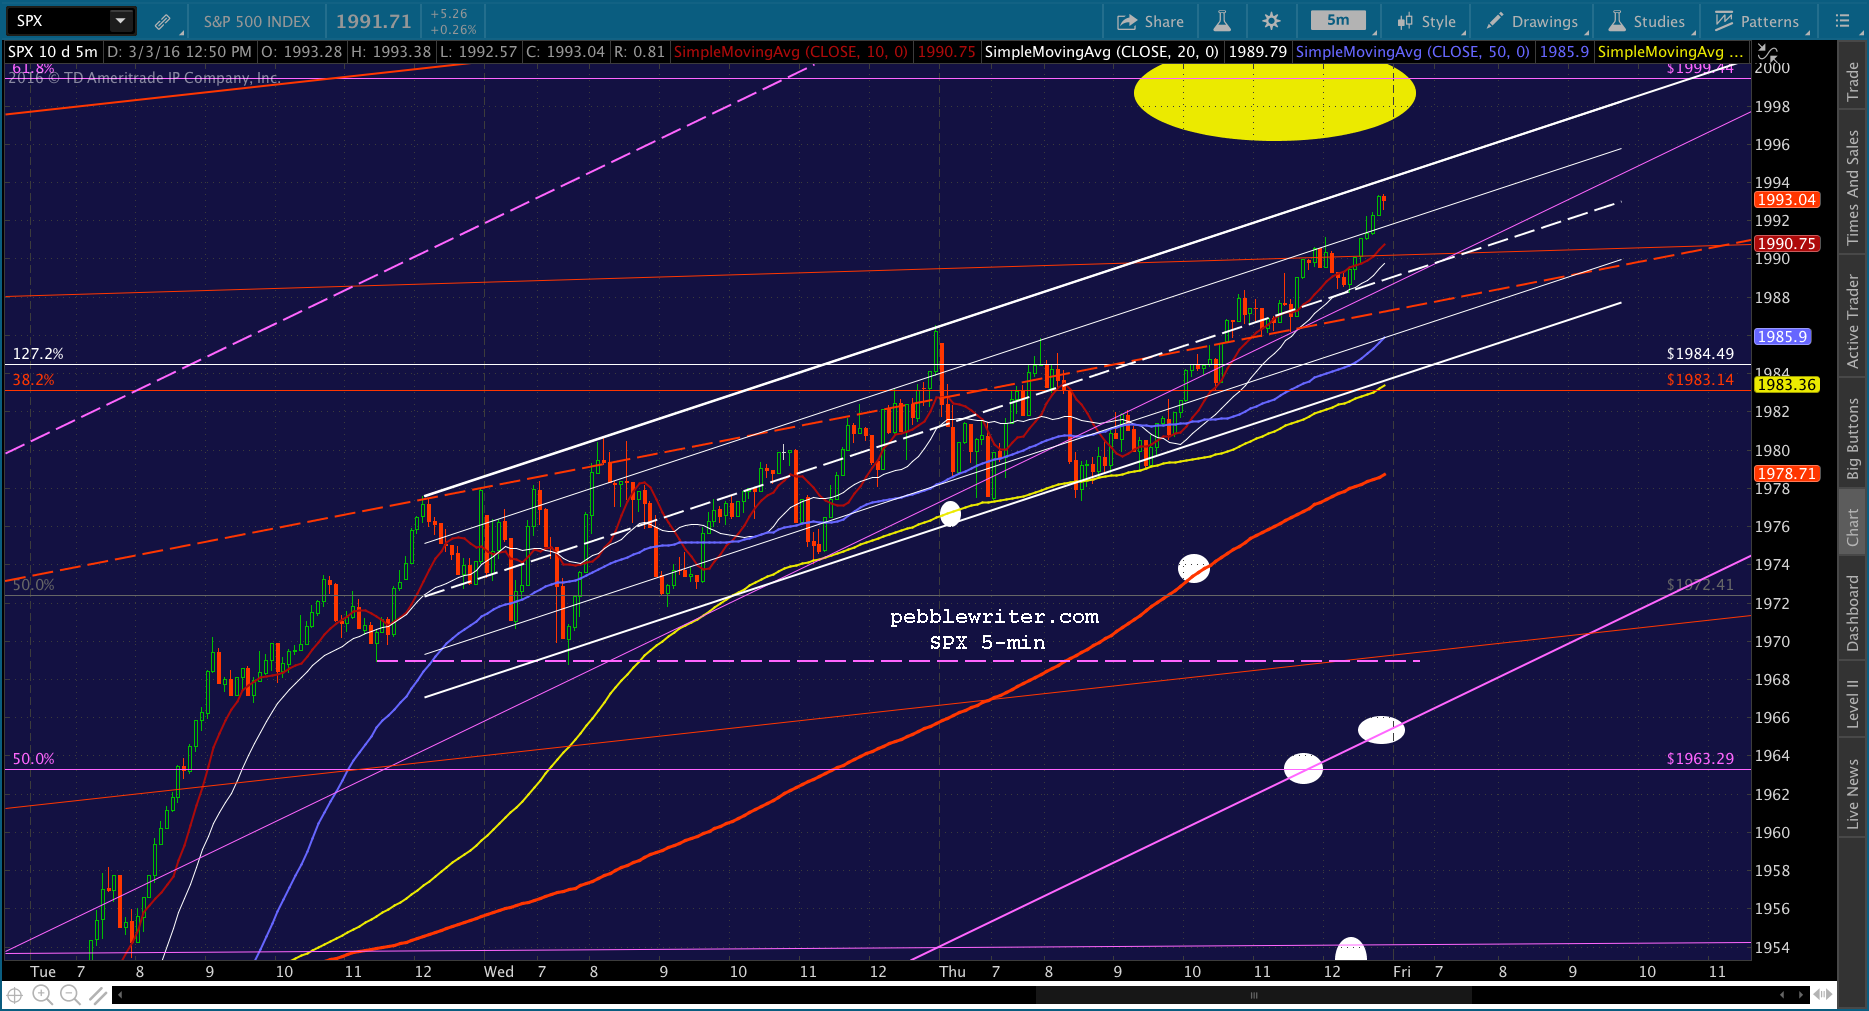 It’ll likely either gap above 1999 in the morning, or reverse and take more time before the attempt. So I’d rather not be long overnight with that risk hanging out there — even if it costs a few points.
The big picture on ES:

Comments
9 responses to “The Quiet Before the Storm”
Pebble,
thanks for the updates today, despite the frustration it was very helpful.
since we know that VIX is one of the tools being used to crank the markets, do you follow a VIX chart during the trading day for clues?
I usually have a 5 or even 1-minute chart open in the background, and often check it when SPX is at one of those points where it could break either way — particularly at the end of the day. It’s often helpful to see VIX break below a key moving average, TL or channel line.
Maybe the 3:30 ramp is the way to go with these quick moves…seems to be fairly consistent.
Any thoughts on why the SPX reached HOD’s starting at 3:30 – 4? Did it yesterday and today.
I think it did so because it was able to do so yesterday with such ease. If it ain’t broke… (though, in this case, it surely is)
R they trying to crash thd mkts sgain? Everytime such a rise we get an equal reaction the other way…
Not that I can tell. There have been many opportunities for it to reverse along the way. If they wanted it to crash, they could simply have left CL or USDJPY alone rather than continuing to ramp them higher. This doesn’t preclude markets from crashing. Things can always get out of control. 1999 should be a good test for their ability to keep the rally on track.
beside complete manipulation…what could possibly be driving CL right now to new highs? I can’t believe even “short covering” is able to do it to this level and with the data out there.
It is all manipulation, pure and simple. Short covering and stop running is an important component of the operation, but a result of the push higher — not the cause.