

It was a few short weeks ago we slapped a 1999 target on SPX for early March. 180 points later, we’re here — though it hasn’t been without drama. And, there’s likely more to come today. We’ll take a look at the path forward.
continued for members…
USDJPY’s trend remains intact – with no overhead resistance other than the recent Bat Pattern completion (the red grid.)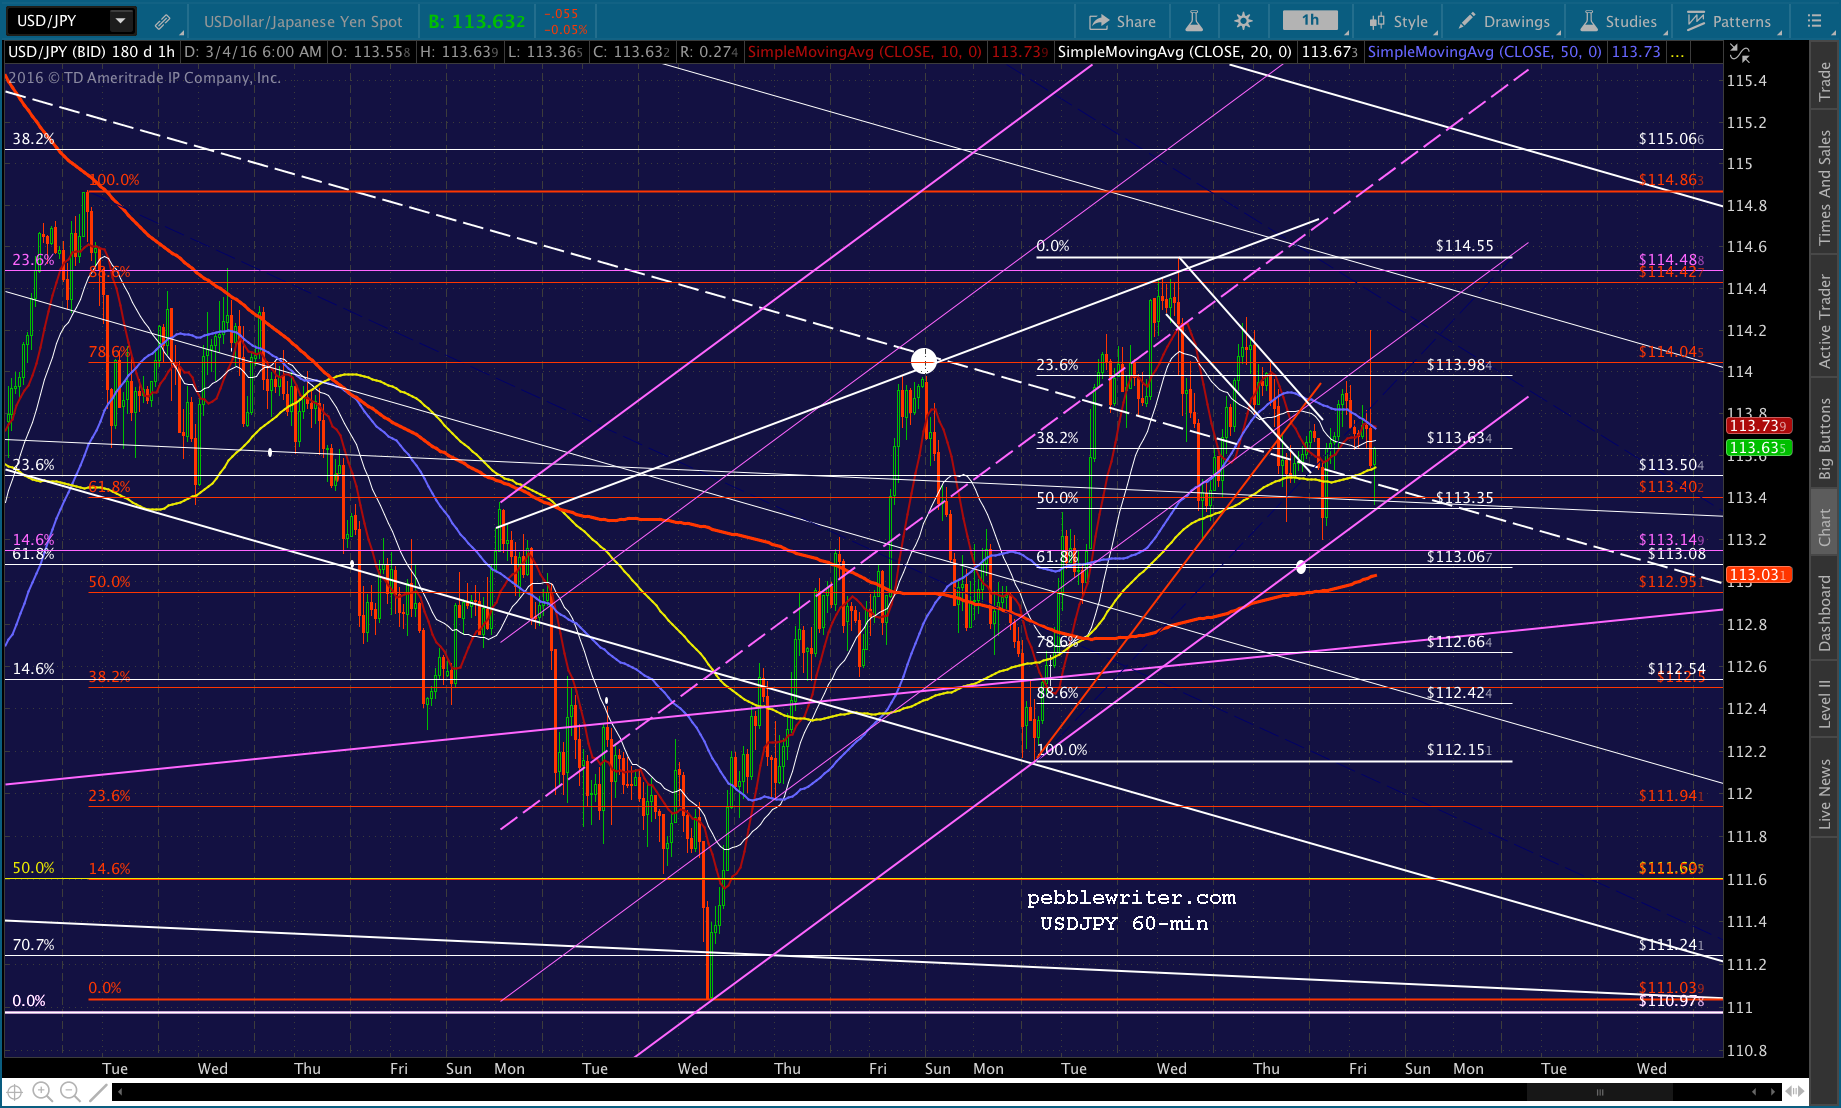 CL’s does as well, though, as we noted yesterday, it has reached short-term overhead resistance.
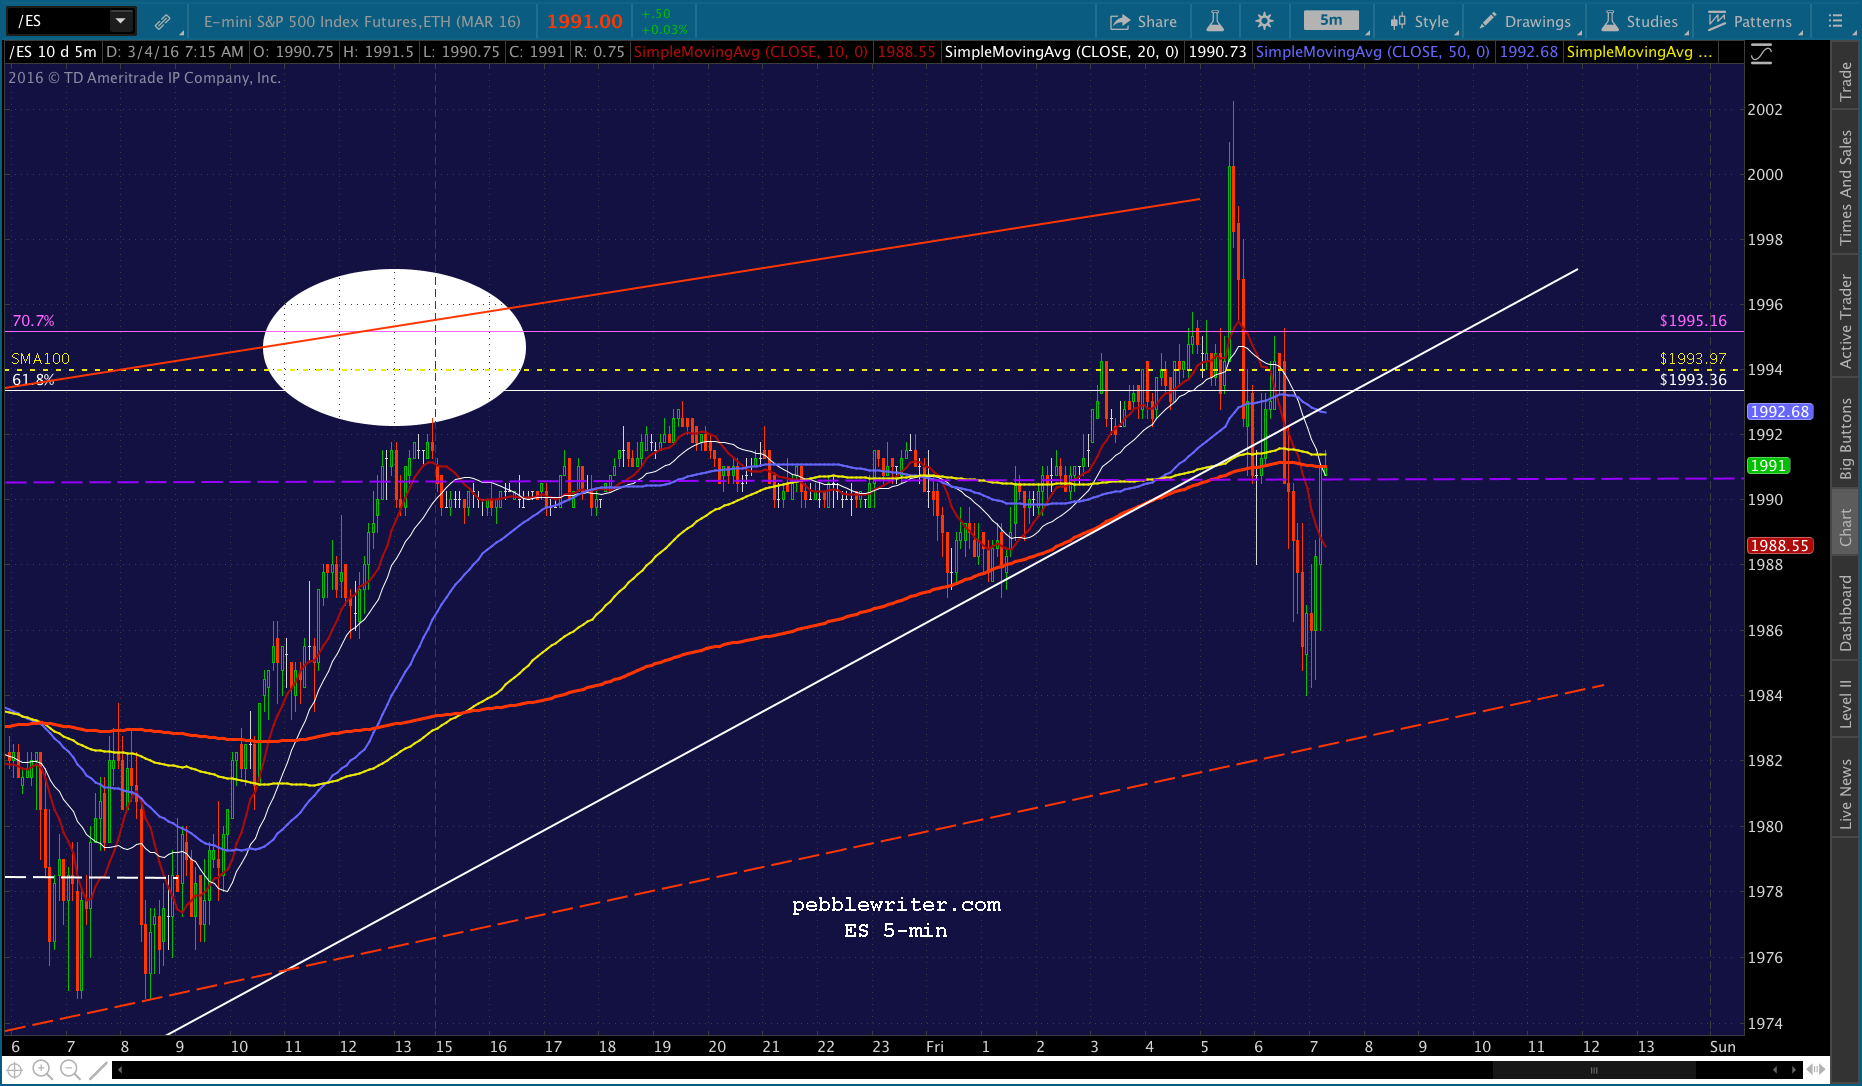
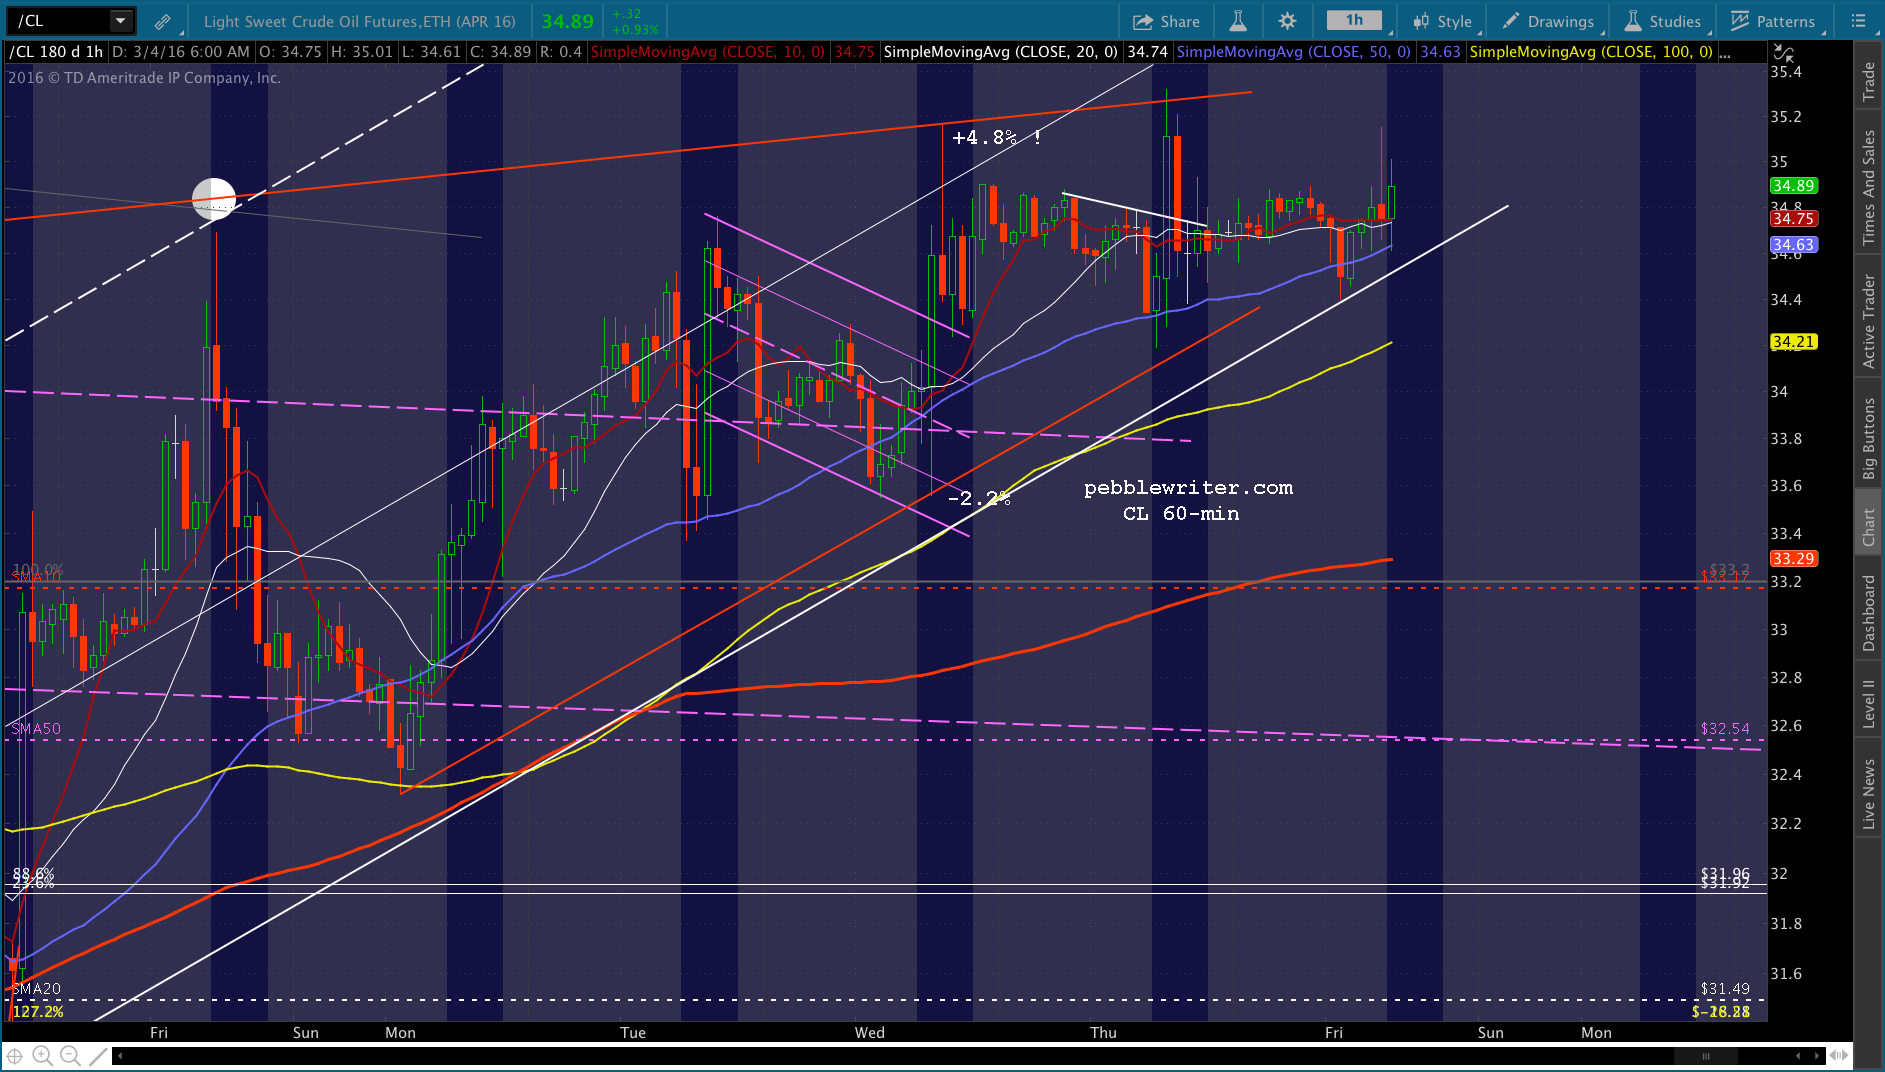 ES has reached its SMA100 and .618 Fib…
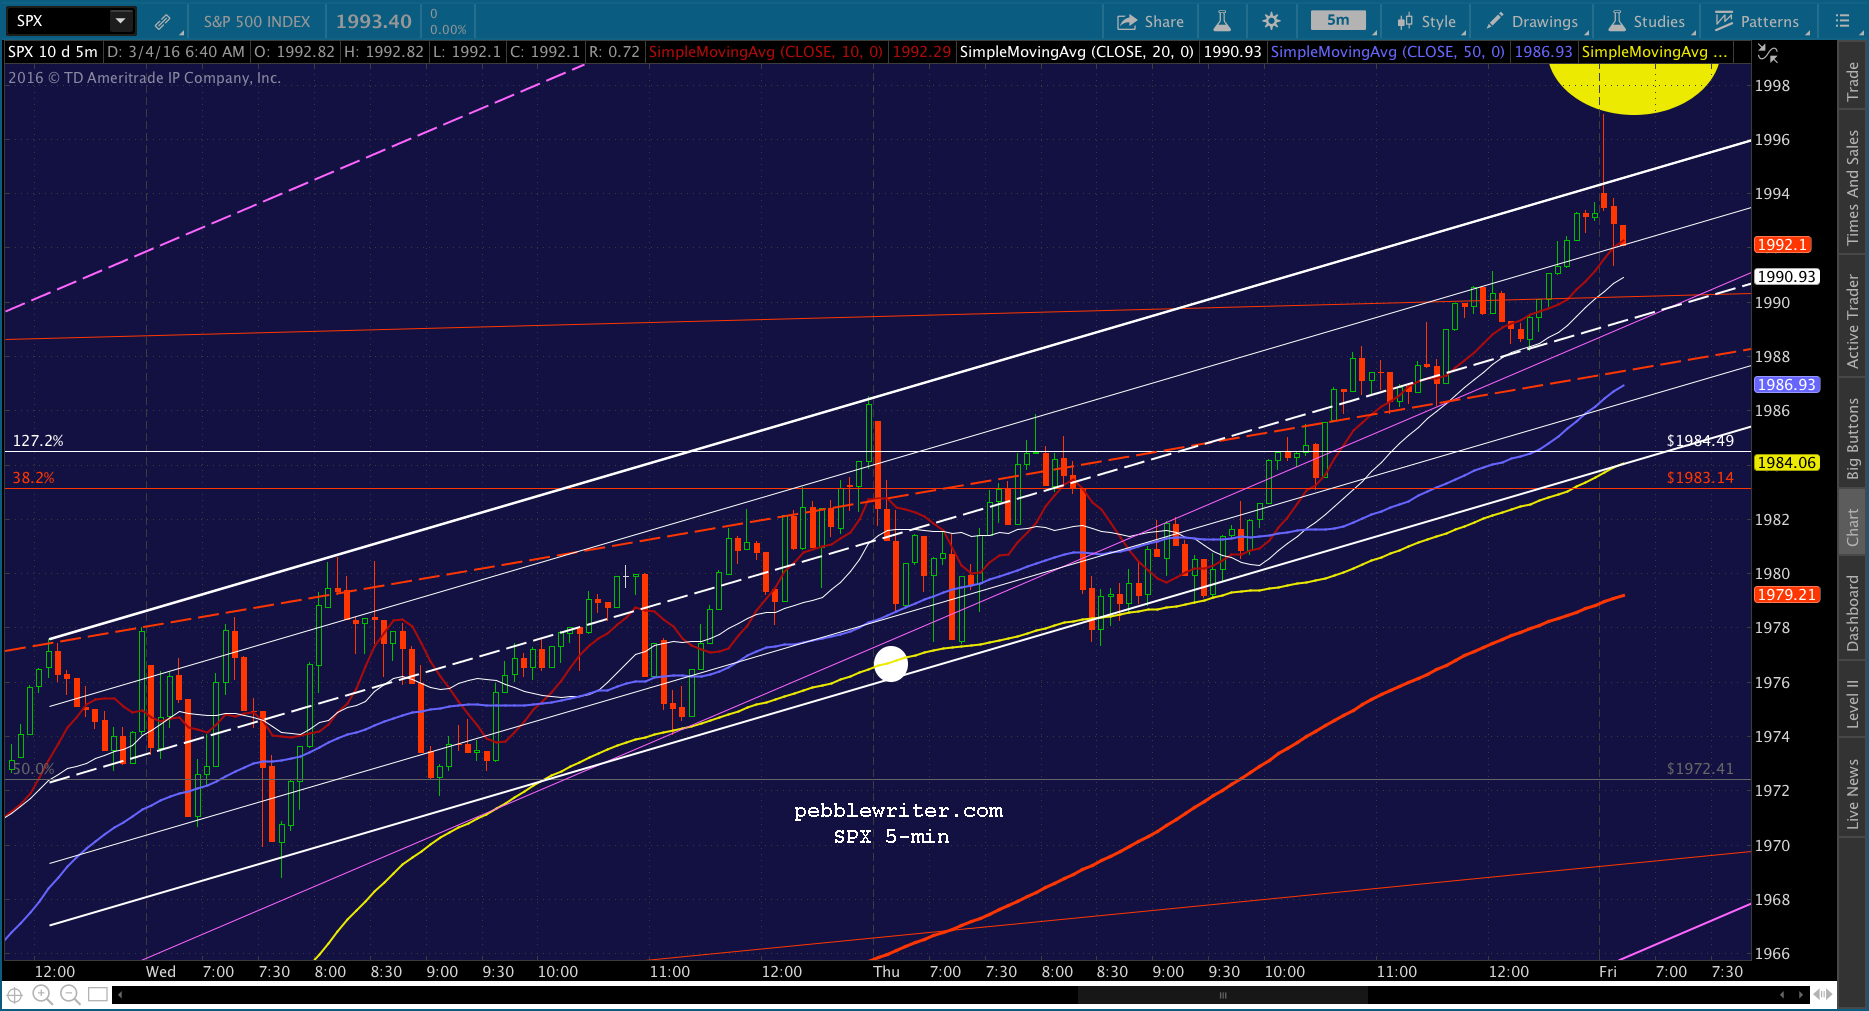
  …though SPX’s remains a few points away at 1999.44.
 I think the actual attempt on 1999 will wait until next week — after the weekend and potentially after the ECB policy announcement. So, I’m looking for SPX to tread water or even decline here.
It has shown a preference for the SMA5 100 lately, so it would make a decent short-term target at 1984. I’d short on any sustained decline through the SMA5 10 — now at 1992.
UPDATE: 9:40 AM
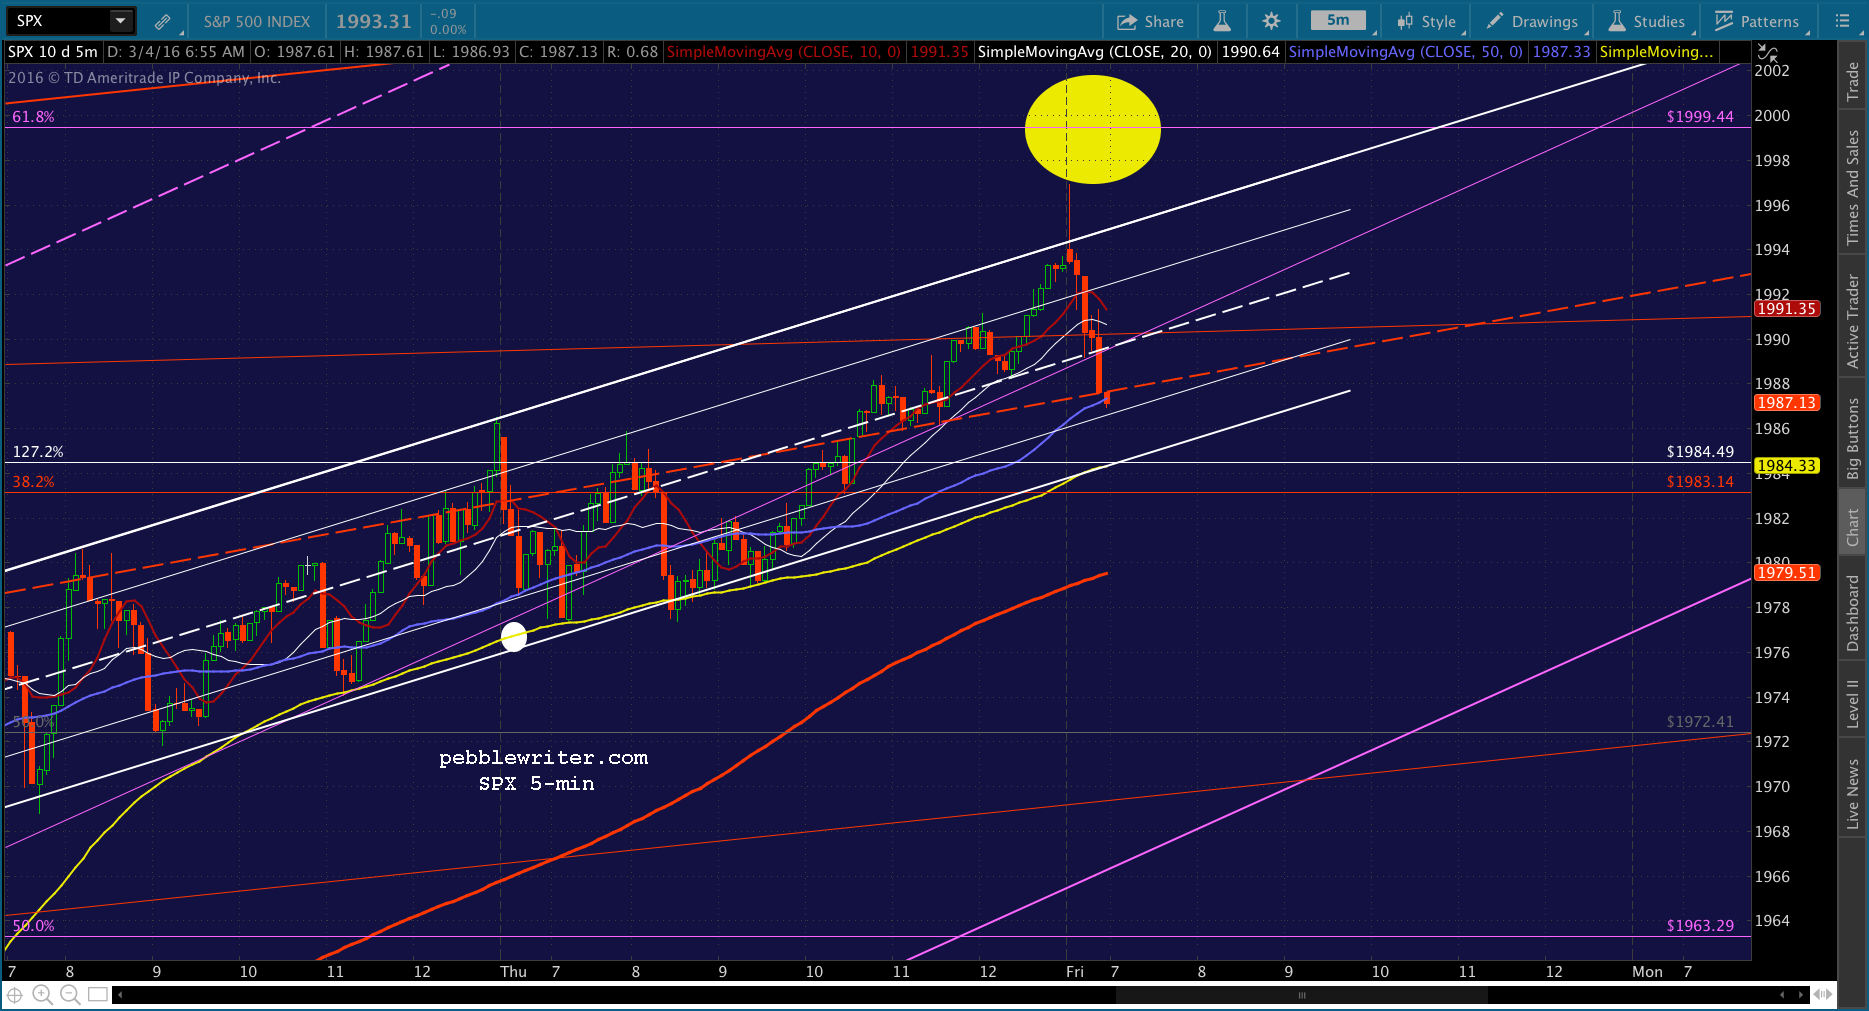
Shorting here for 1984.49. The initial support should come at the white channel midline around 1989.20, followed by the red TL around 1987.50 and the SMA5 100 — possibly when it reaches the 1.272 Fib at 1984.49.
 If the SMA5 100 should break down, then the goofy little white channel breaks down. That opens up the red SMA5 200, now at 1979, and ultimately the purple channel line down around 1972. But, CL and USDJPY’s channels would need to break down for that to happen.
Ultimately, I expect TPTB to keep SPX close enough for a pop up above 1999 come next Thursday’s ECB meeting.
UPDATE: 9:58 AM
SPX is bouncing a bit here at the SMA5 50 and red TL. It could bump up to the white midline, but from the ES chart, it appears there’s more downside to come. Back to cash for now.
 UPDATE: 10:01 AM
SPX has reached the white midline, with the SMA5 10/20 fast approaching. I’d revert to short here and see if we can get down to the 1984.49 target.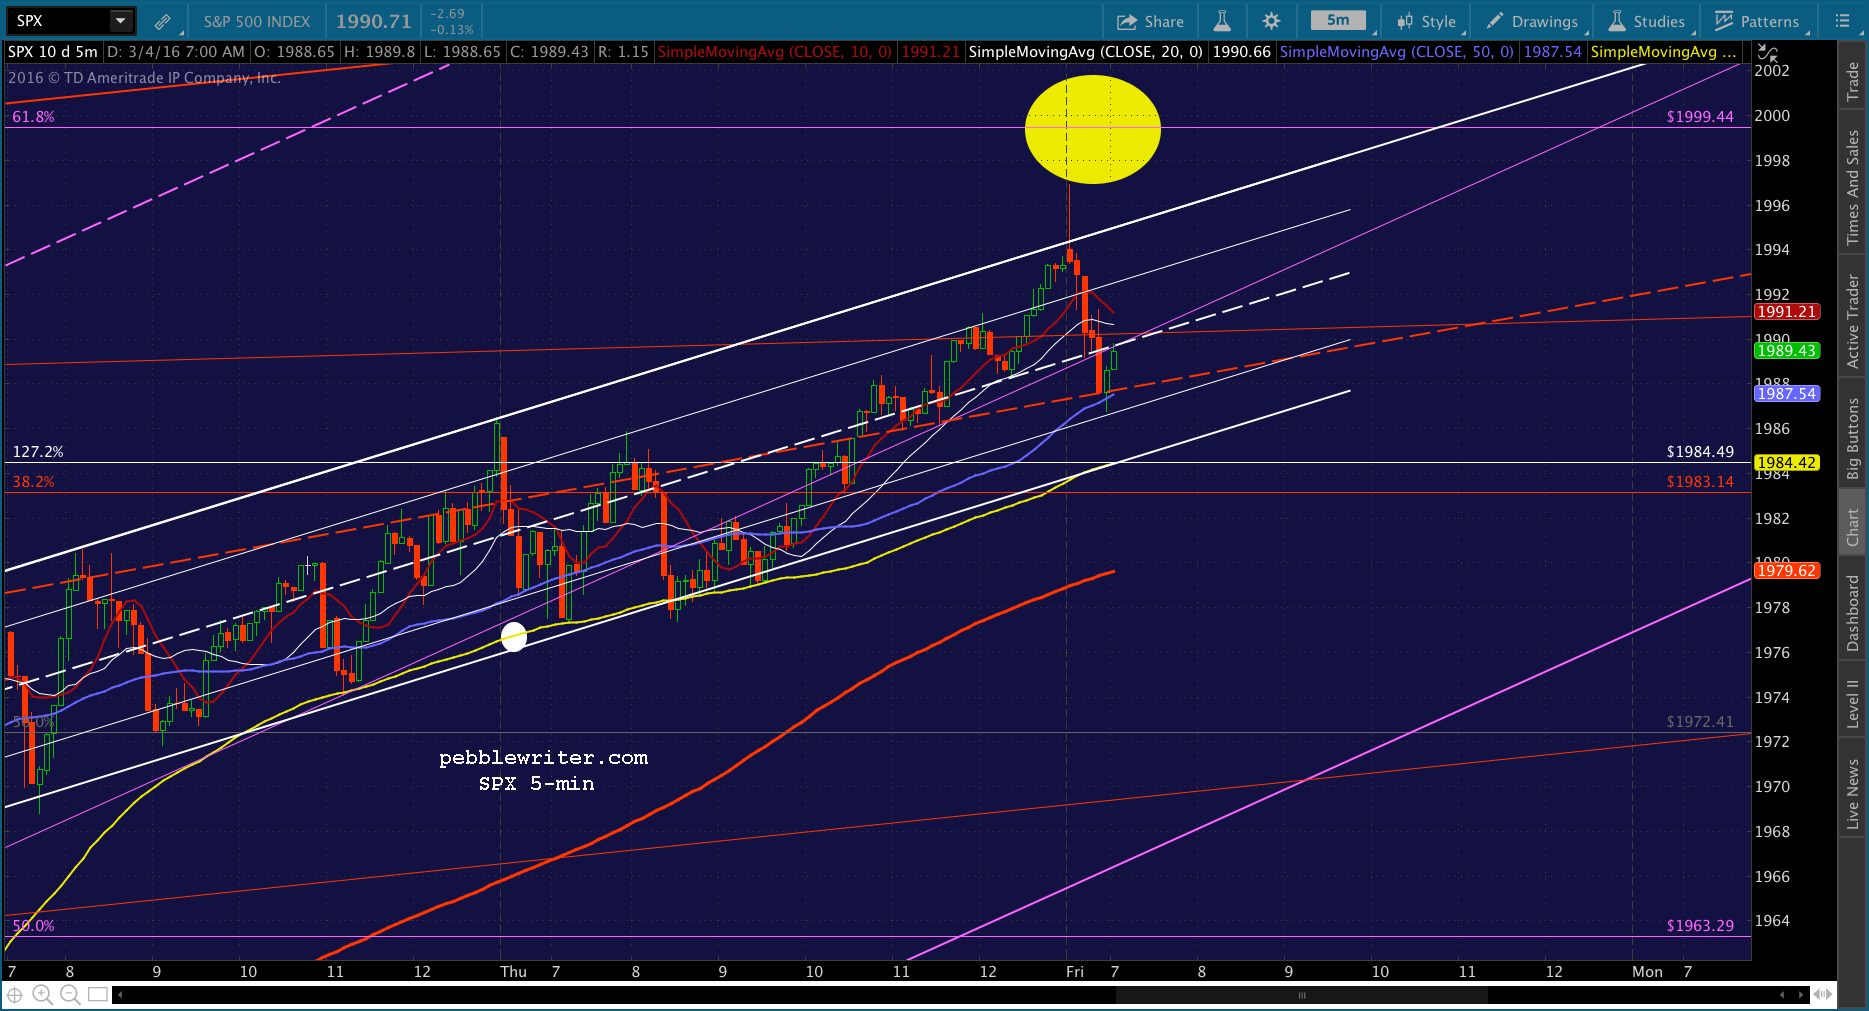 Note that USDJPY has broken the purple channel bottom and still has a ways to go before reaching its .618 at 113.08. NKD has also broken down and is probably headed for the purple midline.
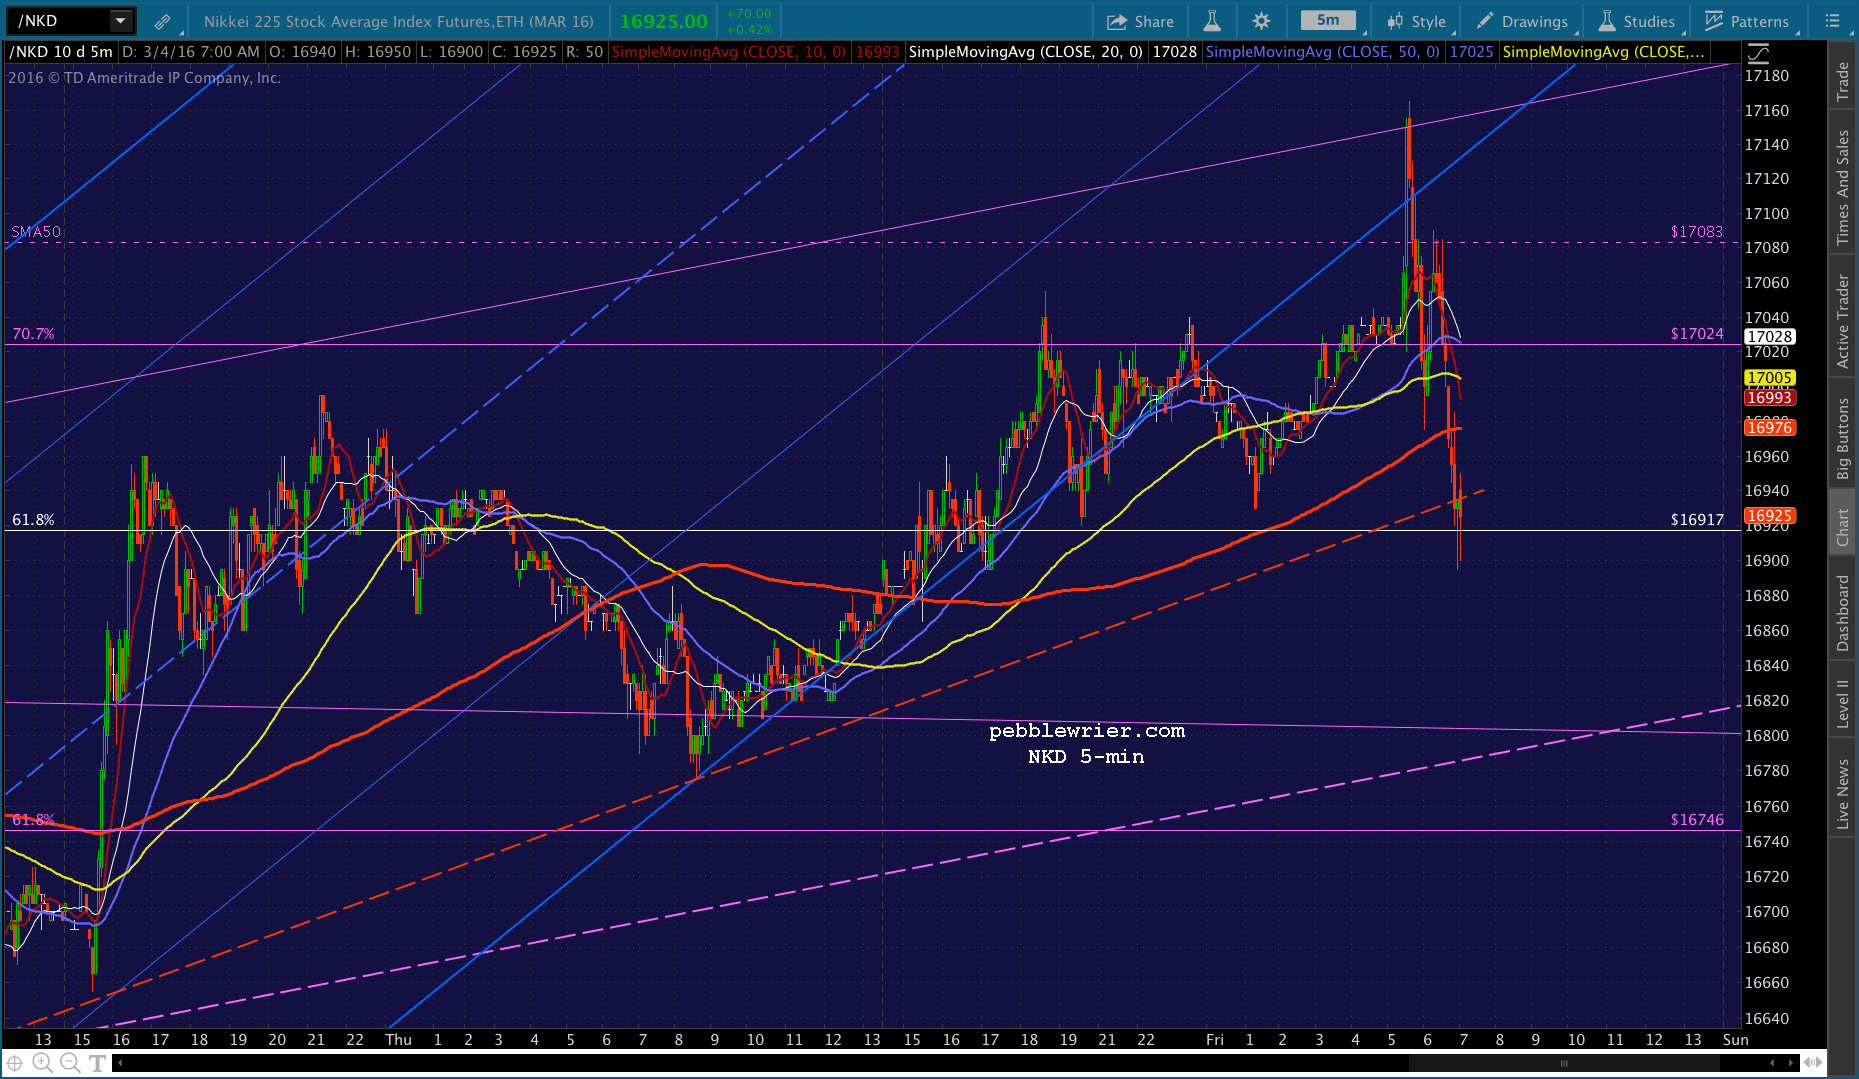
 UPDATE: 10:12 AM
Probably a head fake, but SPX is nudging up through the SMA5 10 here. I’d cut loose the short and revert to cash until it drops back through. UPDATE: 10:15 AM
Shorting again here at ES resistance.
 UPDATE: 10:35 AM
Giving up on a short position for now. USDJPY is being too buoyant here, and CL is starting to rev up. UPDATE: 10:41 AM
SPX is threatening to push beyond the white channel top. With the .618 only 3 1/2 points away, it should be easy. A little boost by USDJPY or CL could do it. But, a tag without a strong move by USDJPY or CL is likely to reverse. FWIW, the white channel intersects 1999.44 around 1:45.
UPDATE: 10:50 AM
It just reached 1999.38, which is close enough. I’d put on a short here, aiming for 1992 or lower. UPDATE: 11:06 AM
SPX is pushing up through 2000. I’d not chase it, but revert to cash here. And, I’d short it on any drop back through 2000 that also broke the SMA5 10 — now at 1998.
 CL just reached the red TL that has marked reversals 4 previous times.
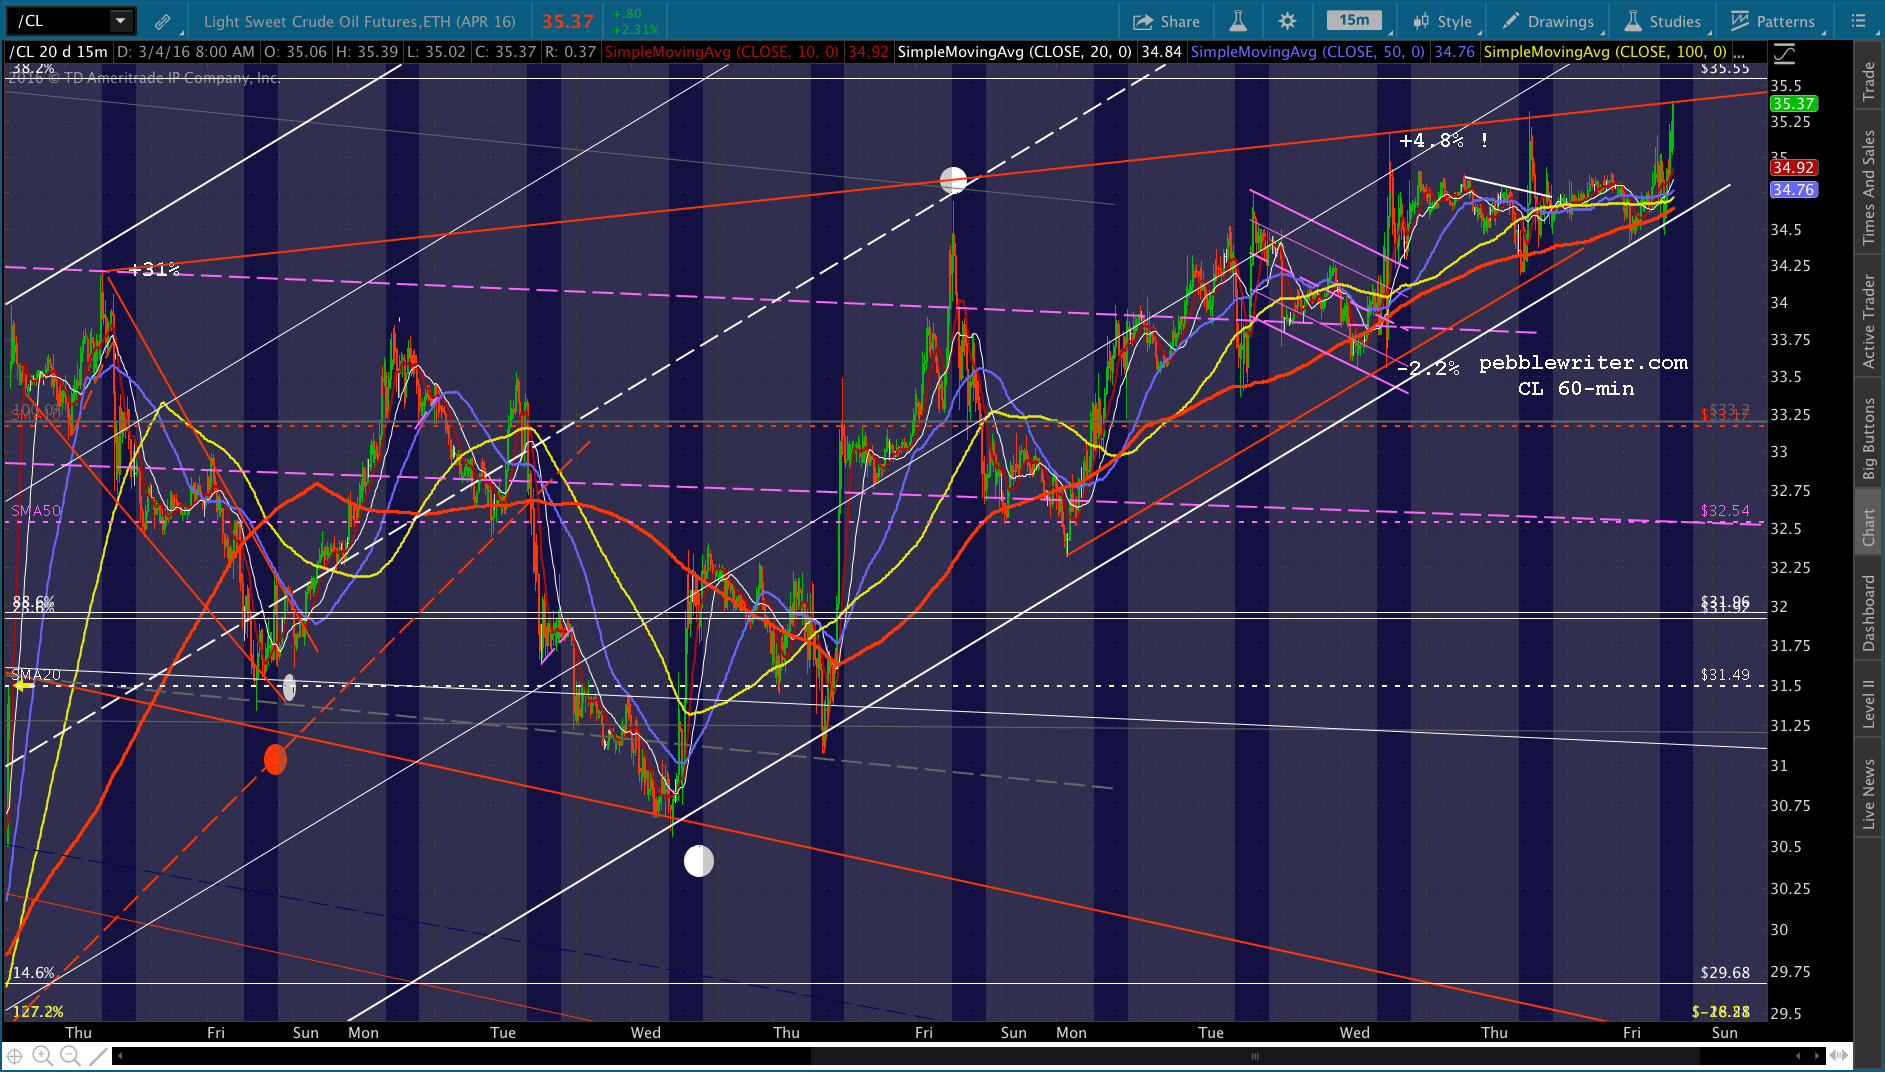 Don’t get me wrong, I expect TPTB to try to for 2050 — the purple .786 — but, not today. Or, even in the next few days. It could go on up via the rising purple channel, but I suspect it’ll start favoring the red, which means this should be an interim top — at the very least.
 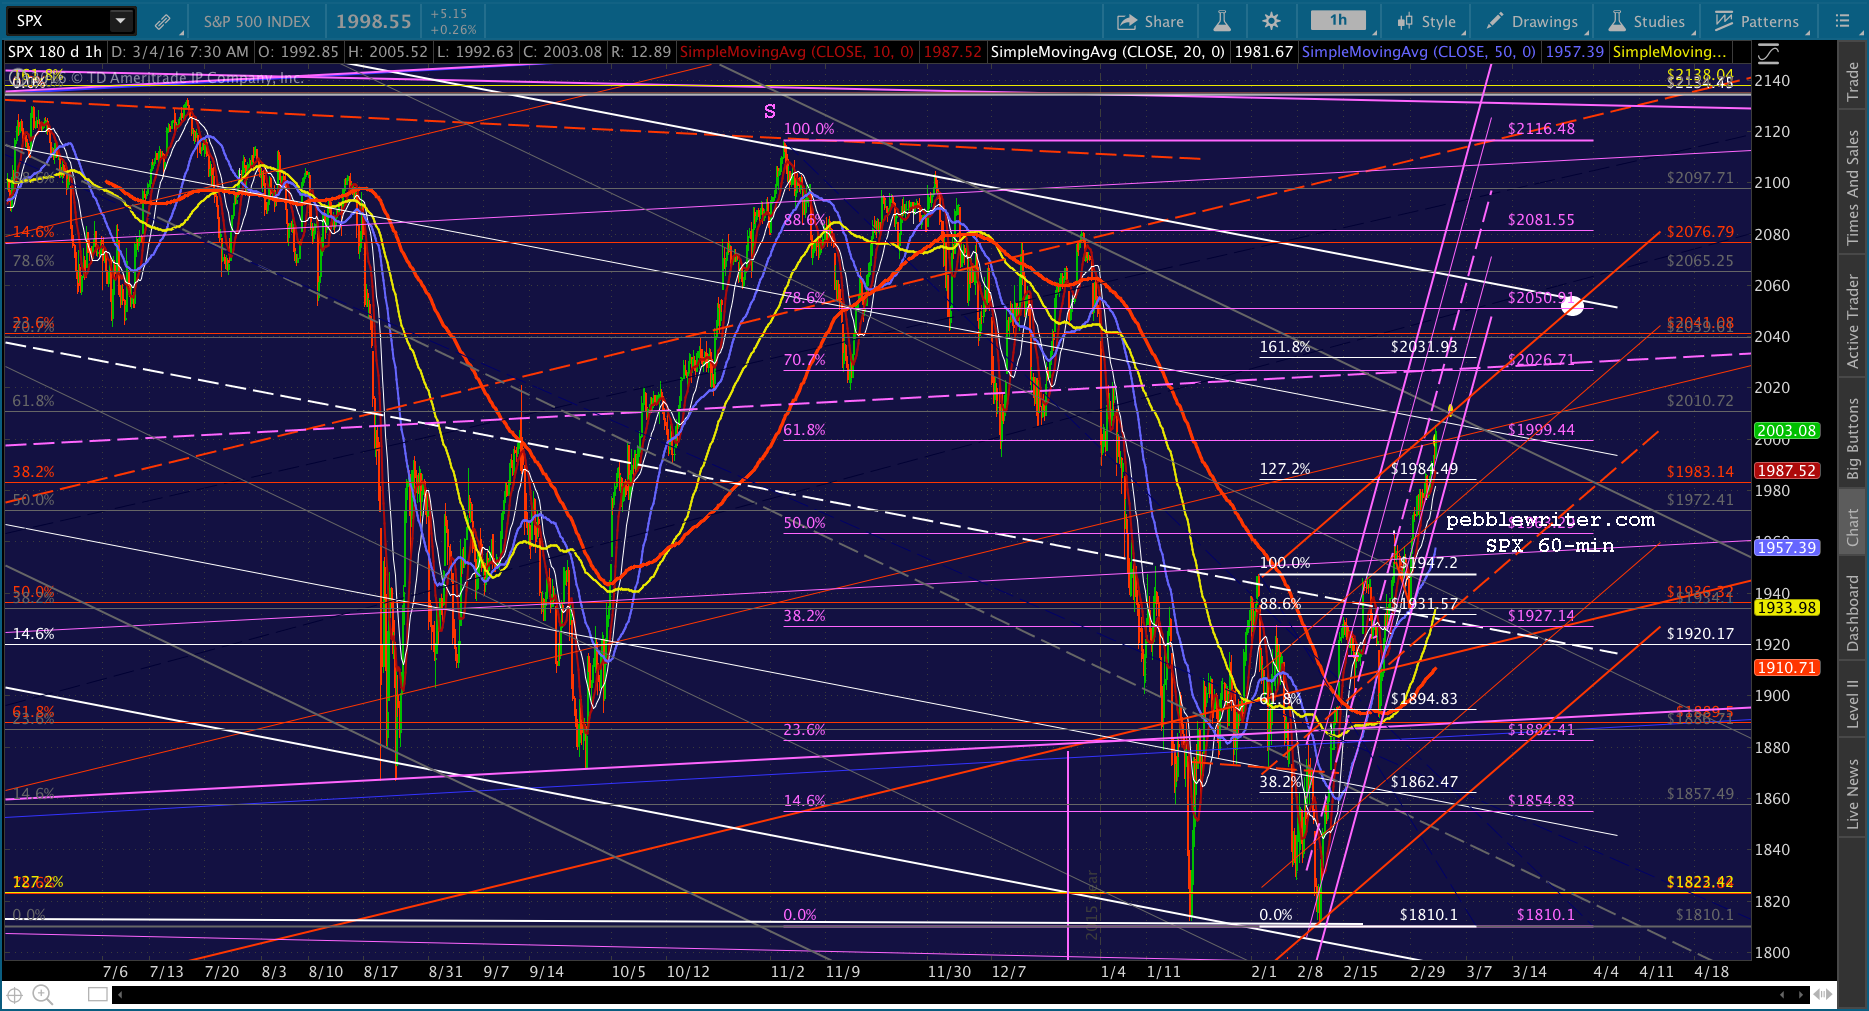 A more bearish case is that SPX has now completed a .618 corrective retracement of its losses from the 2116 to 1810 plunge, and could be about to embark on another leg down. I won’t discount this possibility, but it seems to me that they can keep SPX going as long as they’re willing to keep CL and USDJPY rising.
There are many fundamental economic reasons why this would be a bad idea, but I think they’re much more concerned with “markets” falling apart again than they are Mrs. Watanabe paying too much for heating oil.
We’ll see. I have to run some errands, so I’ll just leave a standing order to short if it dips back below 2000, with tight trailing stops no higher than 2000. If it does drop through, it could find support at the purple .236 line (now at 1993 and rising to 2000 by EOD), the SMA5 100 now at 1987, or the purple channel bottom (now at 1970 and rising to 1976 by EOD.)
UPDATE: 2:50 PM
Quick update…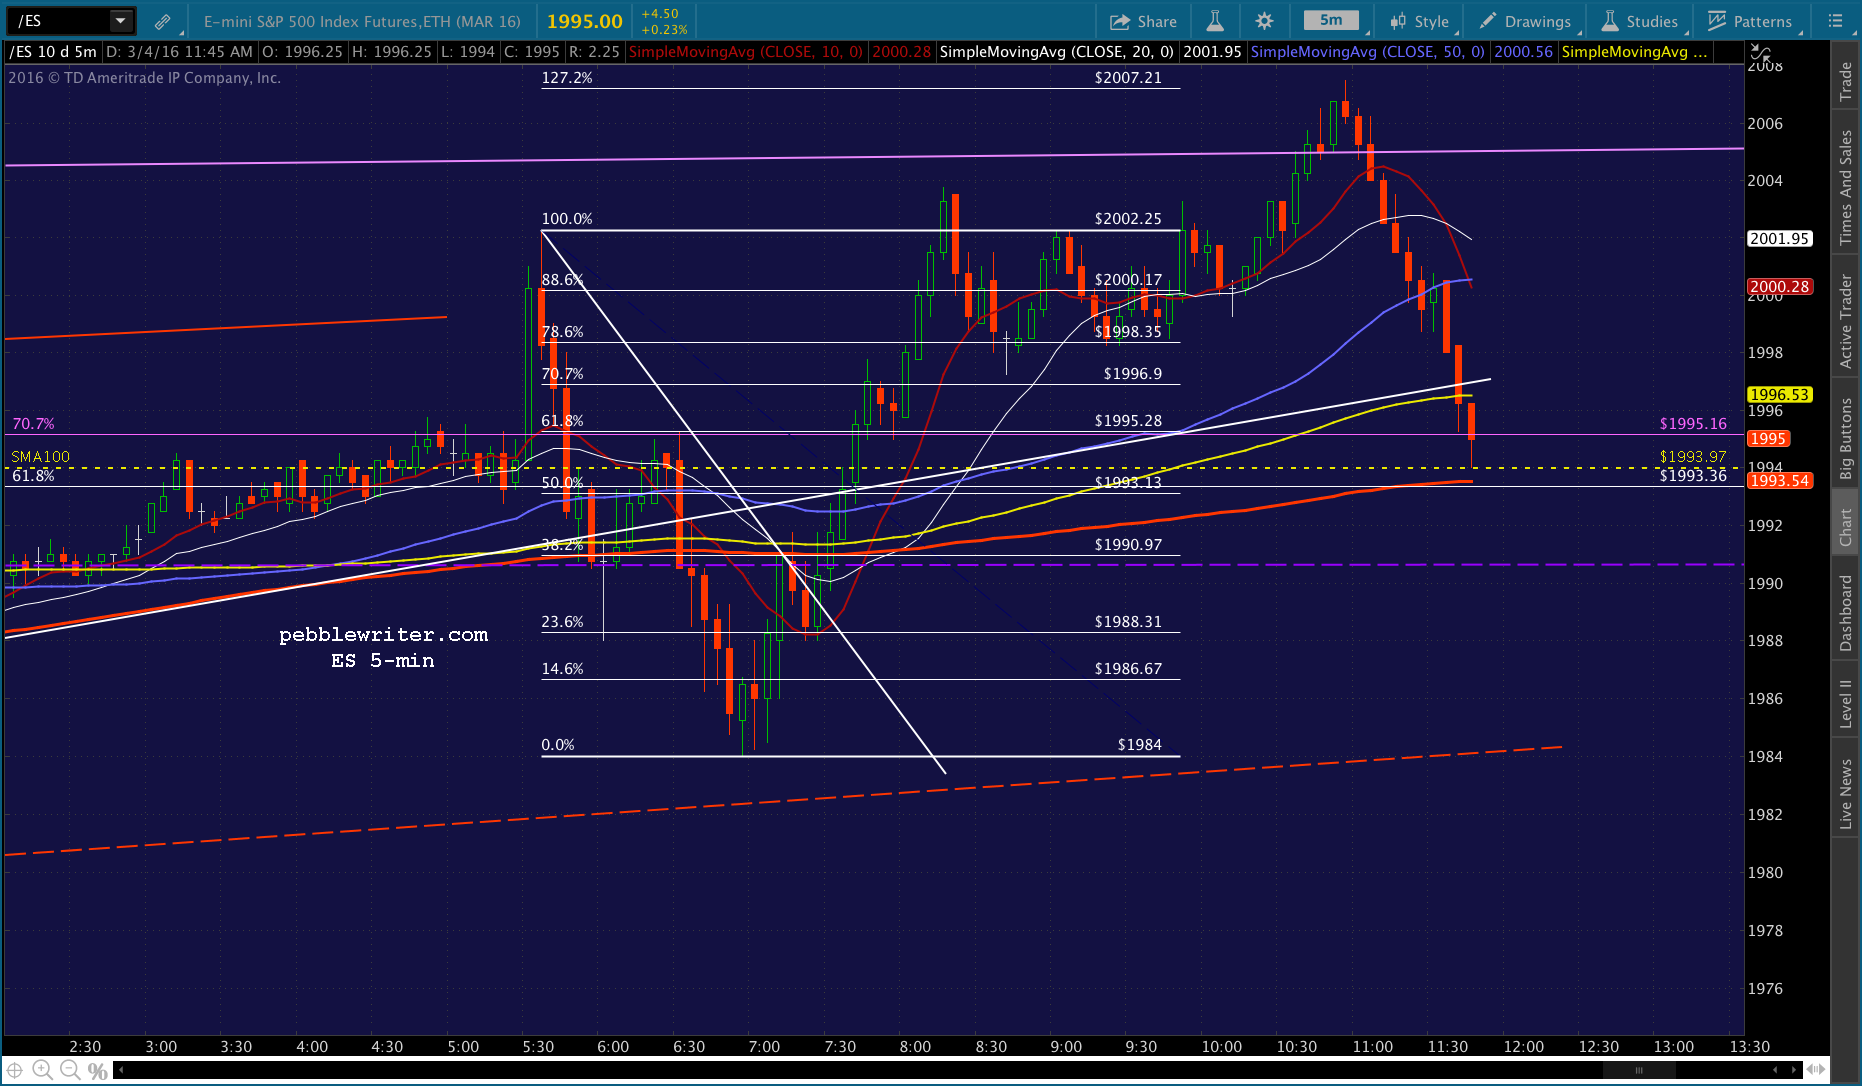

Comments
3 responses to “We’re Here…Now What?”
Volume-less flotation. Looks to me that the goal was 2023 (78.6%), but not sure we can get there. They love to have the markets at round numbers 2 weeks from a big OPEX (so 2000 and 17,000). My guess is that Draghi finally disappoints next week or there is some Fed chatter over the weekend about March. That will cause the big boys to have to scare the central bankers again.
On a side note – pretty likely the BOJ is pushing the oil markets now. The wild swings scream central bank meddling. If so, and the central bank of a 100% energy importing country is propping their market pushing oil higher, that is not only perverse but also traitorous
Maybe I dont have the fact, it seems like gold and crude oil go up or go down in sync. (they are commodity and can be manipulated) Since gold is bouncing a lot since this year, should we expect oil to bounce the same degree? Look at the 1 month or 3 month chart of GLD.
CL has bounced much more than GLD since the Feb 11 lows. But, CL was dropping while GC was soaring from 1/1 to 2/11. I think GC is more in sync with moves in the USD, and wouldn’t necessarily trade it based on oil’s moves.