Yesterday, I had one of those conversations that pops up every week or so. This time, it was a tech executive who was up to his eyeballs in tech stocks and was growing very, very nervous. He wanted to know if/when he should get out.
I’d just seen this chart from Christian Mueller-Glissmann of Goldman earlier in the day. It reinforces what many of us believe about the recovery: we’re treading on dangerous ground. I conveyed the info to my new friend, who replied exactly as I knew he would, “I’ll just have to get out whenever things start to get ugly.” Many investors have seemingly resigned themselves to the musical chair approach. Hopefully, they’ll be able to grab a chair when the music stops. Listening to Powell’s testimony yesterday, there’s no reason to believe the Fed will willingly preside over such an event.
But, are things entirely under their control? Can they keep the music playing for another few months or years? Looking at the destruction of VIX, it’s easy to assume they can.  Yet, there are some natural limits to the means by which the market has been driven to these heights. And, given that over 80% of daily volume is now machine-driven (algos, indexers, closet indexers, ETFs, etc.) perhaps a better analogy would be a crowded theater whose patrons are all eyeing the exit just in case someone yells “fire!”
continued for members…
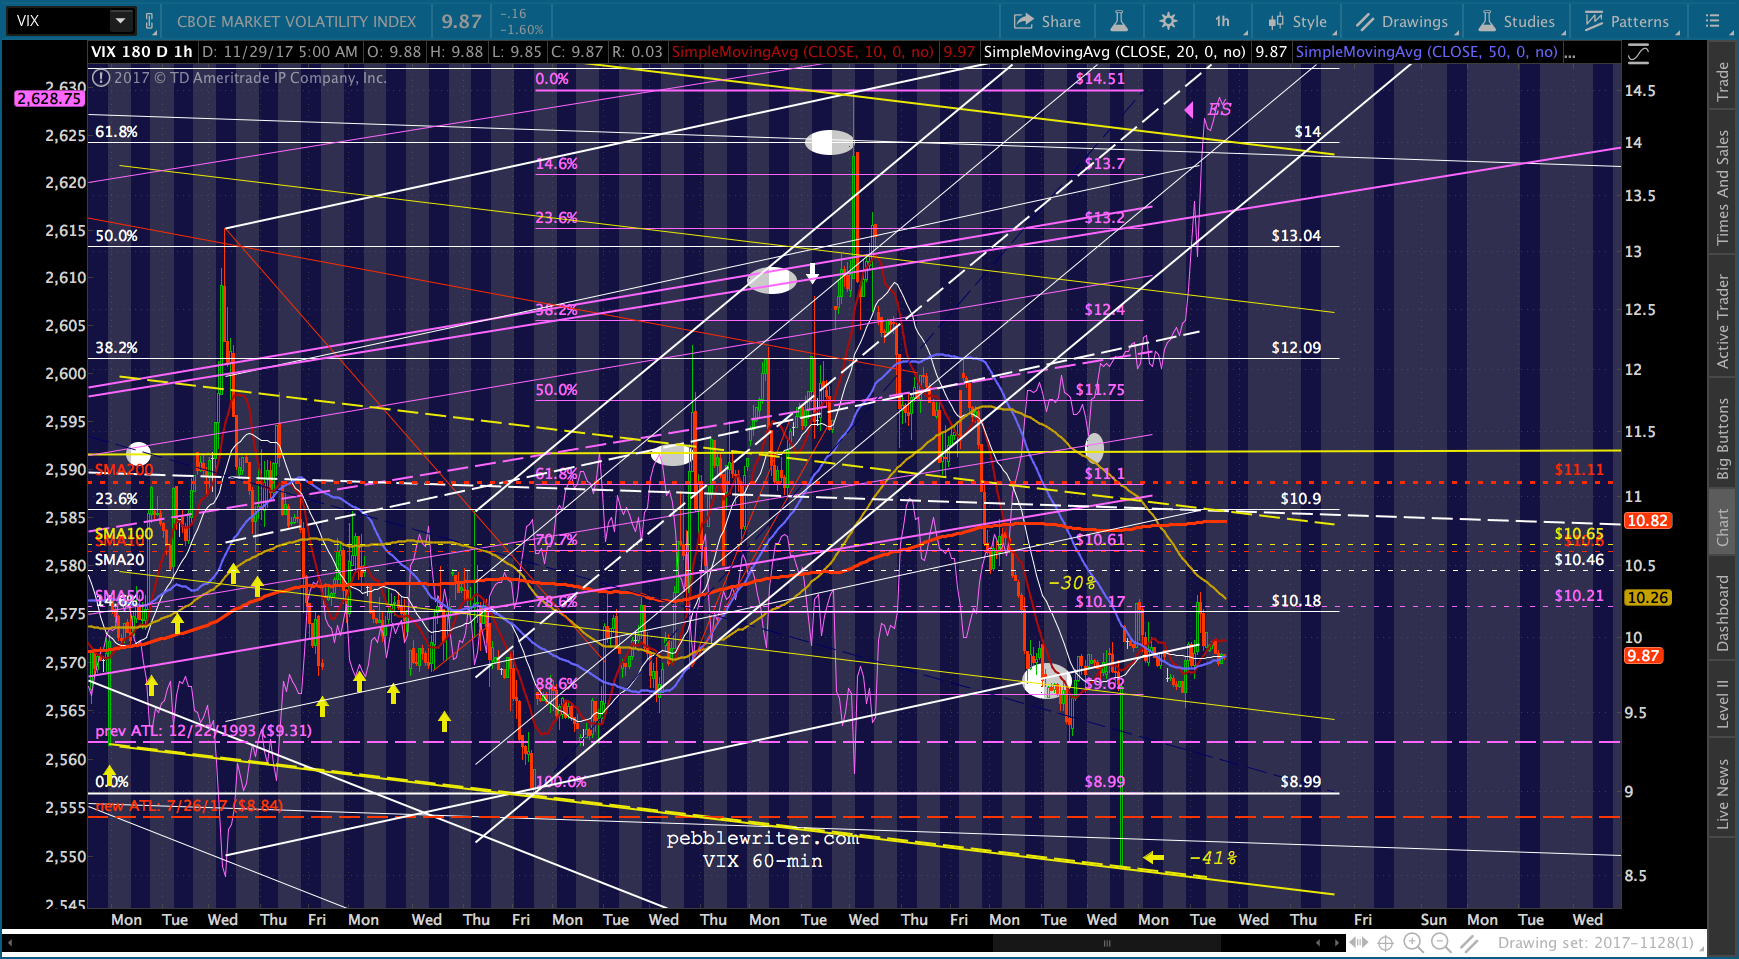
The new highs of the past few days have been a combination of VIX suppression…
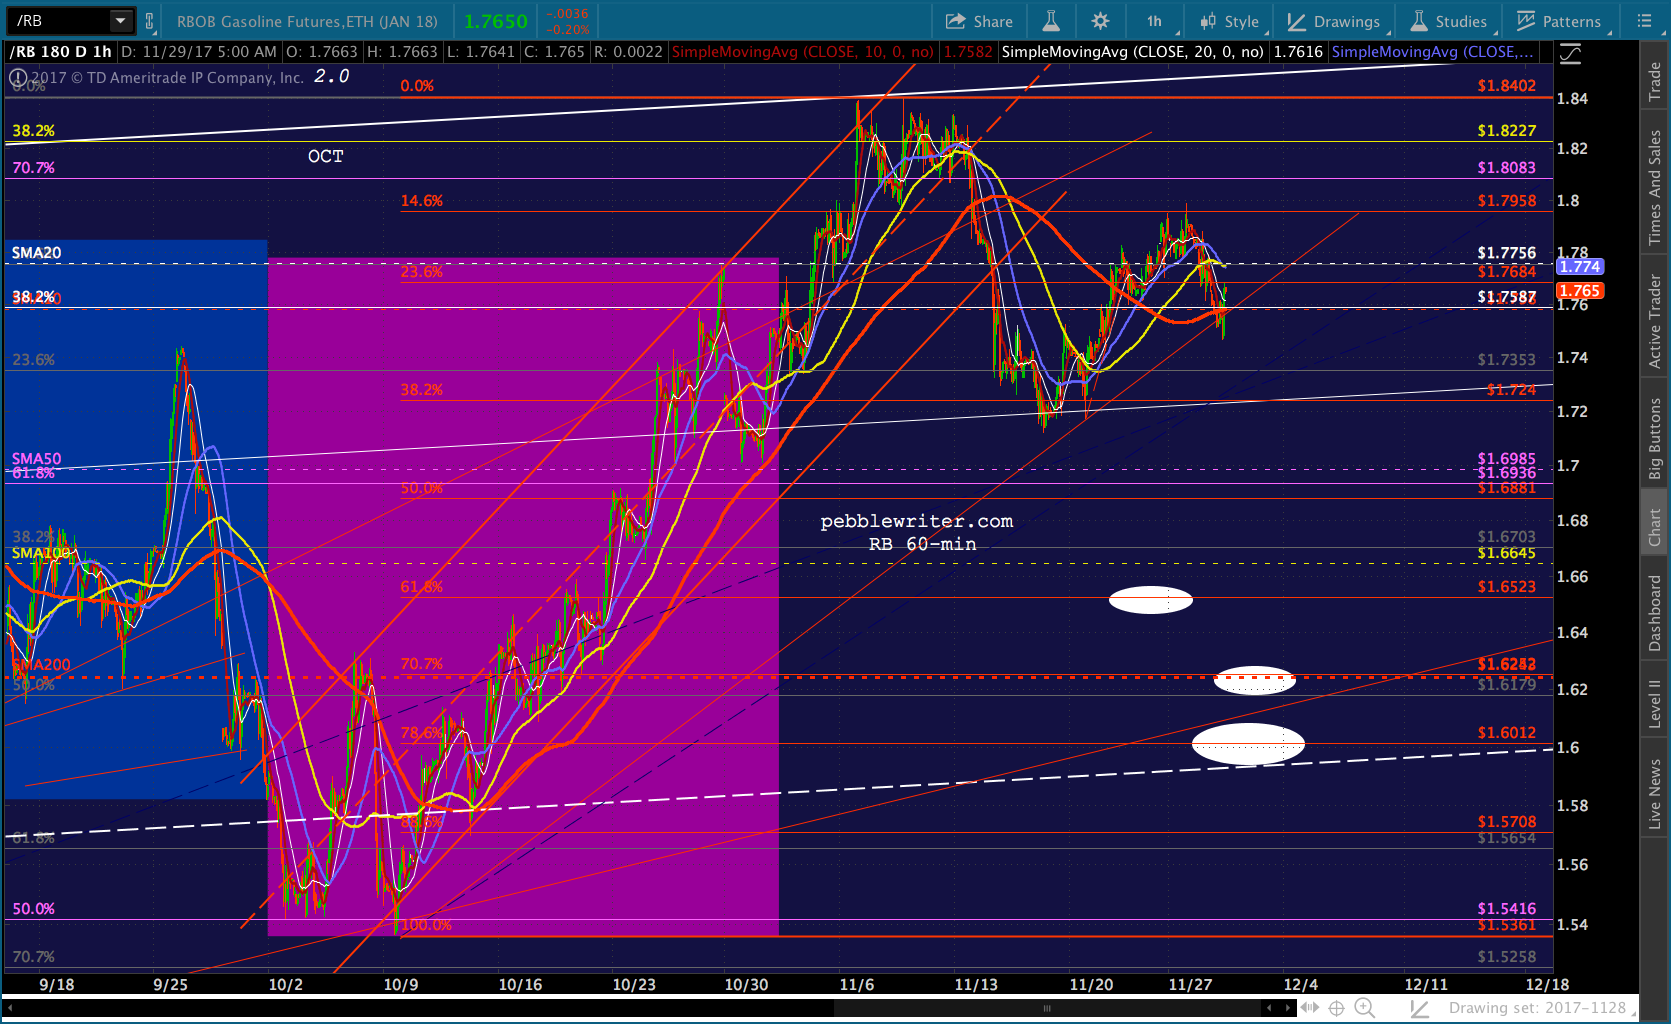
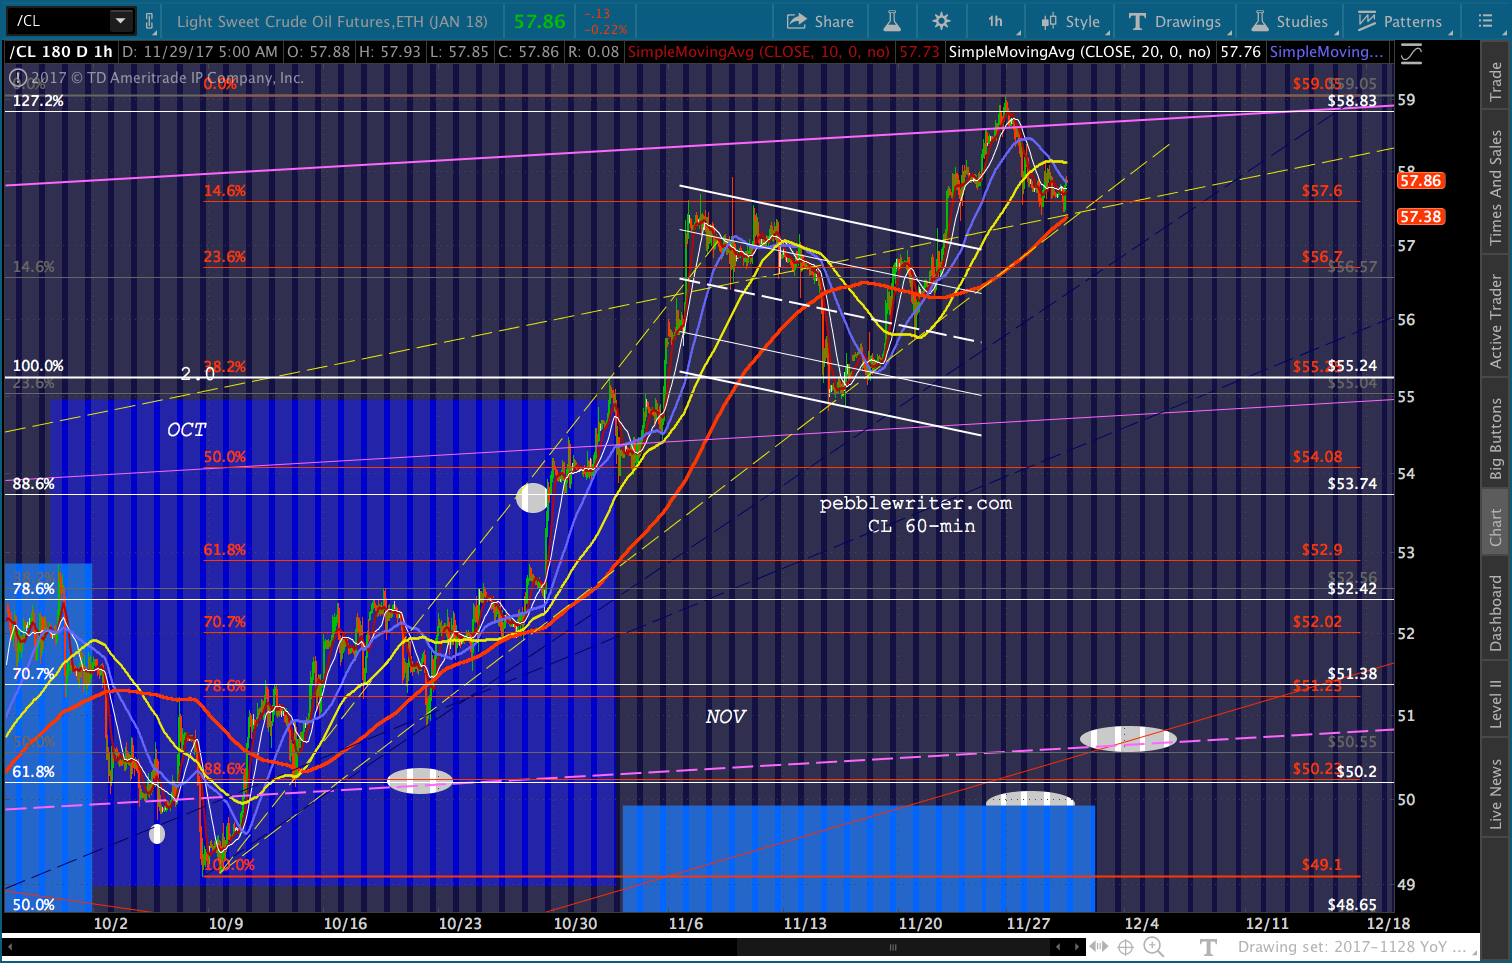
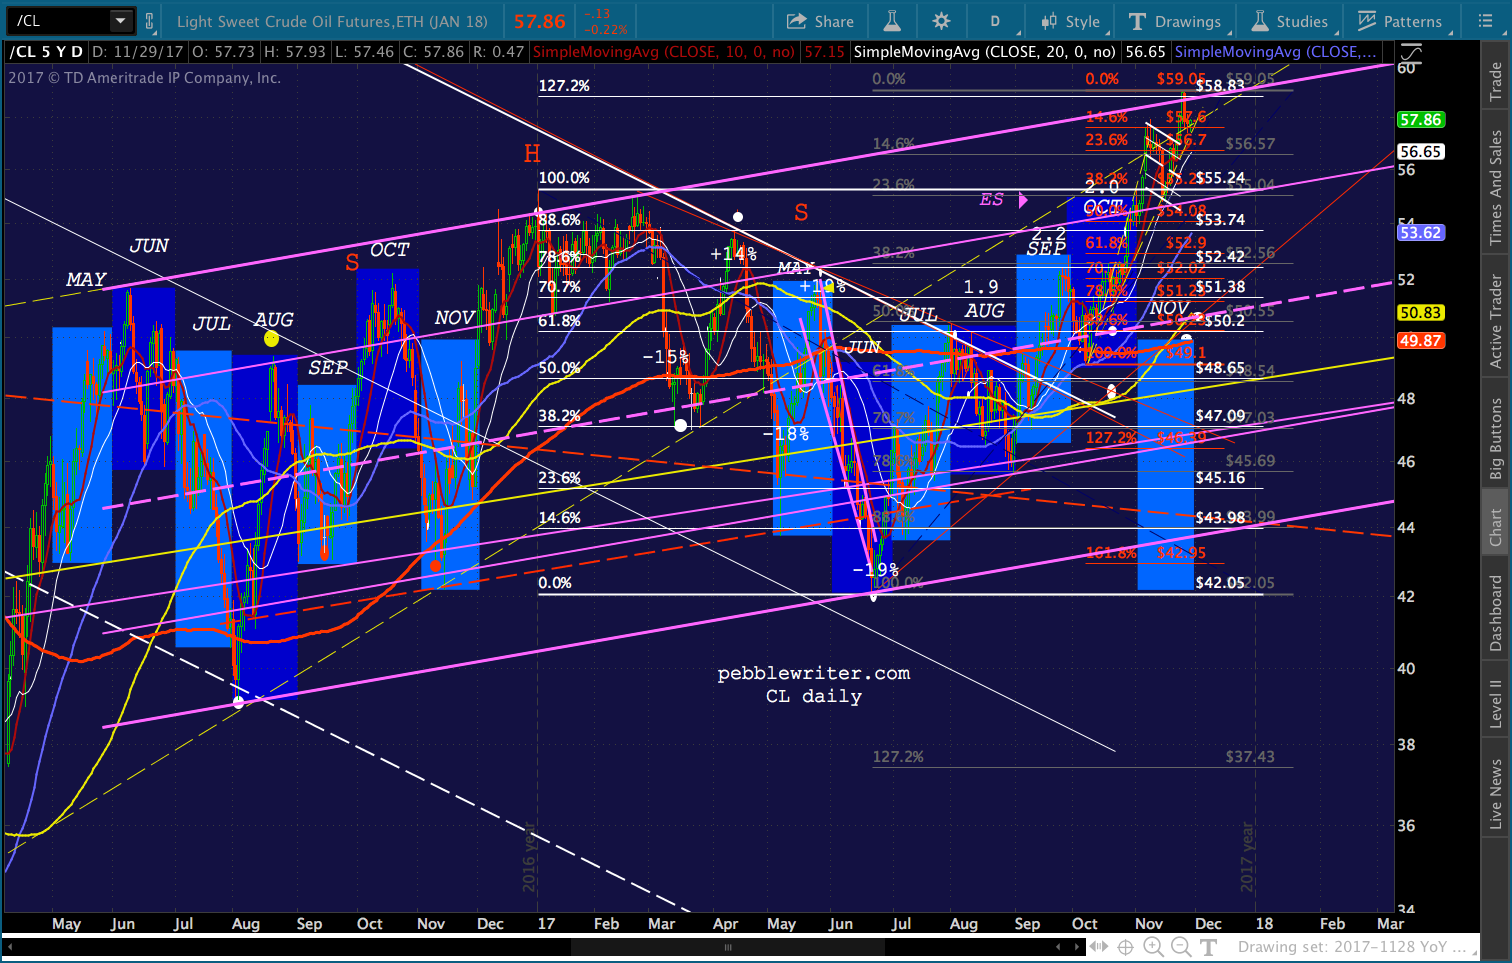
 …a failure of RB and CL to break down just yet…
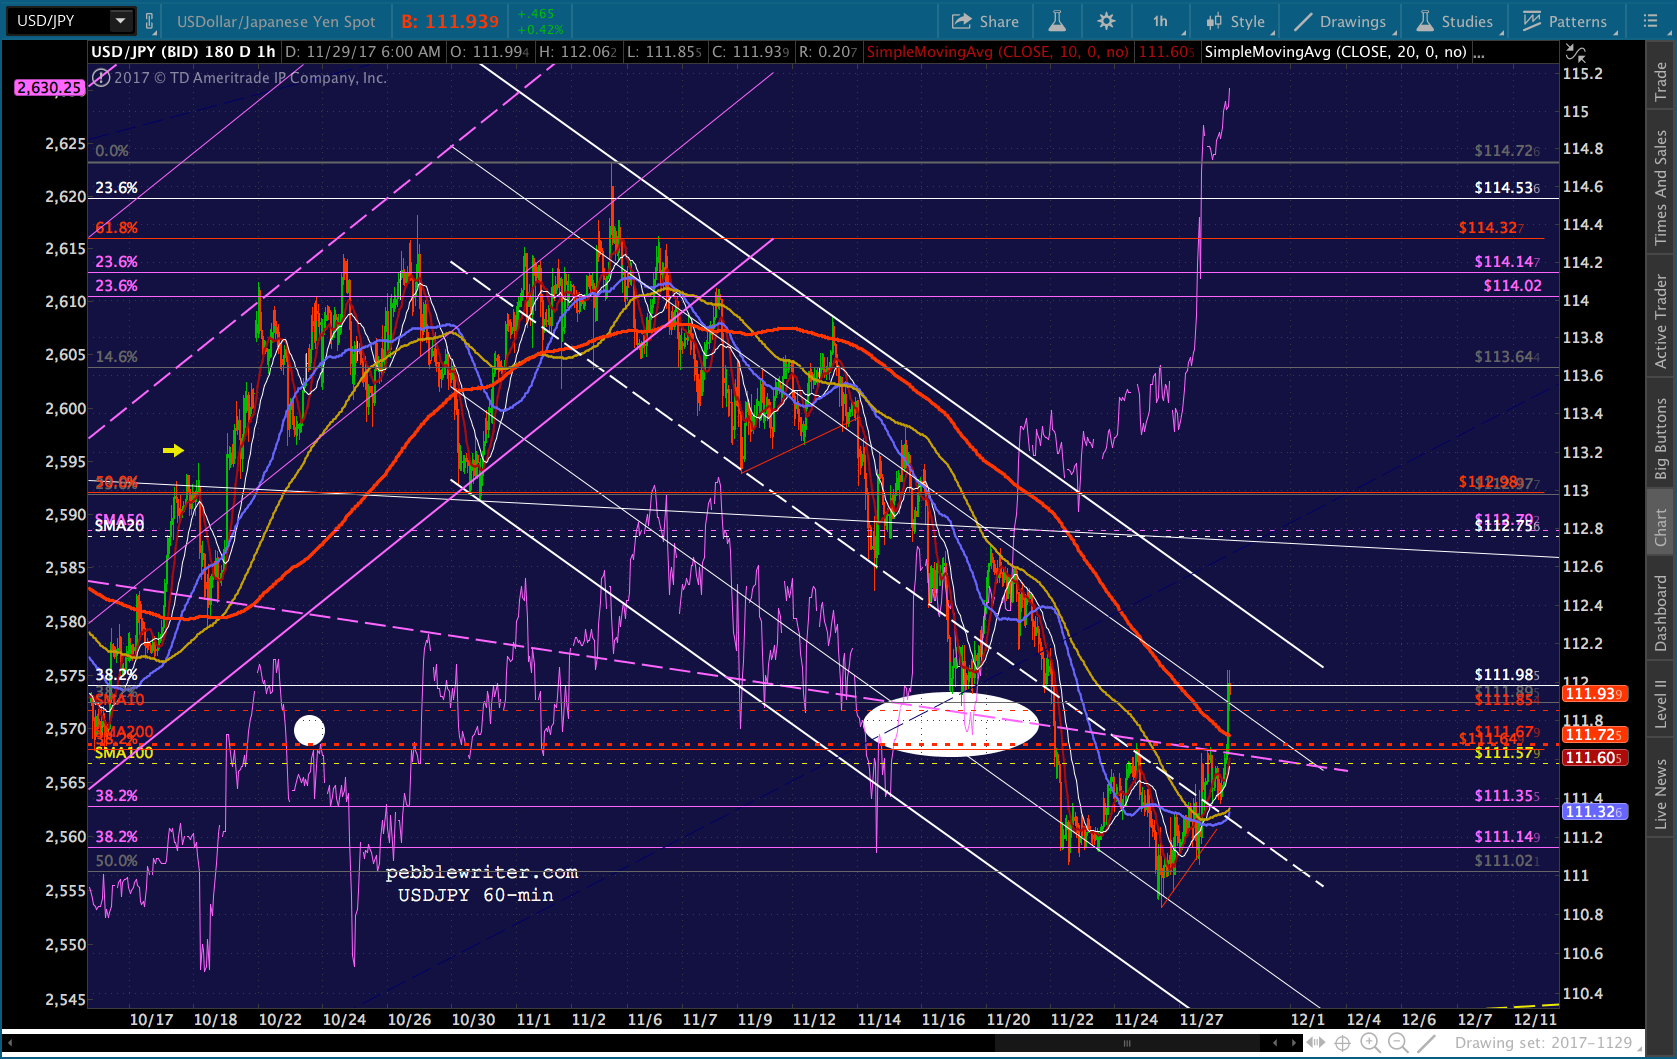
 …and a rebound in USDJPY.
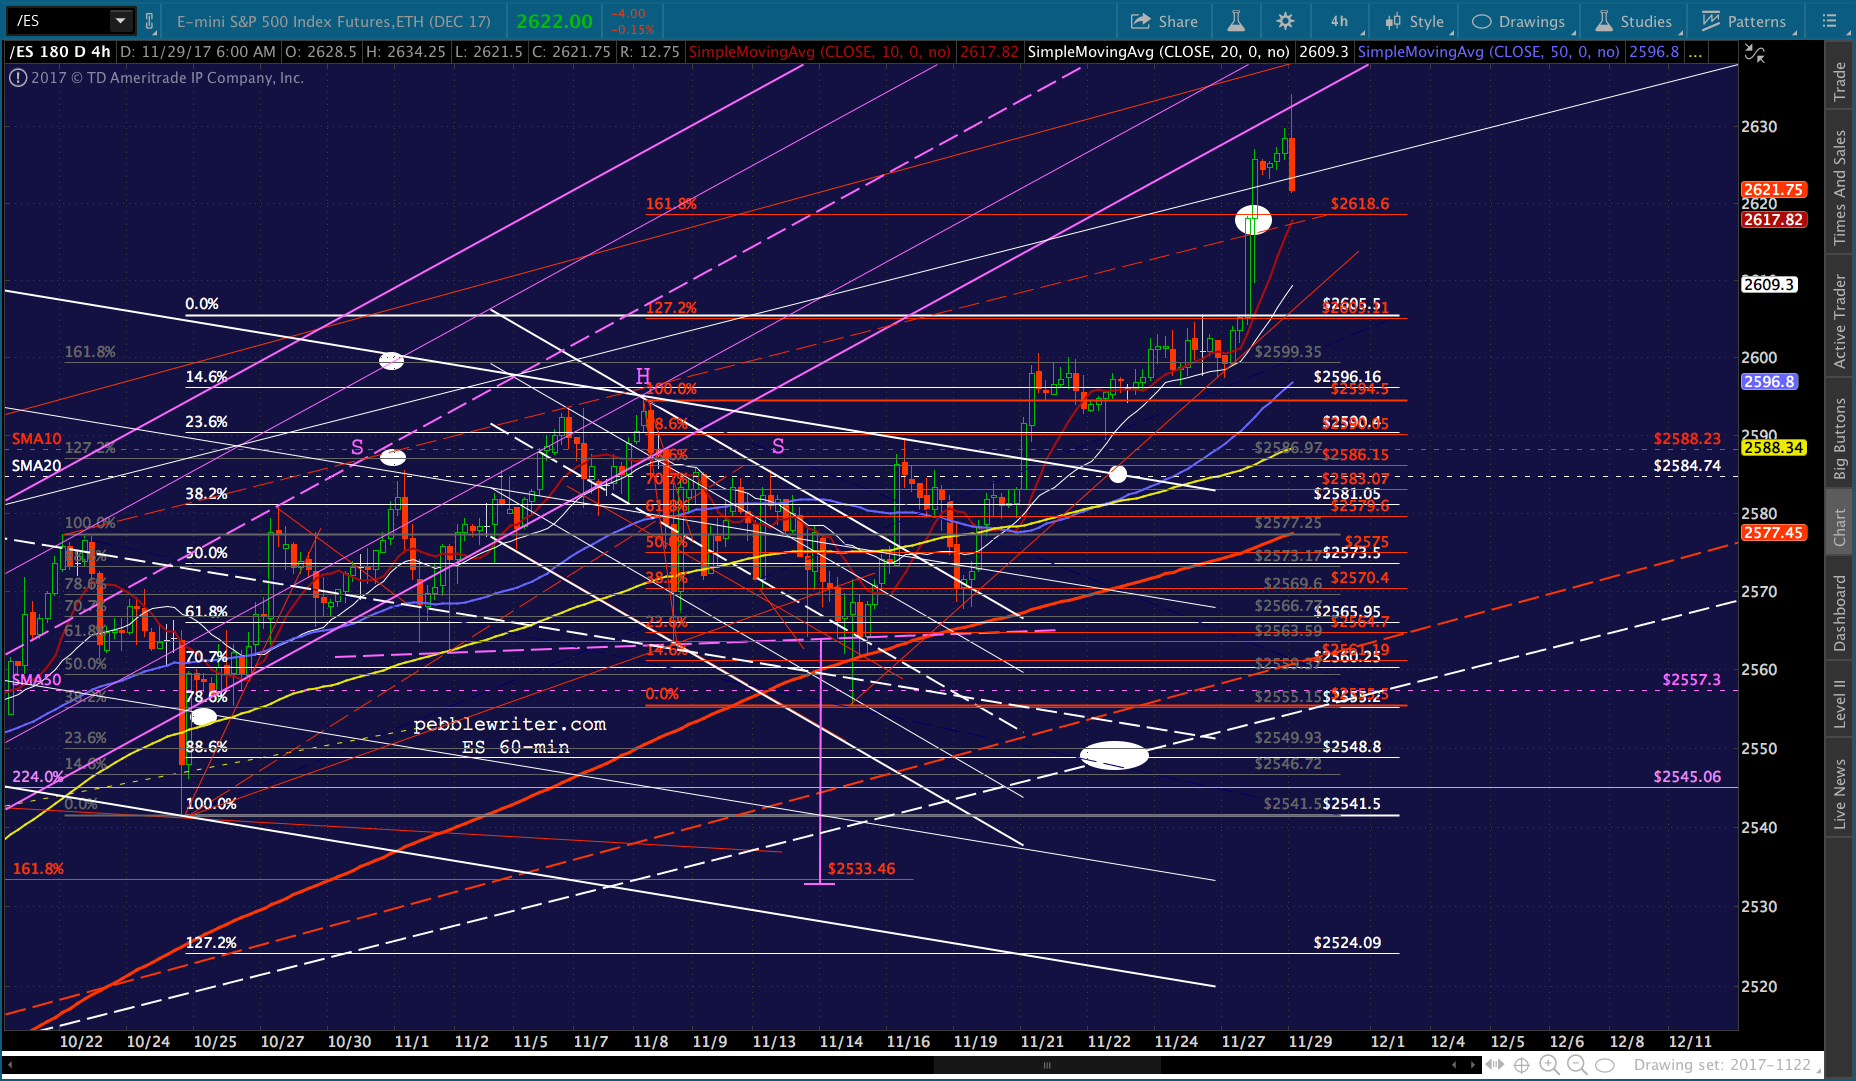
 This has allowed SPX to break out of the latest rising channel and ignore the Fib levels that should have served as at least backtests.
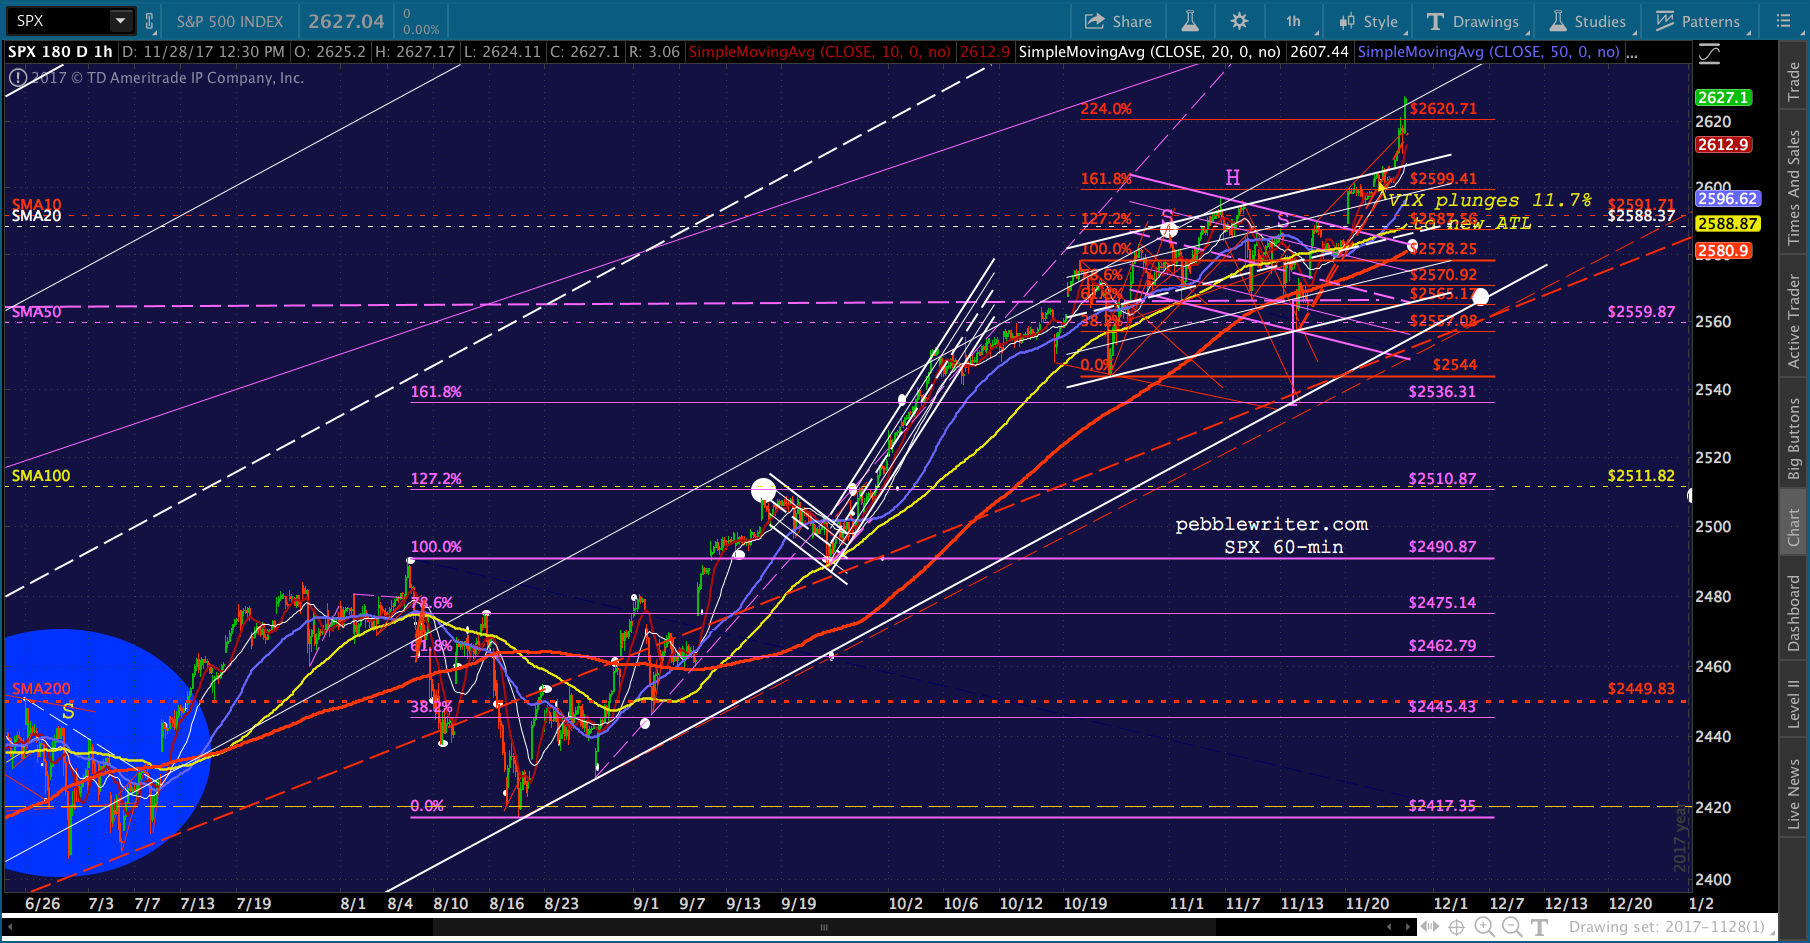 The game remains: reach a point of natural chart/fib resistance and pound VIX and/or force CL/USDJPY higher in order to overcome it. This is followed, of course, by an aggressive campaign to protect the new highs — often ignoring the obvious backtest.
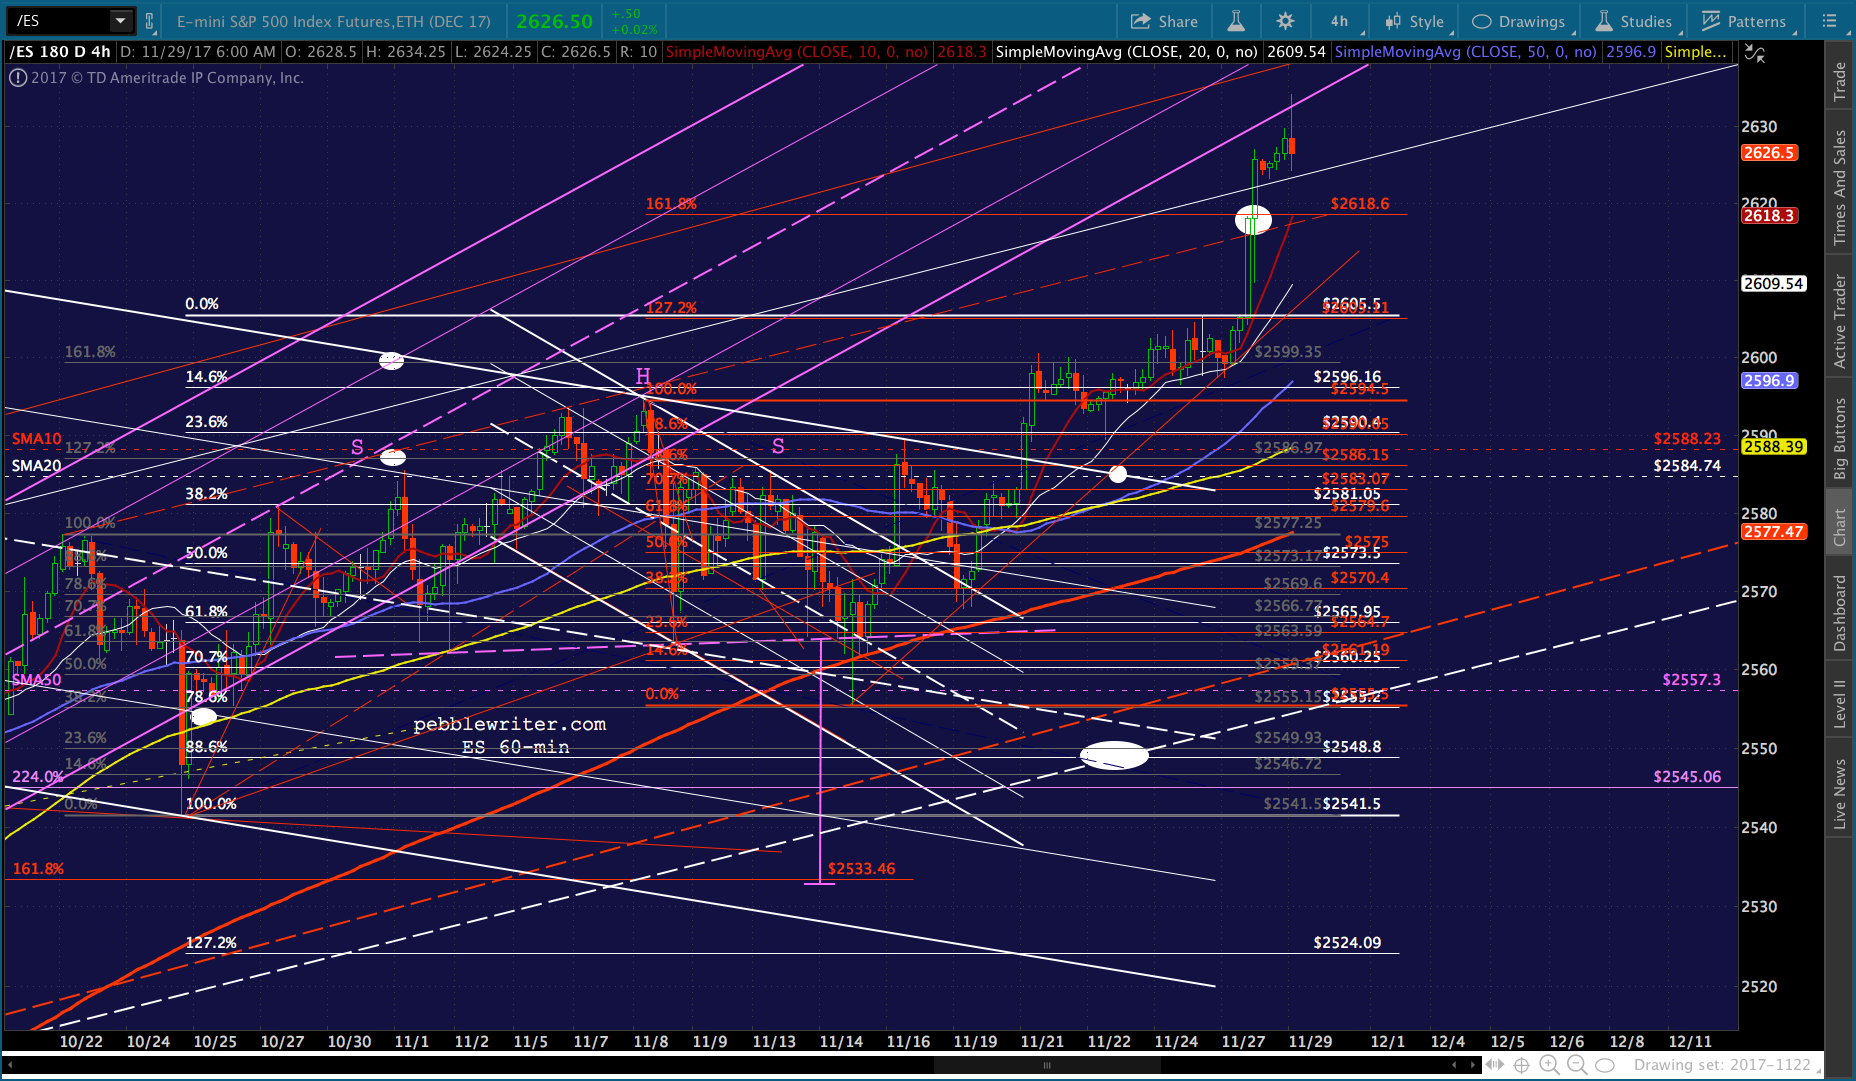 Stepping back and looking at the big picture, the problem remains inflation. Even if one accepts the horribly flawed and deliberately understated US government data, there is a growing gap between Americans’ earnings and their expenses that presents a potential roadblock for the rally.
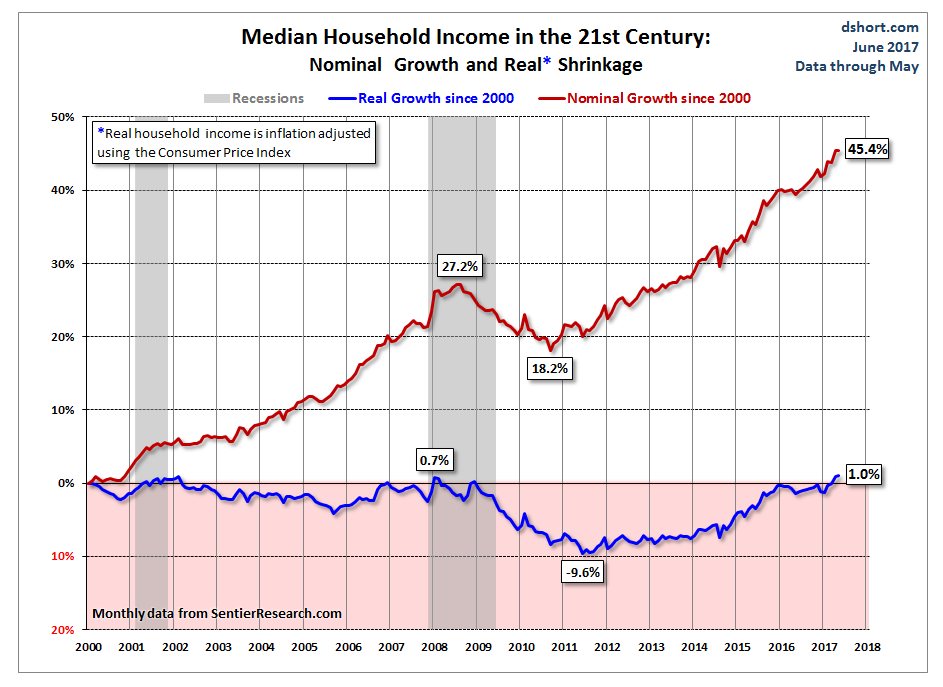
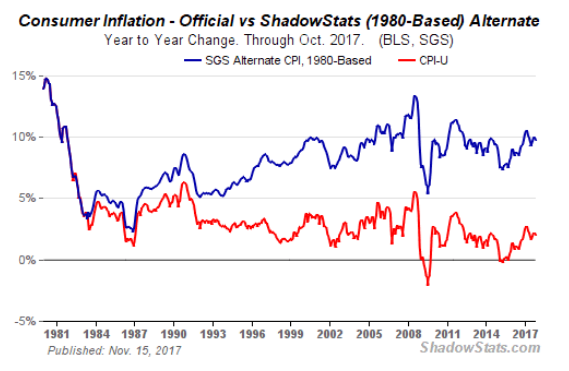
Corporate profits are not trickling down to the average consumer. Ditto, gains from stocks and real estate appreciation. Job growth has been in low-wage categories, and real wage growth has been non-existent. In short, the reinflation of asset bubbles has not made a difference for the vast majority.
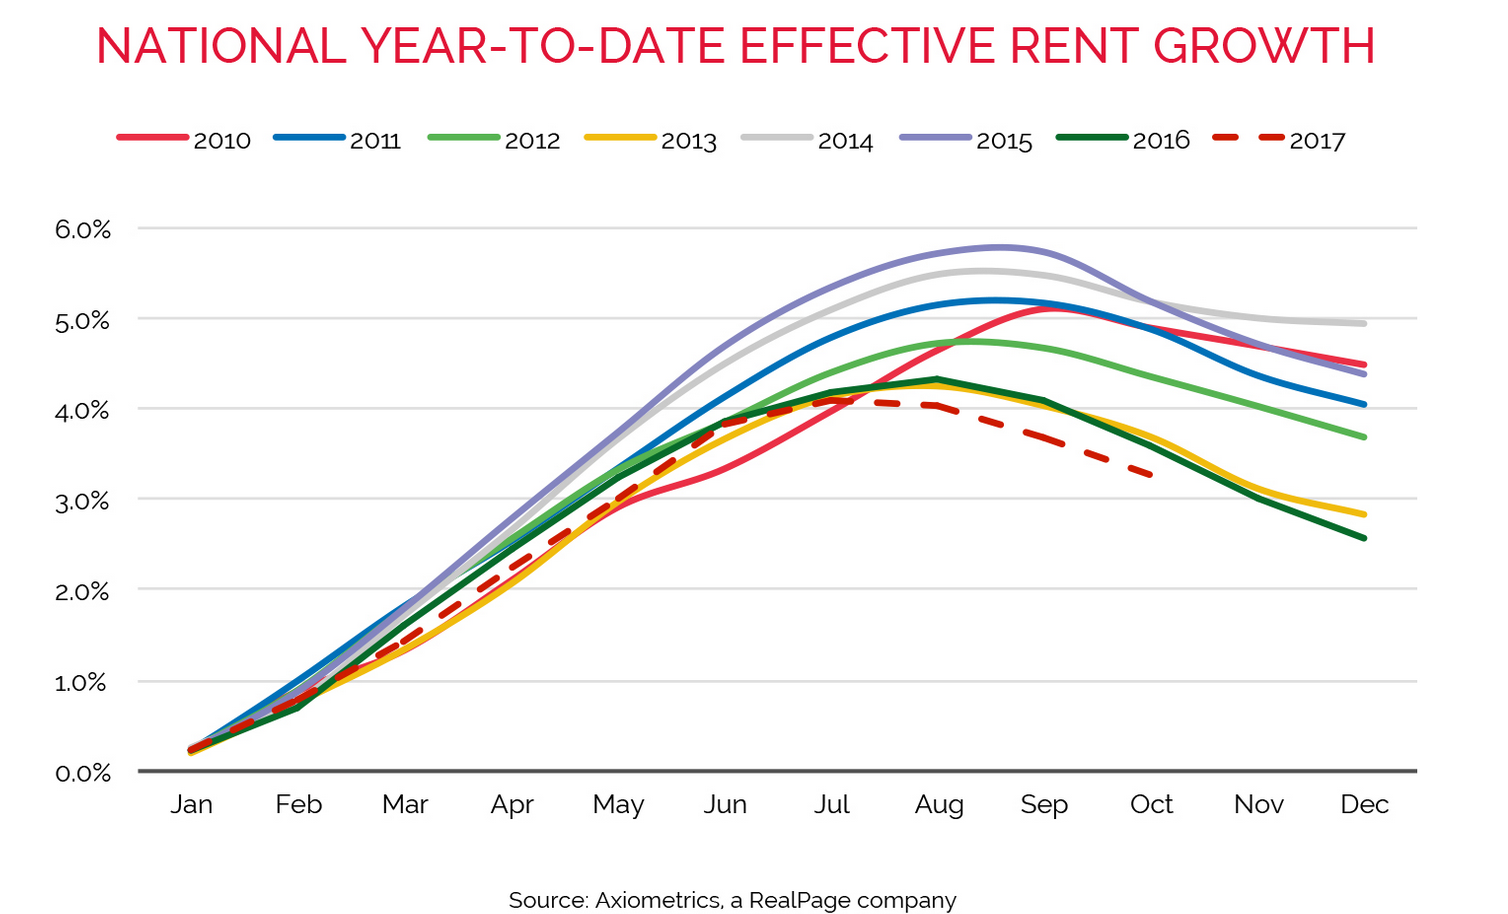
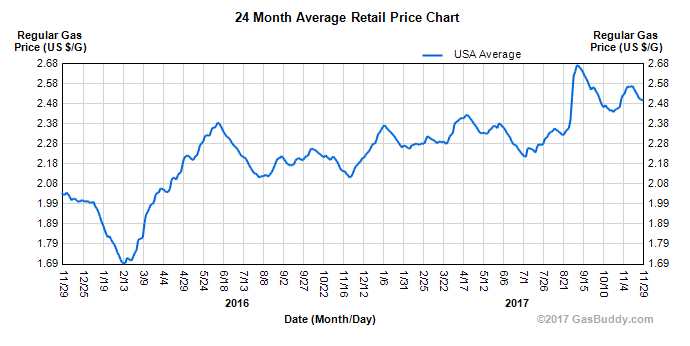
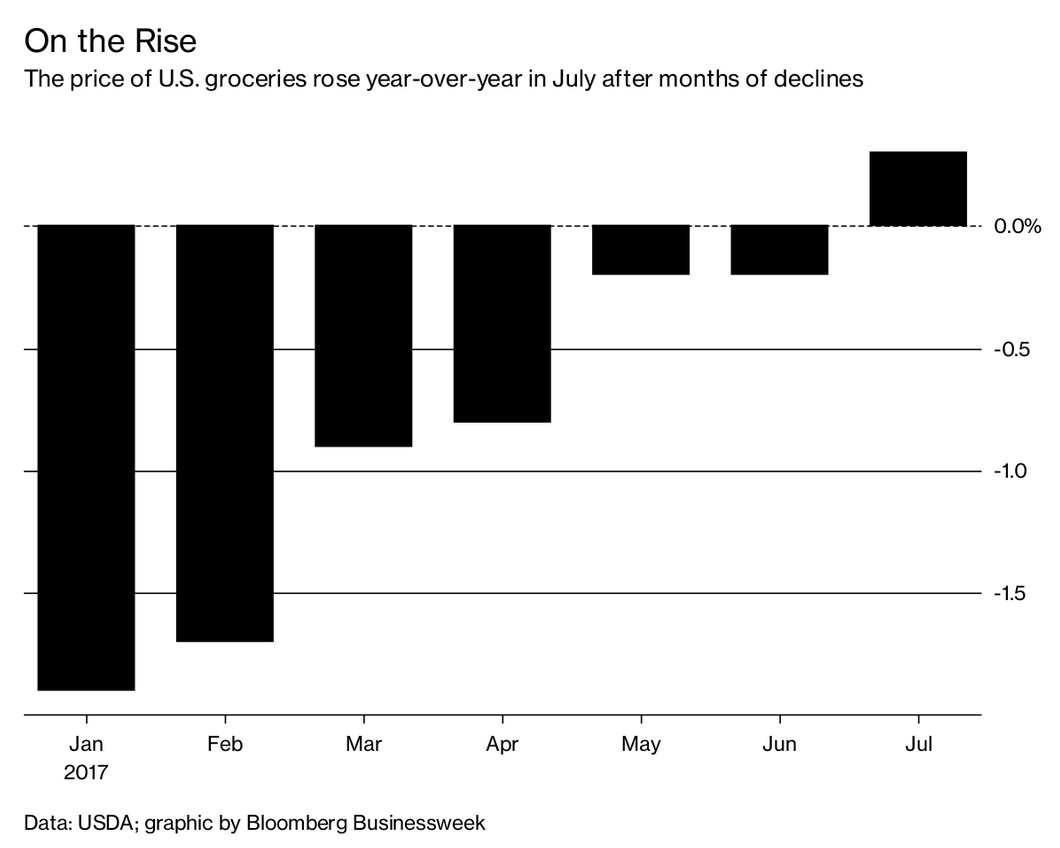
 What has made a difference are very significant increases in rent, healthcare, food and gas.
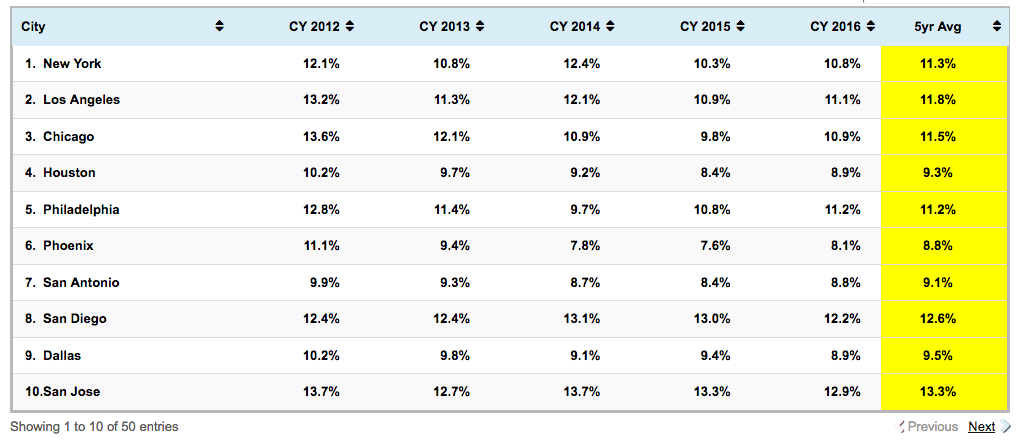
 These and other actual price increases have produced an actual rate of inflation closer to 10% as measured by non-governmental sources such as Ed Butowsky (The Chapwood Index) and John Williams (Shadowstats.)
 Combine stagnant wage growth and high inflation and you arrive at the only logical conclusion: stagflation. That title won’t make it into the headlines. It might scare people and it would definitely smear the narrative. But, it’s what we’ve got.
And, it’s why I’m convinced that oil and gas prices must come back down. Even with the data lies the government tells, they can’t keep oil and gas prices out of the equation entirely. Actual inflation stretches budgets and dampens spending, an effect which can already be seen in rising delinquency rates on car loans, credit cards and real estate. And, nominal inflation increases interest rates and, thus, stresses budgets and negatively impacts leveraged investment assets and expenditures (homes, cars, factories, stock buybacks, etc.)
This hasn’t shown up in stock prices, yet, because (1) interest rates are still so low that corporations can paper over lower sales and earnings with stock buybacks and other financial engineering, and (2) most of the market’s gains are attributable to a relative handful of successful companies (which are largely simply siphoning profits from competing firms, such as Amazon.)
But, if rates rise, you have to wonder how much longer that game can continue.
Stay tuned.
UPDATE: 11:41 AM
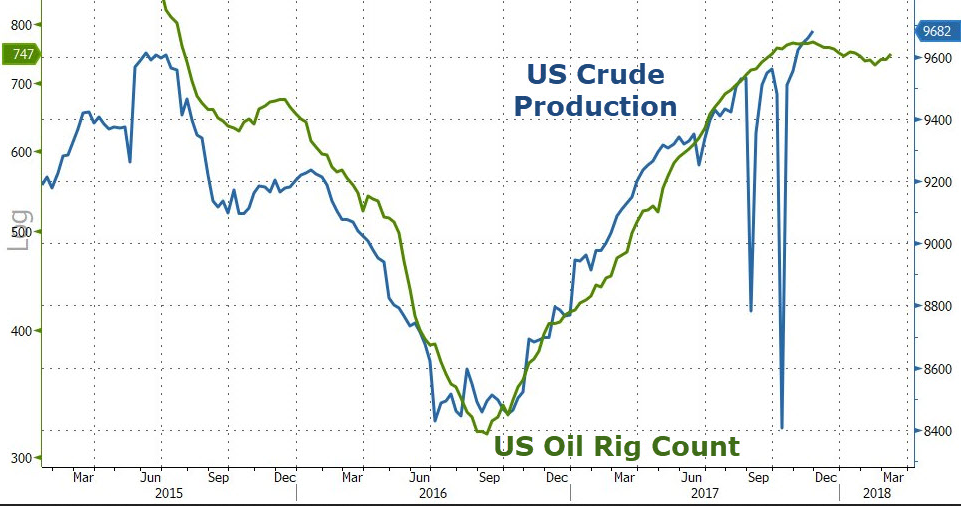
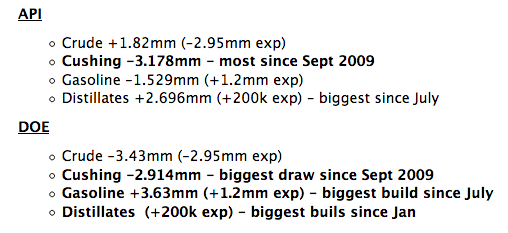
The EIA inventory report was pretty much as expected, with RB showing a big build versus the draw that was expected. Rig count and production are both up.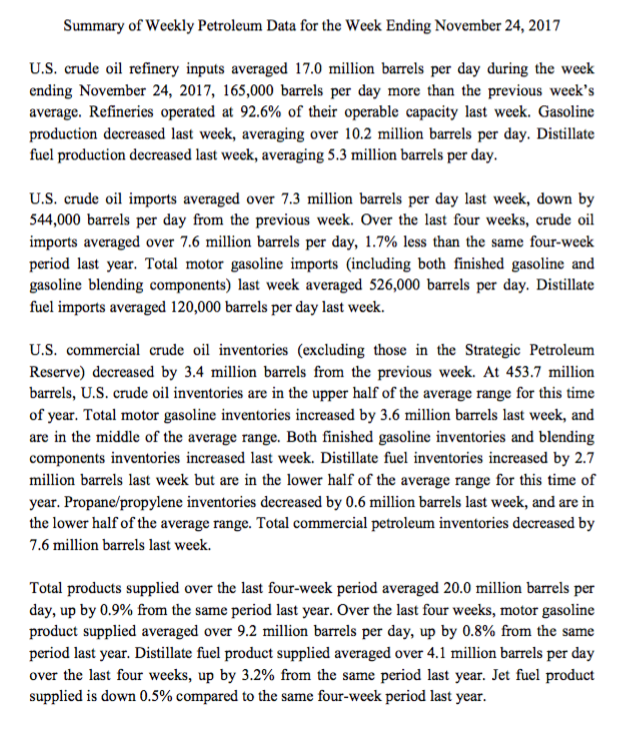
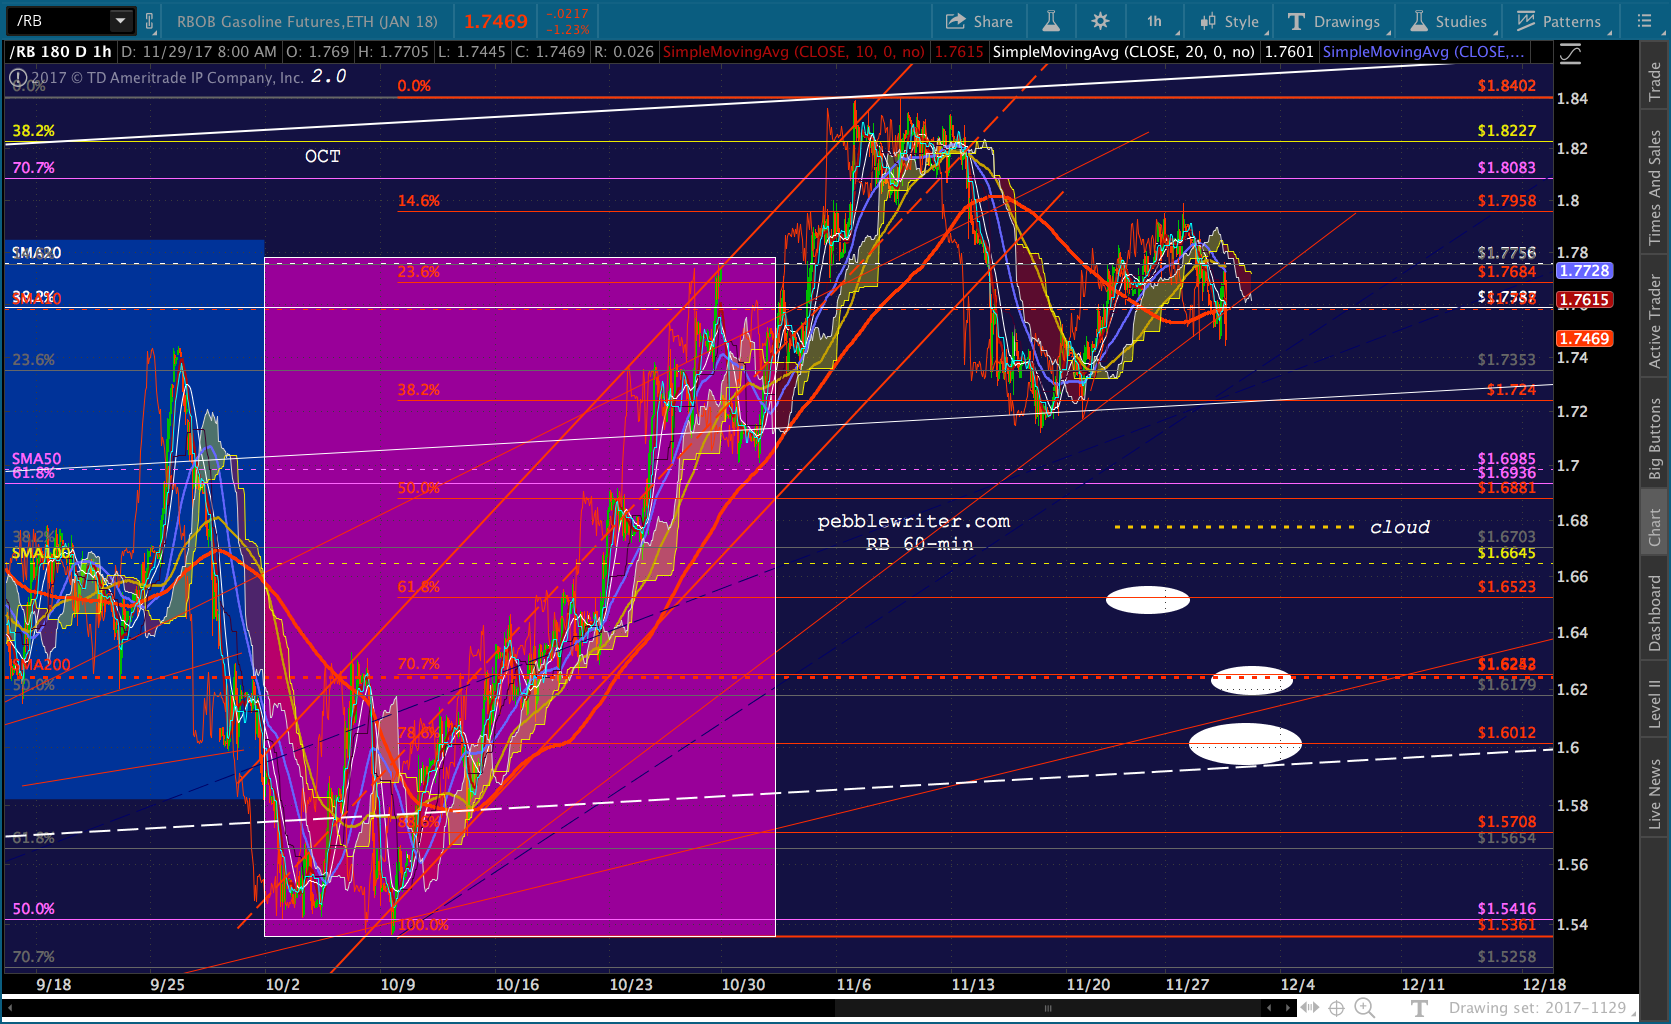
 CL is testing TL support, while RB has broken down. Note I’ve added an additional level of support for RB — the cloud top at around 1.68.
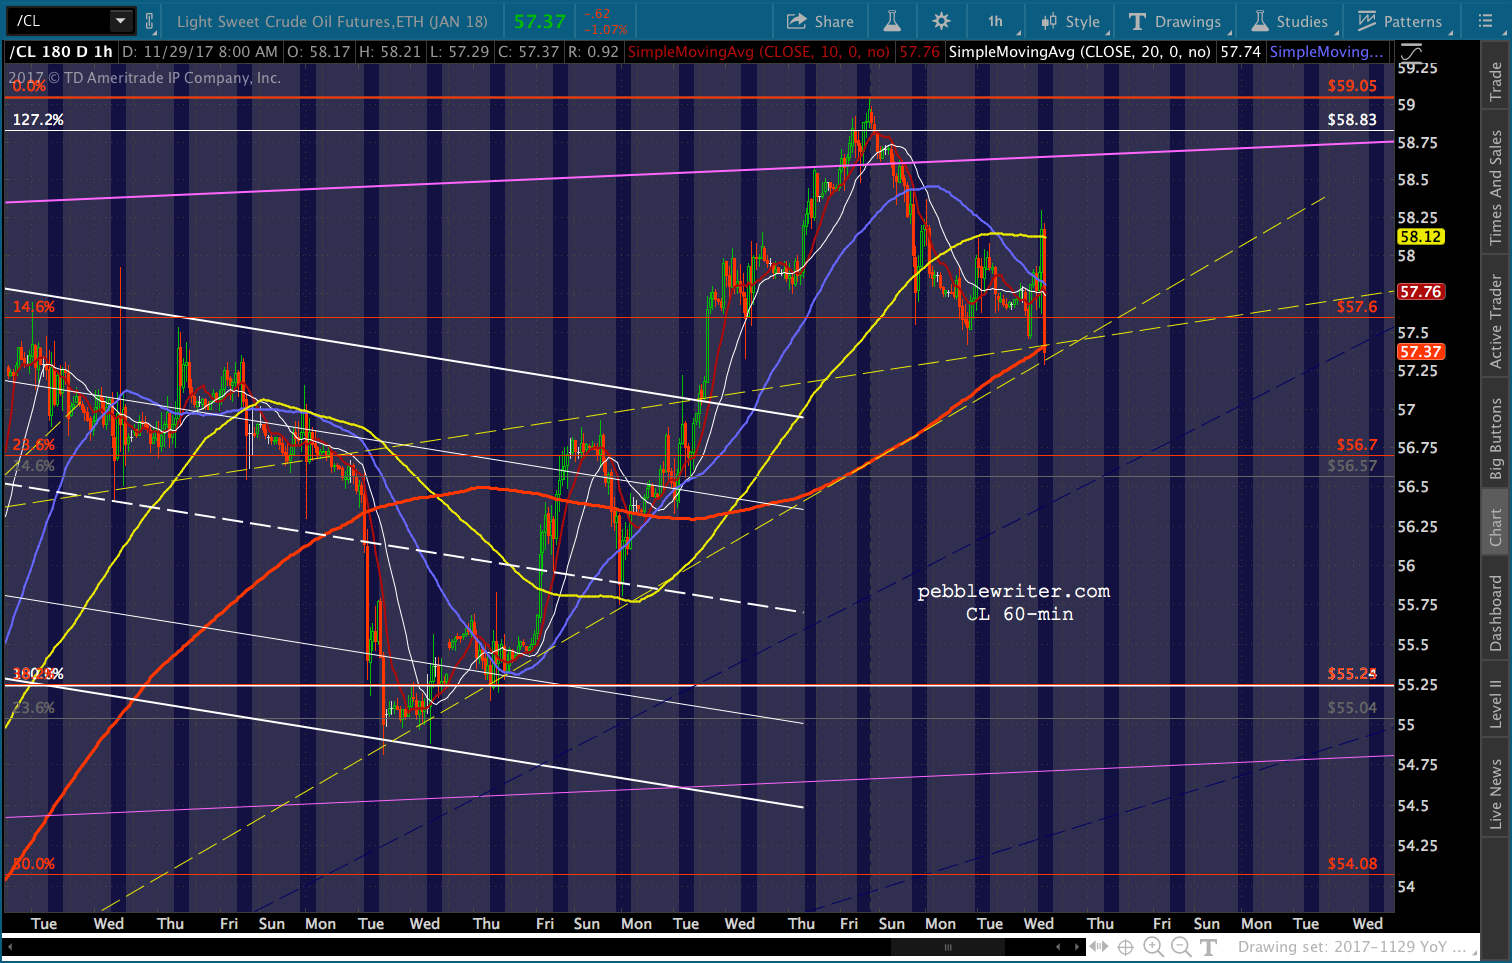
 Stocks are not responding well, and are back in the red for the day.