

In our last Big Picture update on Oct 24, I downplayed the likelihood of the big downturn that more and more analysts were predicting. And, in fact, the drop which began the day before was limited to 34 points – about 1.3%. From there, SPX moved on to new highs, reaching 2597 on Nov 7.
Here, again, it attracted plenty of naysayers. The subsequent drop was a whopping 1.5% — even though the index was overbought, breadth deteriorated and a H&S Pattern completed.  The day after the pattern completed, SPX gapped back above the neckline and came close to the previous all-time high.
As we discussed in October, and pretty much every other post since then, VIX continues to play an outsized role in the daily market fluctuations. Each new high has been facilitated by significant drops to below potential support in VIX.
This situation faces us again, today. And, it’s important to understand why.
continued for members…
Note that VIX sits at the intersection of the big yellow channel bottom and the rising white channel bottom. A drop through each would certainly punish the bears.
 Note also that a drop to those original 2533/2536 targets, while quite logical and in keeping with chart norms, would have resulted in a lower low for both ES and SPX.
 By delaying the drop and establishing a less dramatic falling channel, the odds are that the next leg down (if it happens) will be to the .886 retracement at SPX 2550 (ES 2547) — a higher low.
 Of course, even getting there would mean that either the USDJPY doesn’t bounce here (at least, now yet), as it’s threatening to do…

 …or, we finally get the selloff in CL/RBOB that the fundamentals and the charts argue is just around the corner.
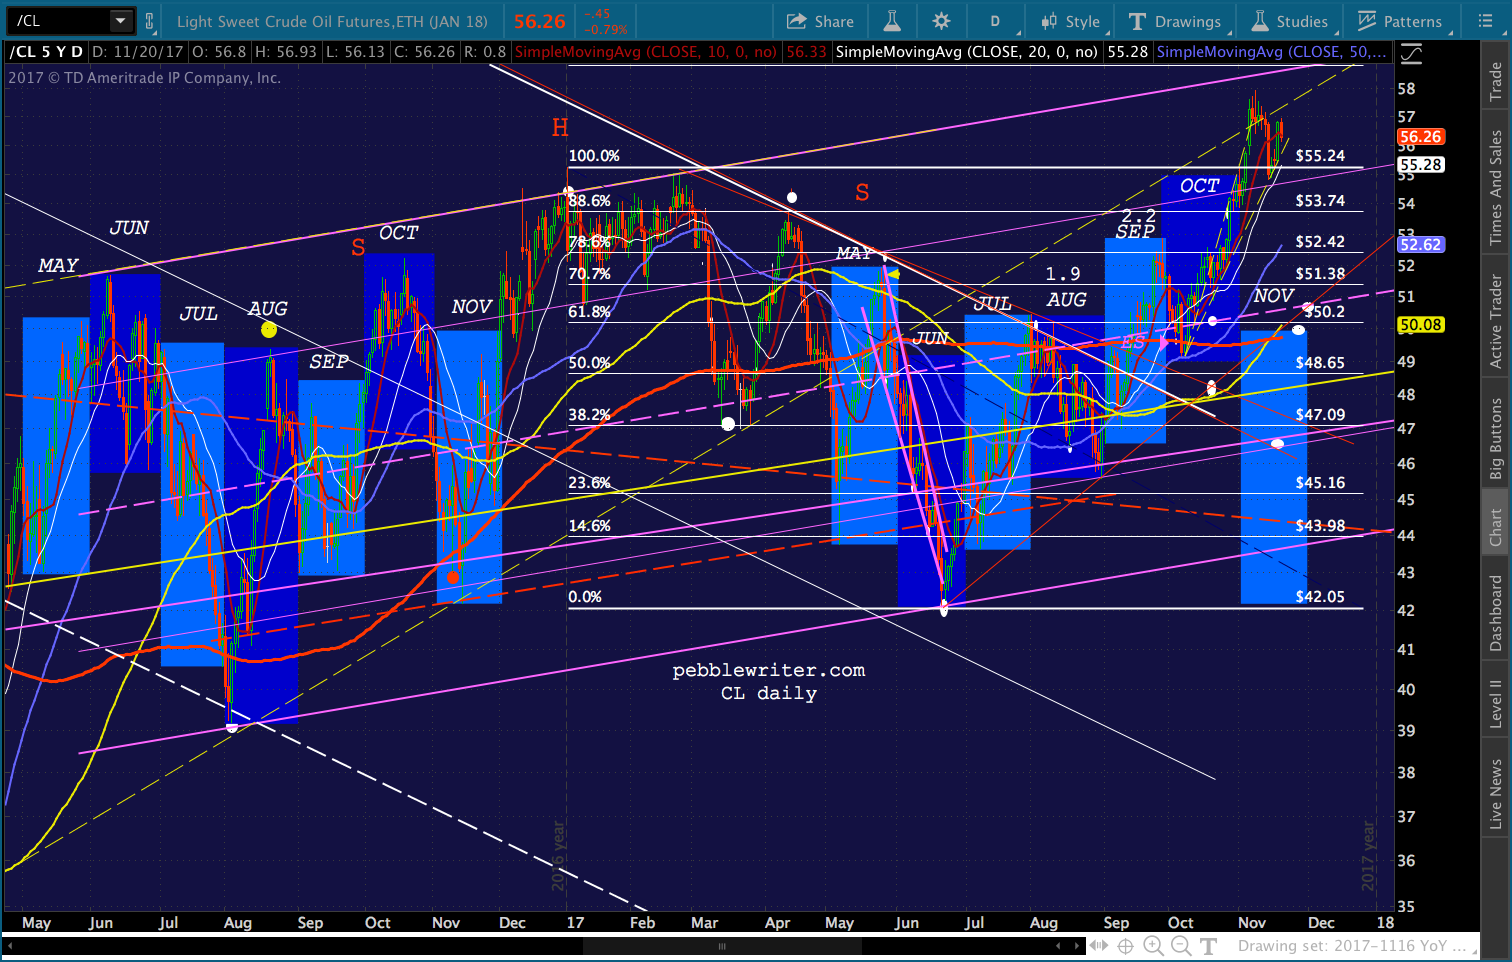
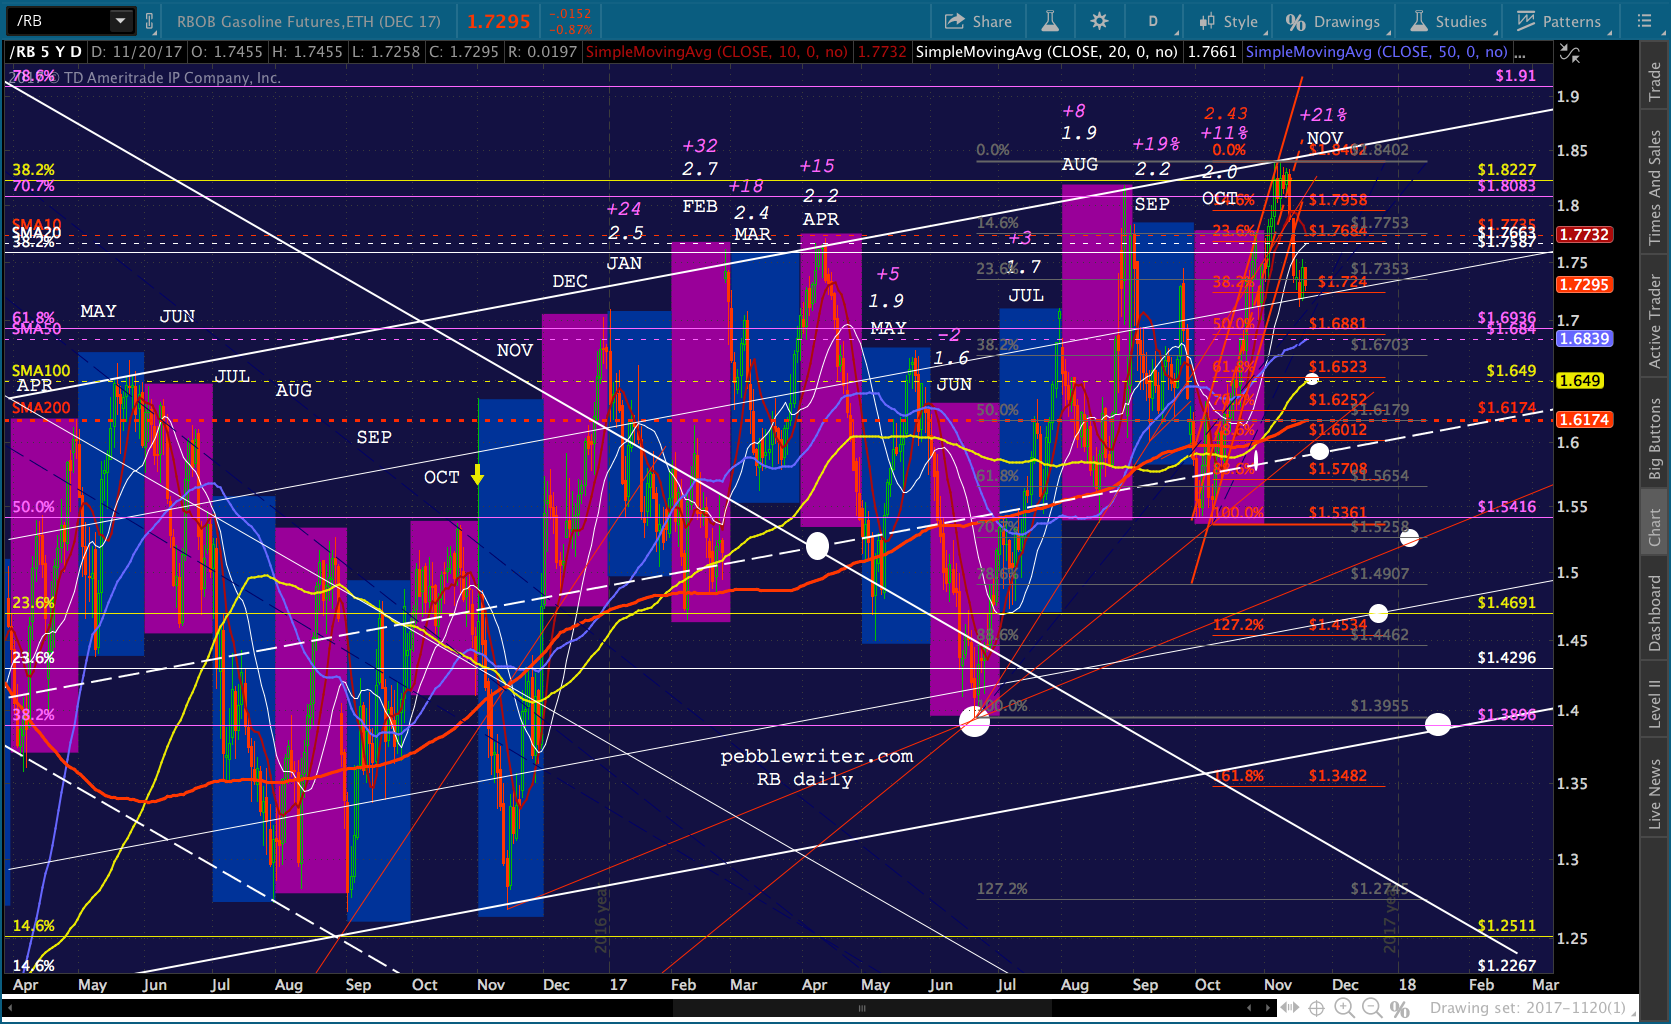 Both have risen absurdly sharply over the past 6 weeks. While RB broke down on Nov 14, CL is still clinging to a rising TL in order to keep stocks from slumping (ES in purple.)
 But, I maintain that a reckoning is necessary — especially in RB. Games have been played in the gas markets over the past couple of months. But, November 2016’s average price was 2.105. At 2.542, the current national average, the YoY comp is +20.8%. It reached as high as 21.7% last week.
 The Nov 1 comp is the one that concerns me just a little. Last year, RBOB spiked from 1.4105 to 1.6351 between Oct 31 and Nov 1 — the result of the Colonial Pipeline explosion. It fell back almost as quickly as it rose, and on Nov 2 was back as low as 1.4318 — the beginning of a steep slide to 1.2681 by Nov 14.
The way the BLS has been playing games lately, there’s a possibility they’d use the Nov 1 price of $2.20/gallon, indicating a YoY increase of 15.5%. Comparing Nov 1 2016’s prices to late Nov 2017’s prices could yield an increase of 10-12%.
Note that OPEC is meeting on Nov 30 and spec long futures positions are near all-time highs. A failure to expand (or, especially extend) the output deal would really do a number on futures prices and, quite possibly, make enough of a difference to retail prices that CPI could be reported at 2% or less.
Of course, after November is dealt with, the December YoY comps will be a breeze. My gut tells me USDJPY is about to bottom (if it hasn’t already) and spike higher as CL/RB drop sharply. After Dec 1, however, we could well see the selling pressure on CL/RBOB subside. In any case, look for the fireworks to start any day now. With only 8 trading days left, we should get that downdraft soon — possibly over the holiday so that the impact on the low volume equity markets can be more easily neutralized.
There are many targets available for RB. At this point, we should expect support at the SMA100 and red .618 at 1.65, followed by the SMA200 at 1.6174 and the white midline around 1.60. If the white midline breaks down, then we have good potential to 1.45-1.49.
Backing away from the immediate price targets, let’s look at the big picture equity situation. SPX has successfully bumped along in a rising price channel that dates back to oil’s Feb 11 lows.  Most of you will remember that SPX tagged 1810 at the time, backtesting the 1.272 Fib at 1823 for the 4-5th time, depending on how picky you want to be.
  If we draw the rising purple channel as above, with the top of the channel defined by SPX’s highs in late 2014-early 2015, we can see that the midline was also tested by that Feb 2016 plunge. Actually, it broke down — but, was resurrected by oil’s rebound from 26 to 52 between Feb and June.
In the $50+ range, oil became an inflation problem.