

Since the last Big Butterfly Pattern completed on May 20, TPTB have managed to limit the fallout to a relatively minor correction that left the rising channel from 2009 intact. On both a percentage and duration basis, the August plunge wasn’t even as bad as the 2011 one.
 That is, of course, if one considers the correction to be over.
continued for members…Butterfly Patterns generally produce much greater reversals than what we’ve seen thus far. It didn’t even reach the 1.272 extension at 1823. But, by stopping at 1867 it was able to maintain the rising purple channel — which, after all, was the point.
Since then, we’ve seen a Bat Pattern reversal at just past the .886, followed by another Bat Pattern and a potential Flag Pattern — shown below in red.
This Flag would be bullish except for the fact that this past Friday’s deep (again, .886) retracement clearly broke below the bottom of the rising white channel.
But, with the weekend ramp job in full swing (up 11.25 as I write this the night before), would it surprise anyone if it turned out to be just another bear trap?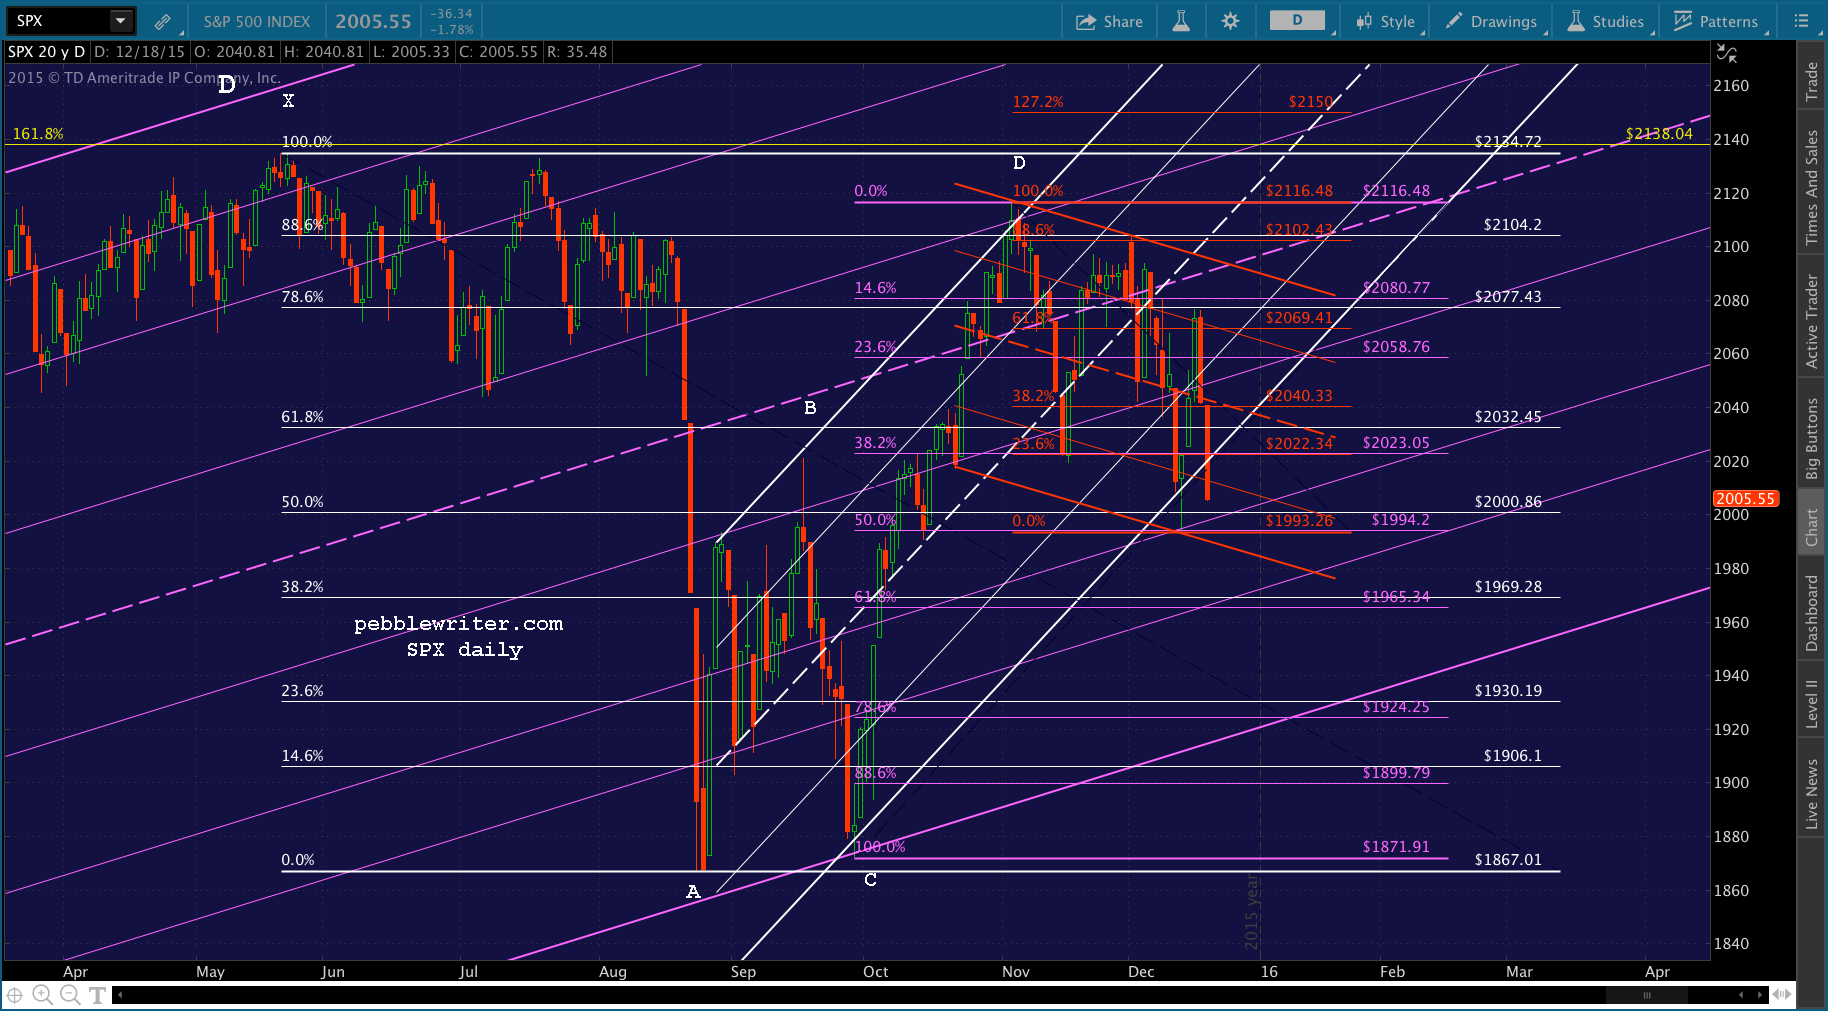 If SPX rebounds from here, then Friday’s .886 retracement of the Dec 14-16 rise can be written off as a corrective 2nd wave to the impulse that kicked in following an A-B-C corrective wave that began at Point D (ignoring the obvious overlap problems.)
We’ve had many such transgressions over the past couple of years, as TPTB just don’t care anymore which rules are bent or broken in the pursuit of ever-higher prices.
The daily moving averages are an interesting story in their own right. The death cross that occurred back on Aug 27 was of little predictive value in that the worst of the damage had already been done several days earlier.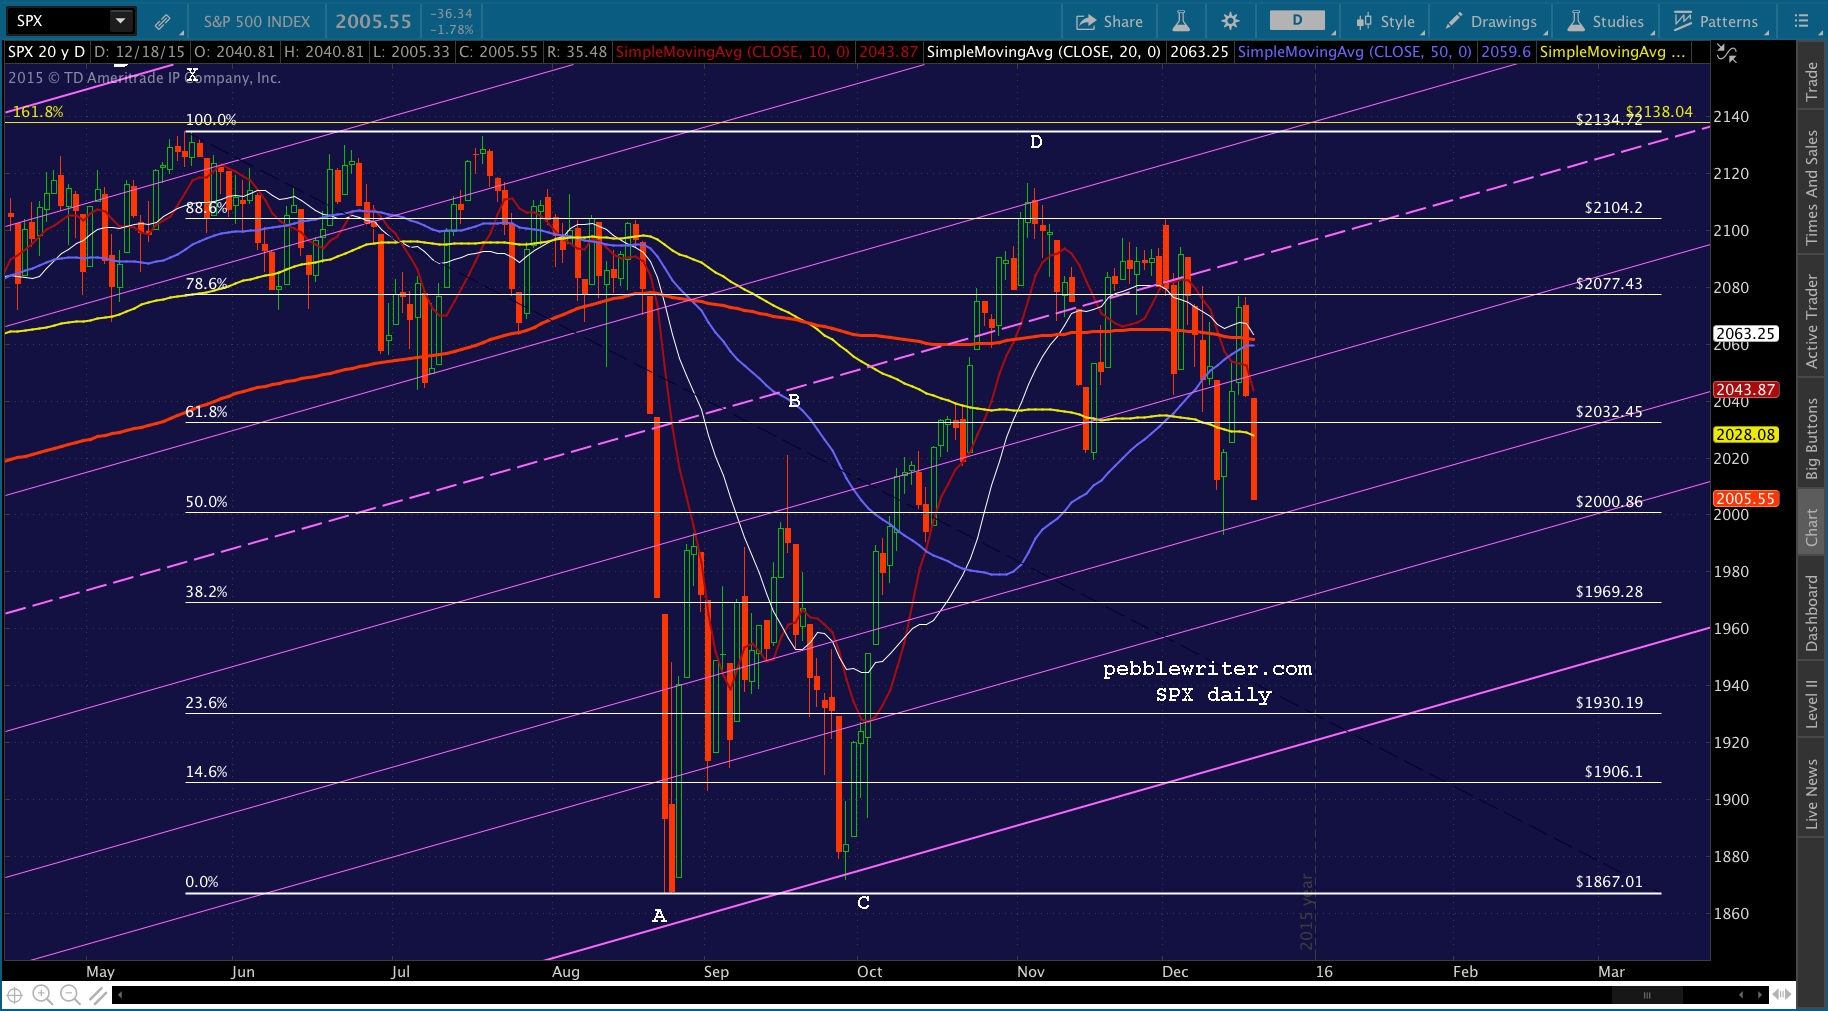 But, now the SMA50 is back within 2 points (2059.60 vs 2061.54) of the SMA200. A bullish cross would no doubt be trumpeted in the financial press as a sign of a full recovery.
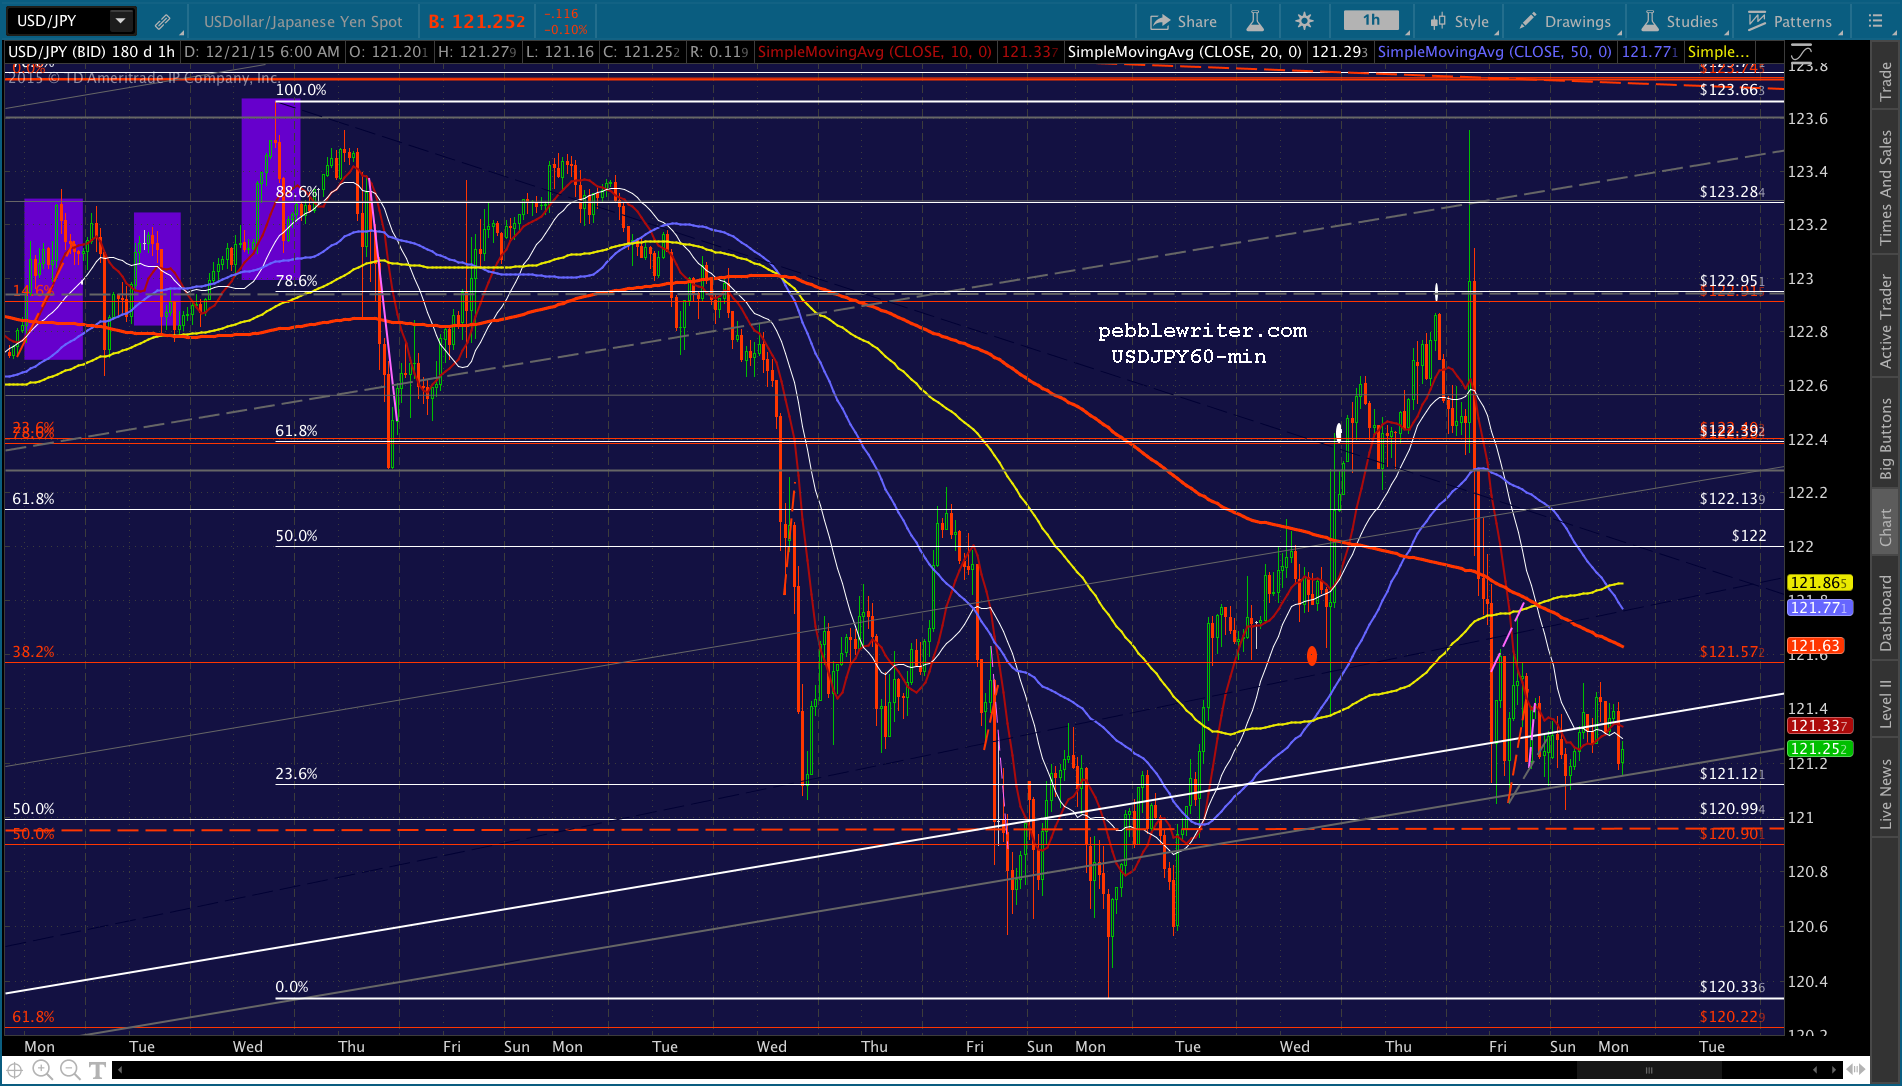
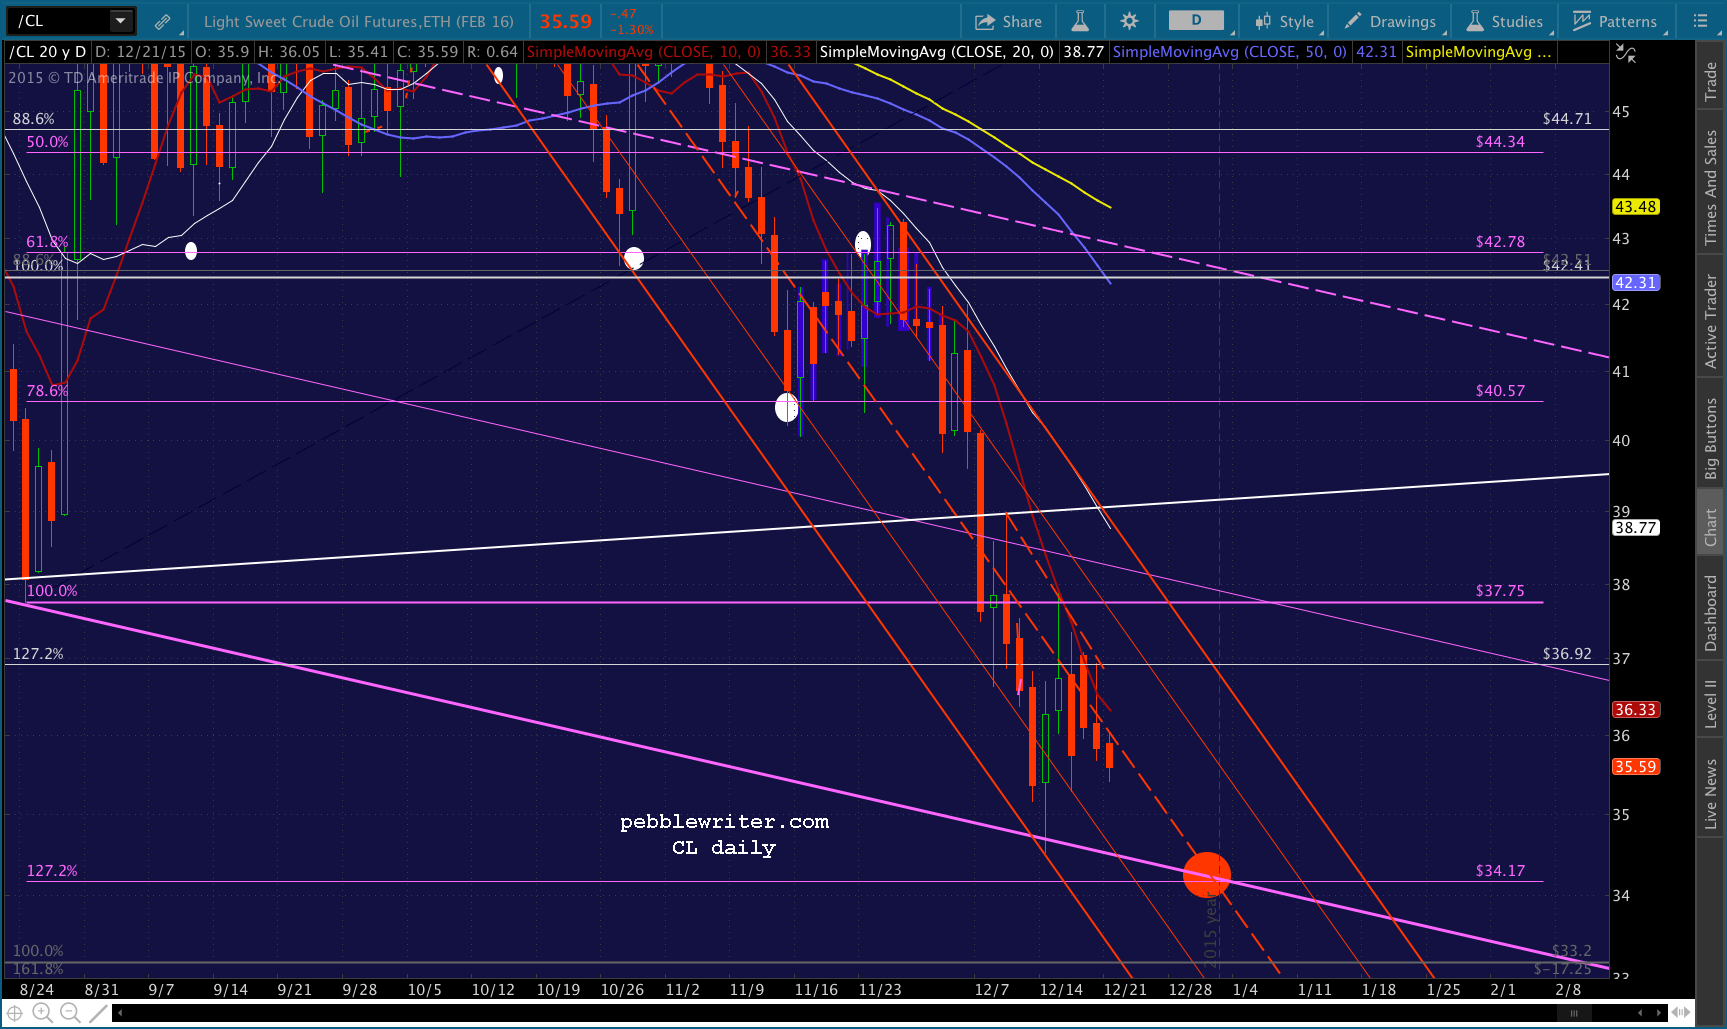
The primary drivers of SPX have yet to fully show their hand. I’ve operated under the assumption that USDJPY will hold the rising white channel bottom shown below. But, the five dips below trend in the past two weeks certainly haven’t inspired confidence.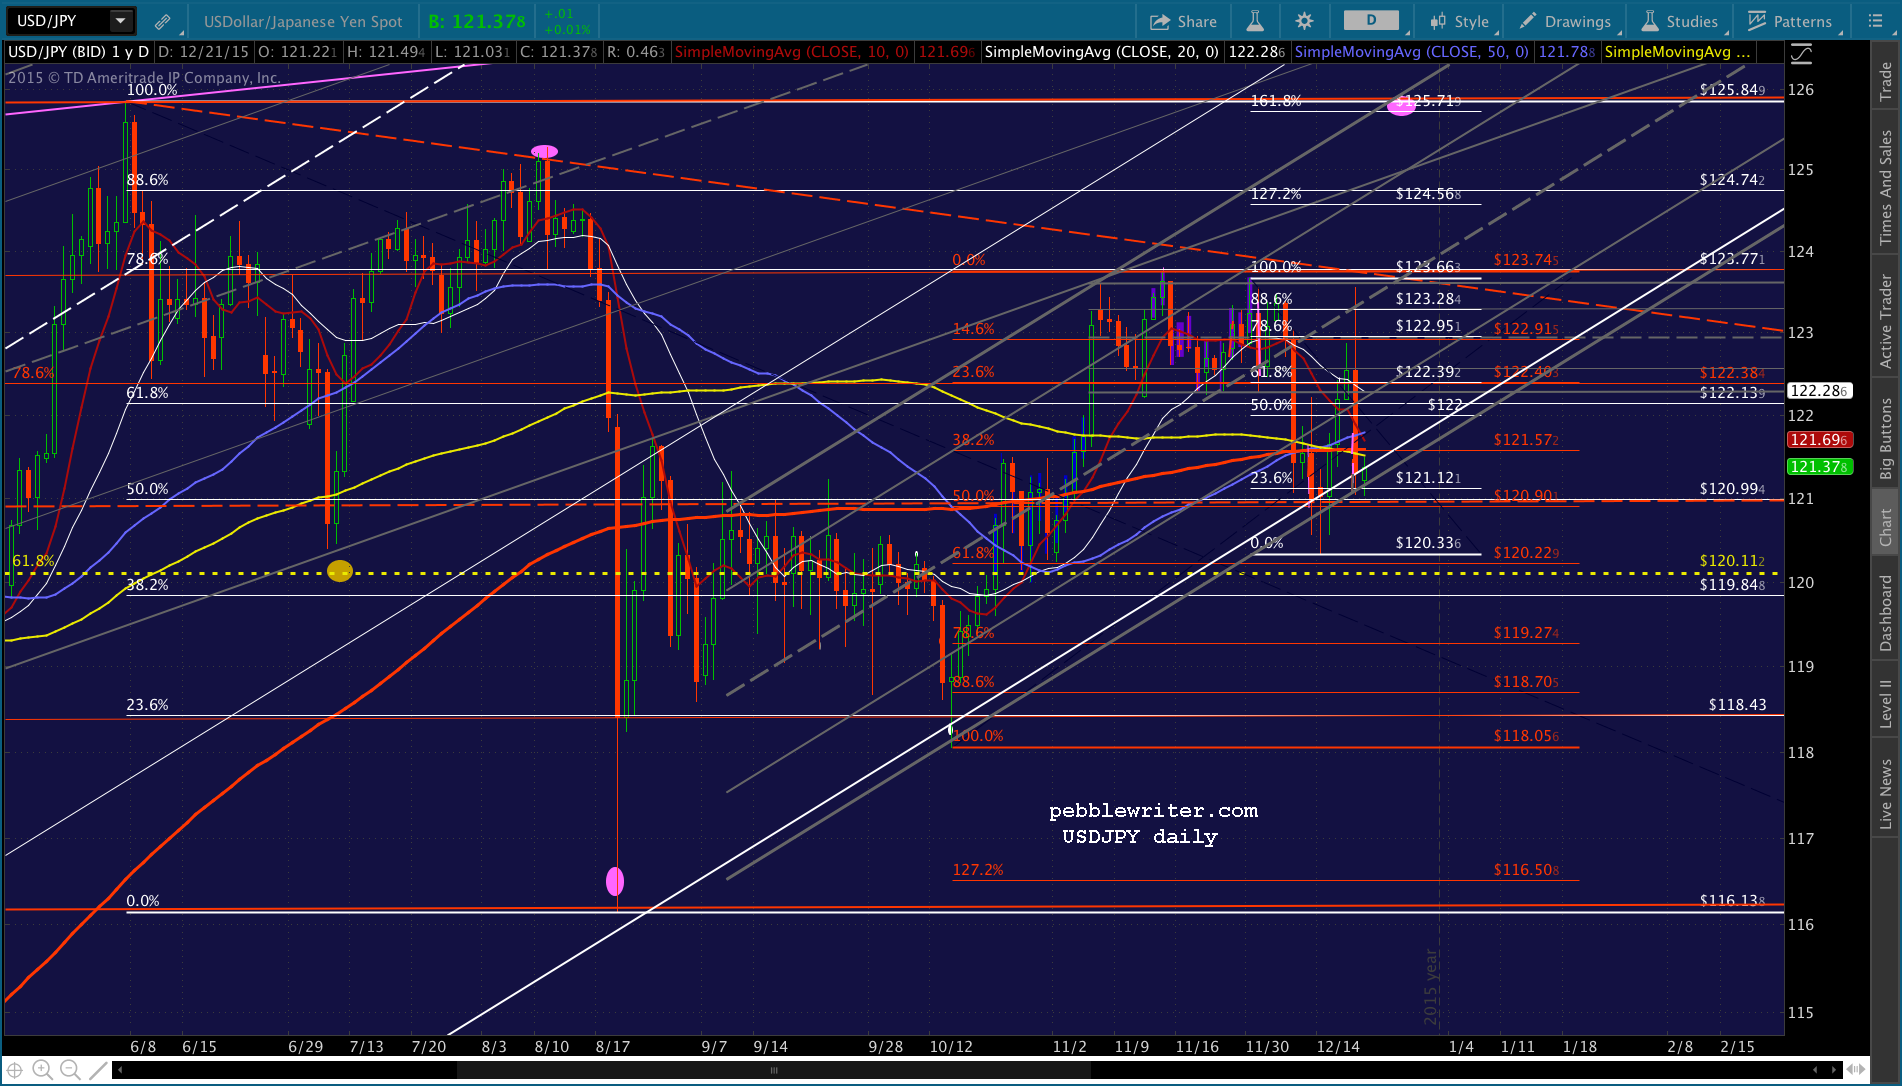 The plunge CL is undergoing supports the notion that a deal has been made with the BoJ: devalue the yen some more to support the yen carry trade, and we’ll devalue oil enough to offset the loss in purchasing power.
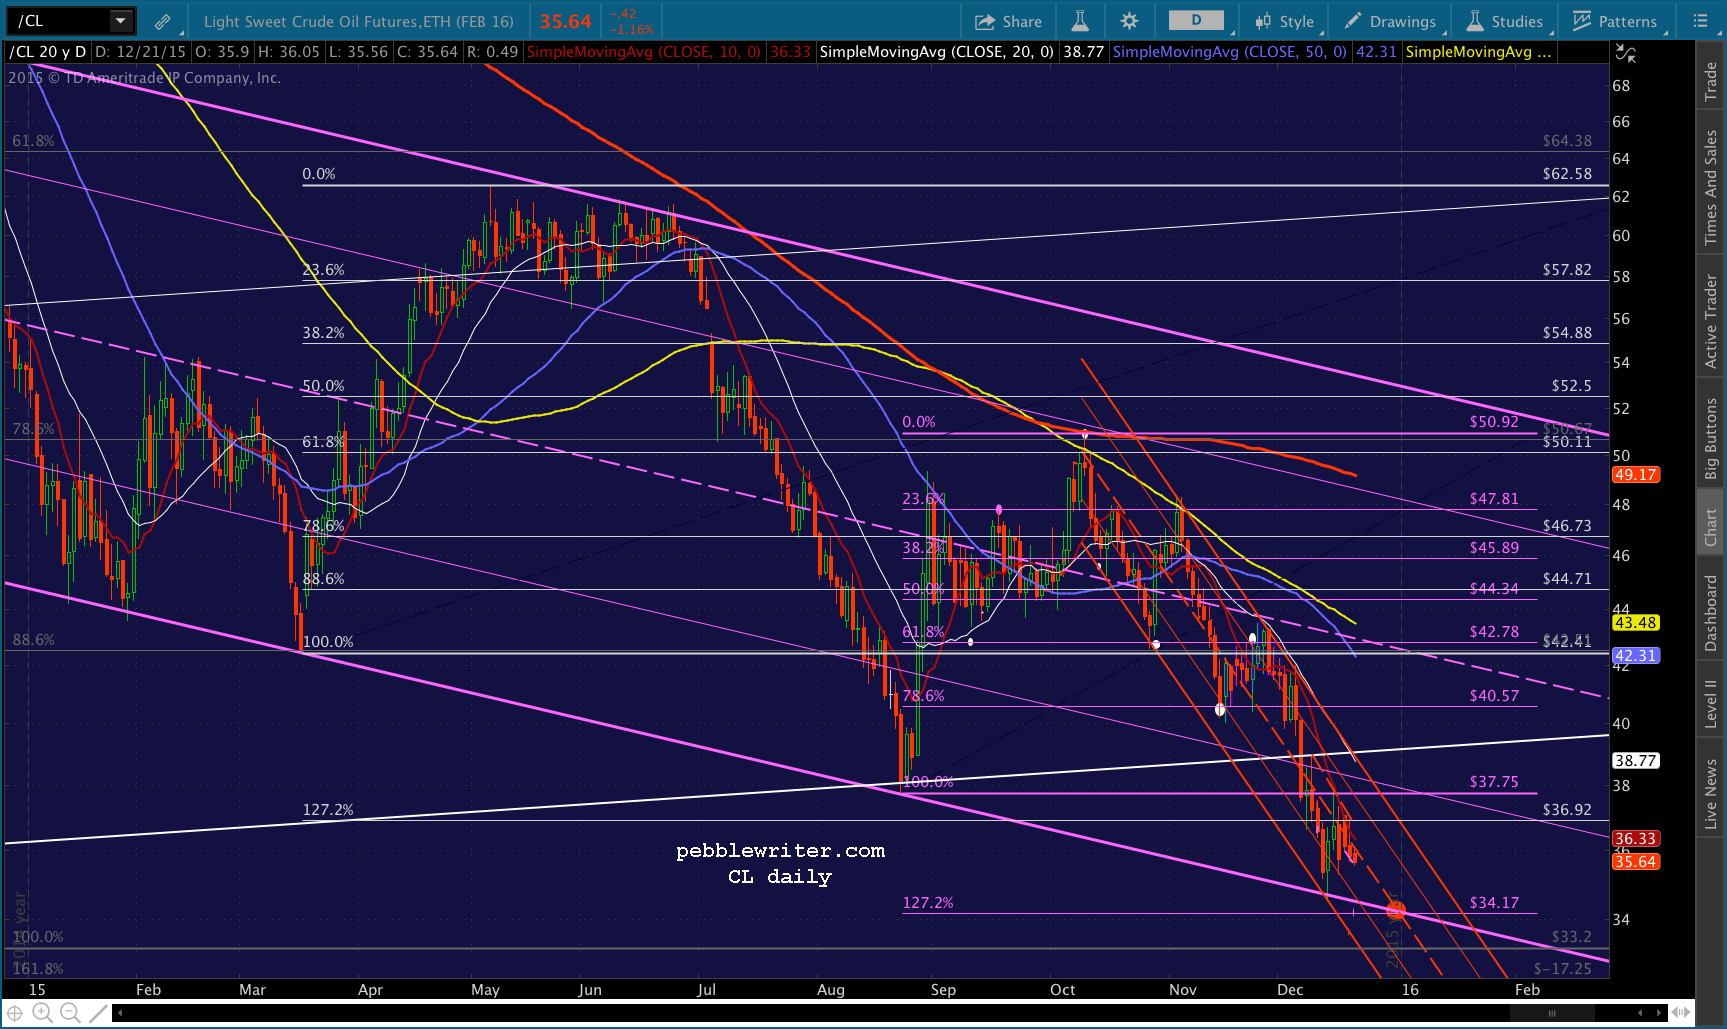 When I first wrote about it months ago, it seemed a little crazy even to me. If USDJPY suddenly breaks out above the red TL off June’s highs, I’ll feel a little less crazy.
In sum, if all these things play out, we should have new highs over the next two weeks. Ramp jobs to new highs and busting patterns are considerably easier over the holidays, as we saw in 2013.
If any of them don’t, then we’re looking at another test of the rising purple channel and, potentially, new lows. The past year has been exceptionally difficult to swing trade, as the overnight moves have typically been contrary to the session action — particularly when stocks sold off. In other words, TPTB have maintained very tight control.
I expect the week to come to either exhibit more of the same. If the “market” recovers tomorrow as it is currently signalling, look for USDJPY, CL and VIX to continue to drive prices higher.
I’ll be working limited hours this week. I expect to post each morning for an hour or two, and then take time off to be with family. At present, I am sick as a dog. So, please don’t be surprised if I don’t rally in time for tomorrow’s open.
Upside targets start with backtesting the rising white channel at 2023. If it is regained, then ultimately SPX should try to break out of the falling red channel and above the purple channel midline – perhaps around the red .786 at 2090.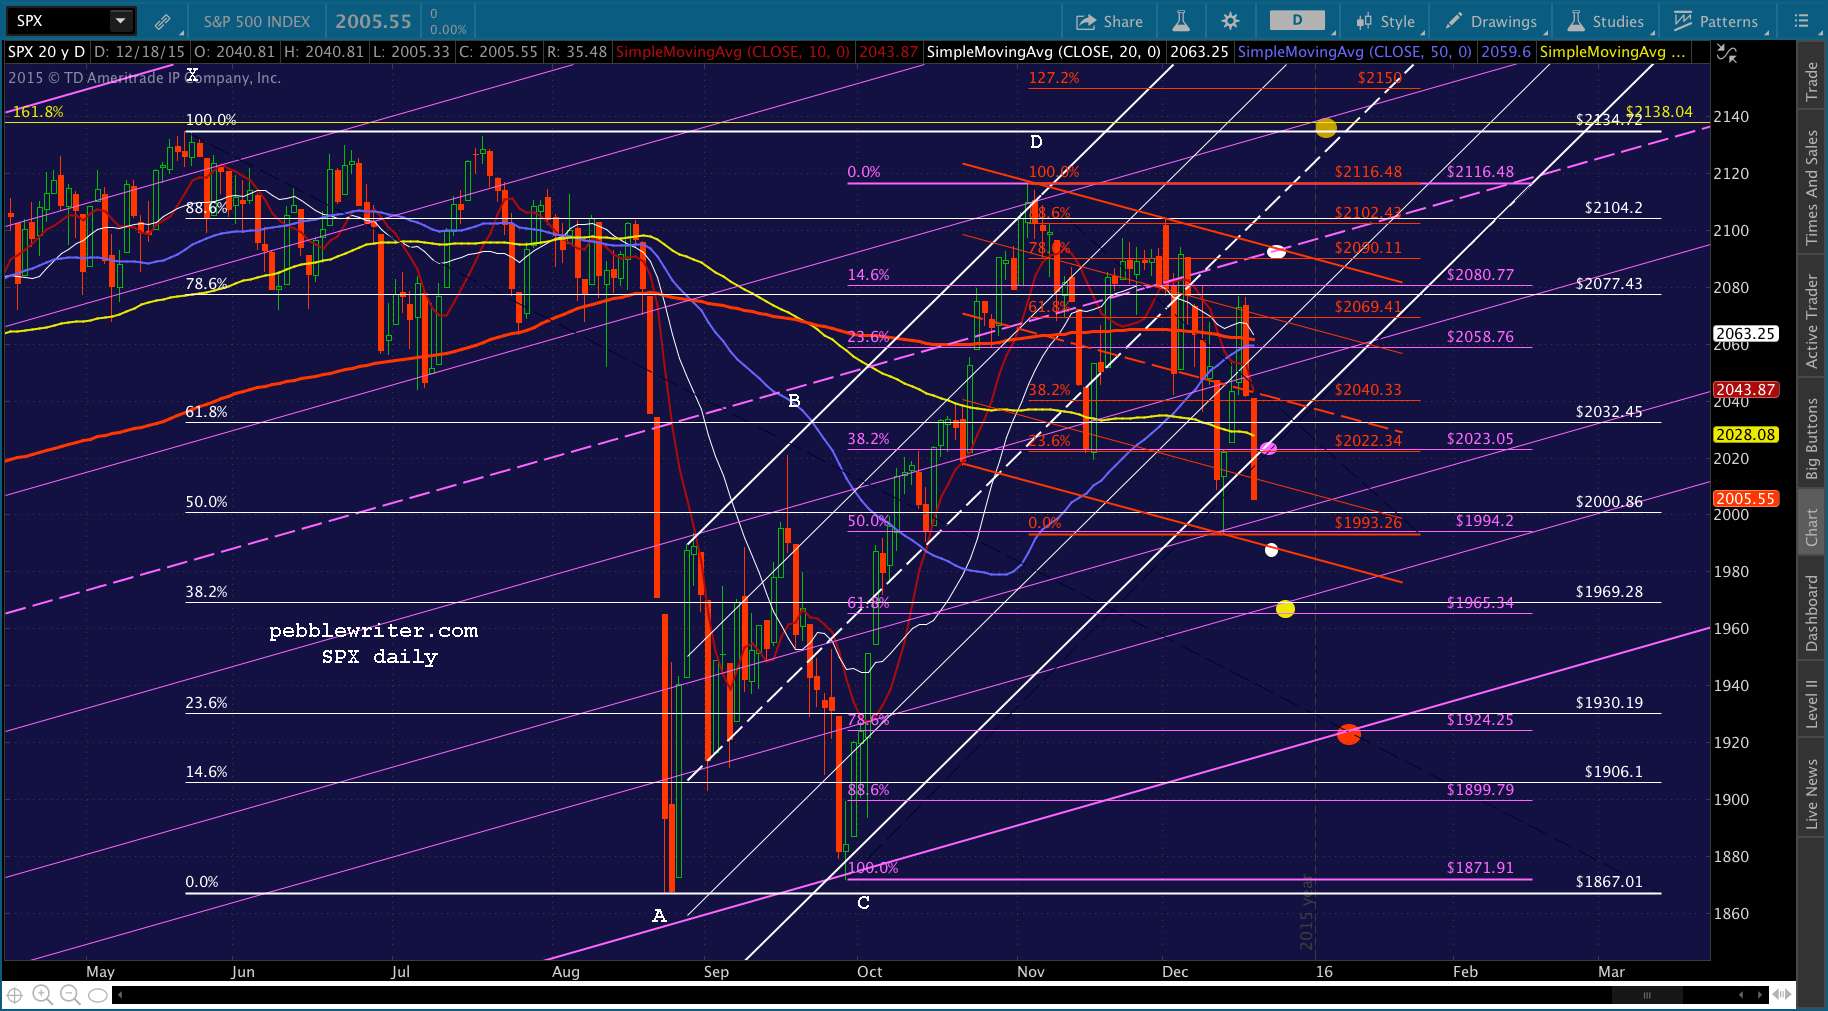
The downside case is likely another test of the falling red channel bottom and, potentially, the purple .618 at 1965, followed by a test of the rising purple channel bottom at the purple .786 at 1924.
UPDATE: 9:25 AM
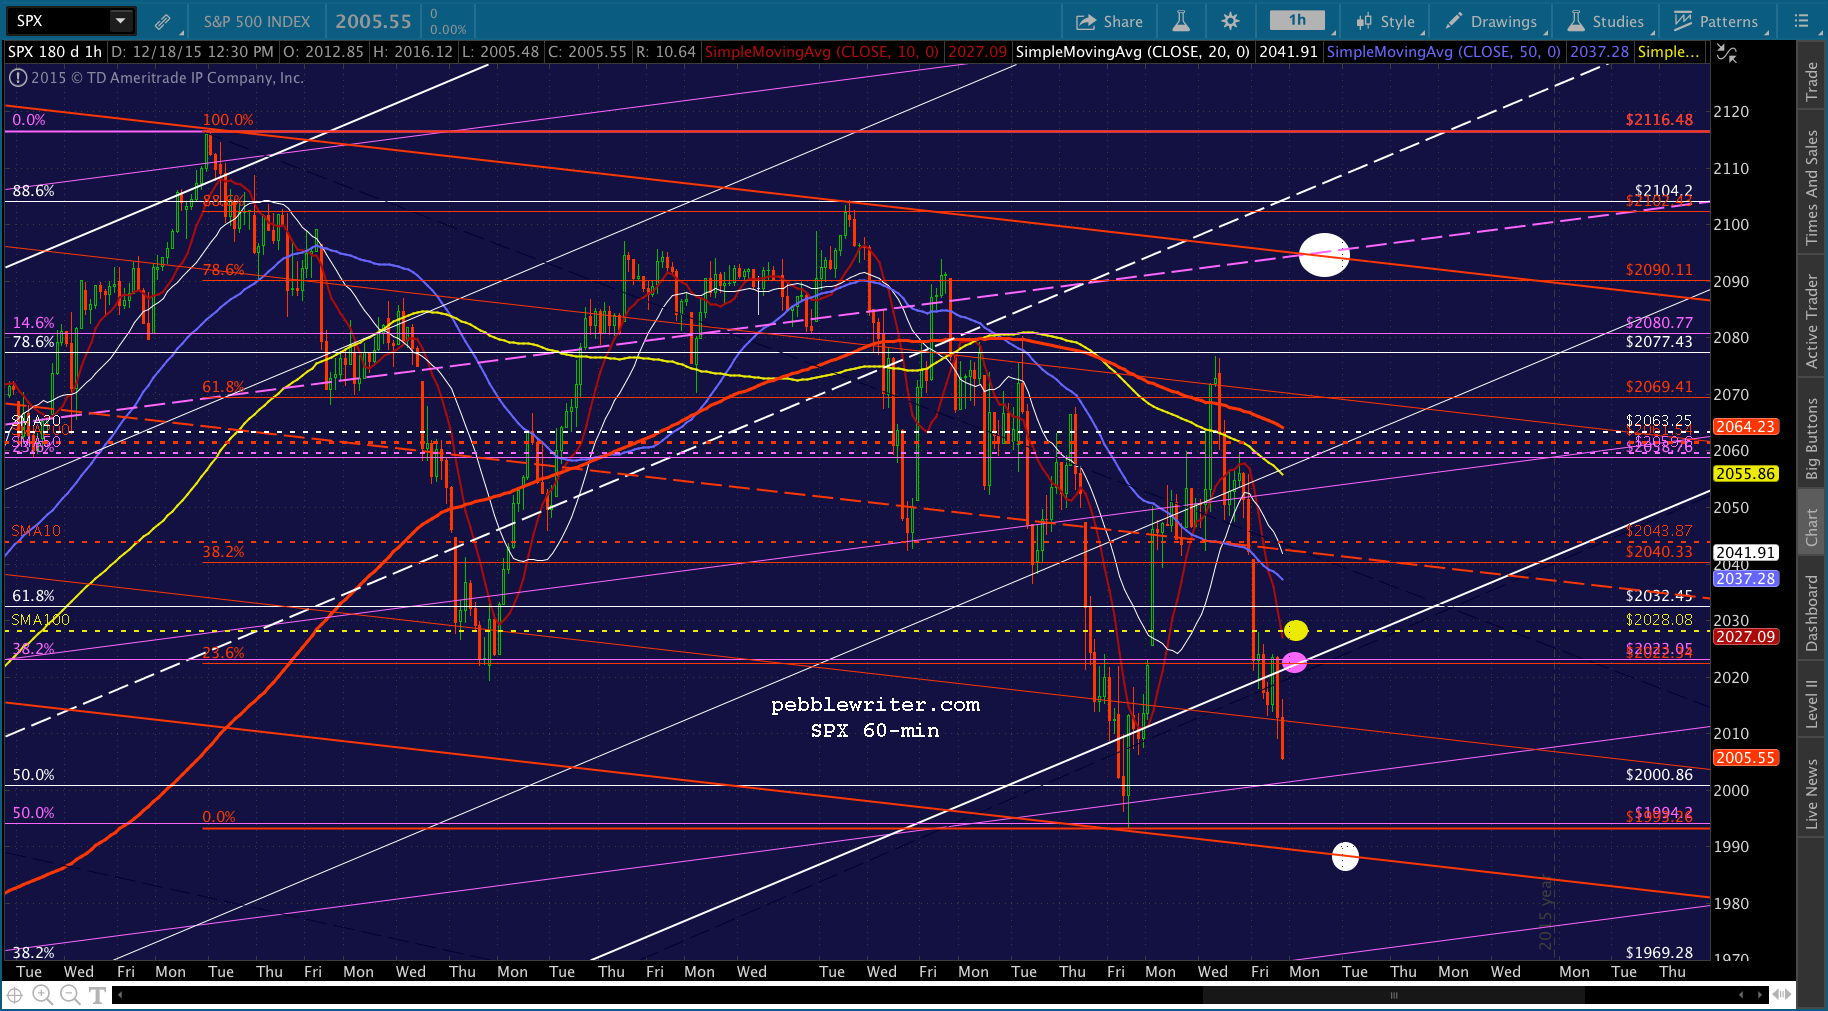
Futures are up 18; so, I’d be long on the open with a hard look at exiting around 2022-28. Here’s a close up for SPX, USDJPY, ES and CL.
 UPDATE: 9:33 AM
That’s the first target down. I’d close the long here at 2022.74 and short with tight stops (the SMA100 is just above at 2028.08.) The initial objective is 2015-16.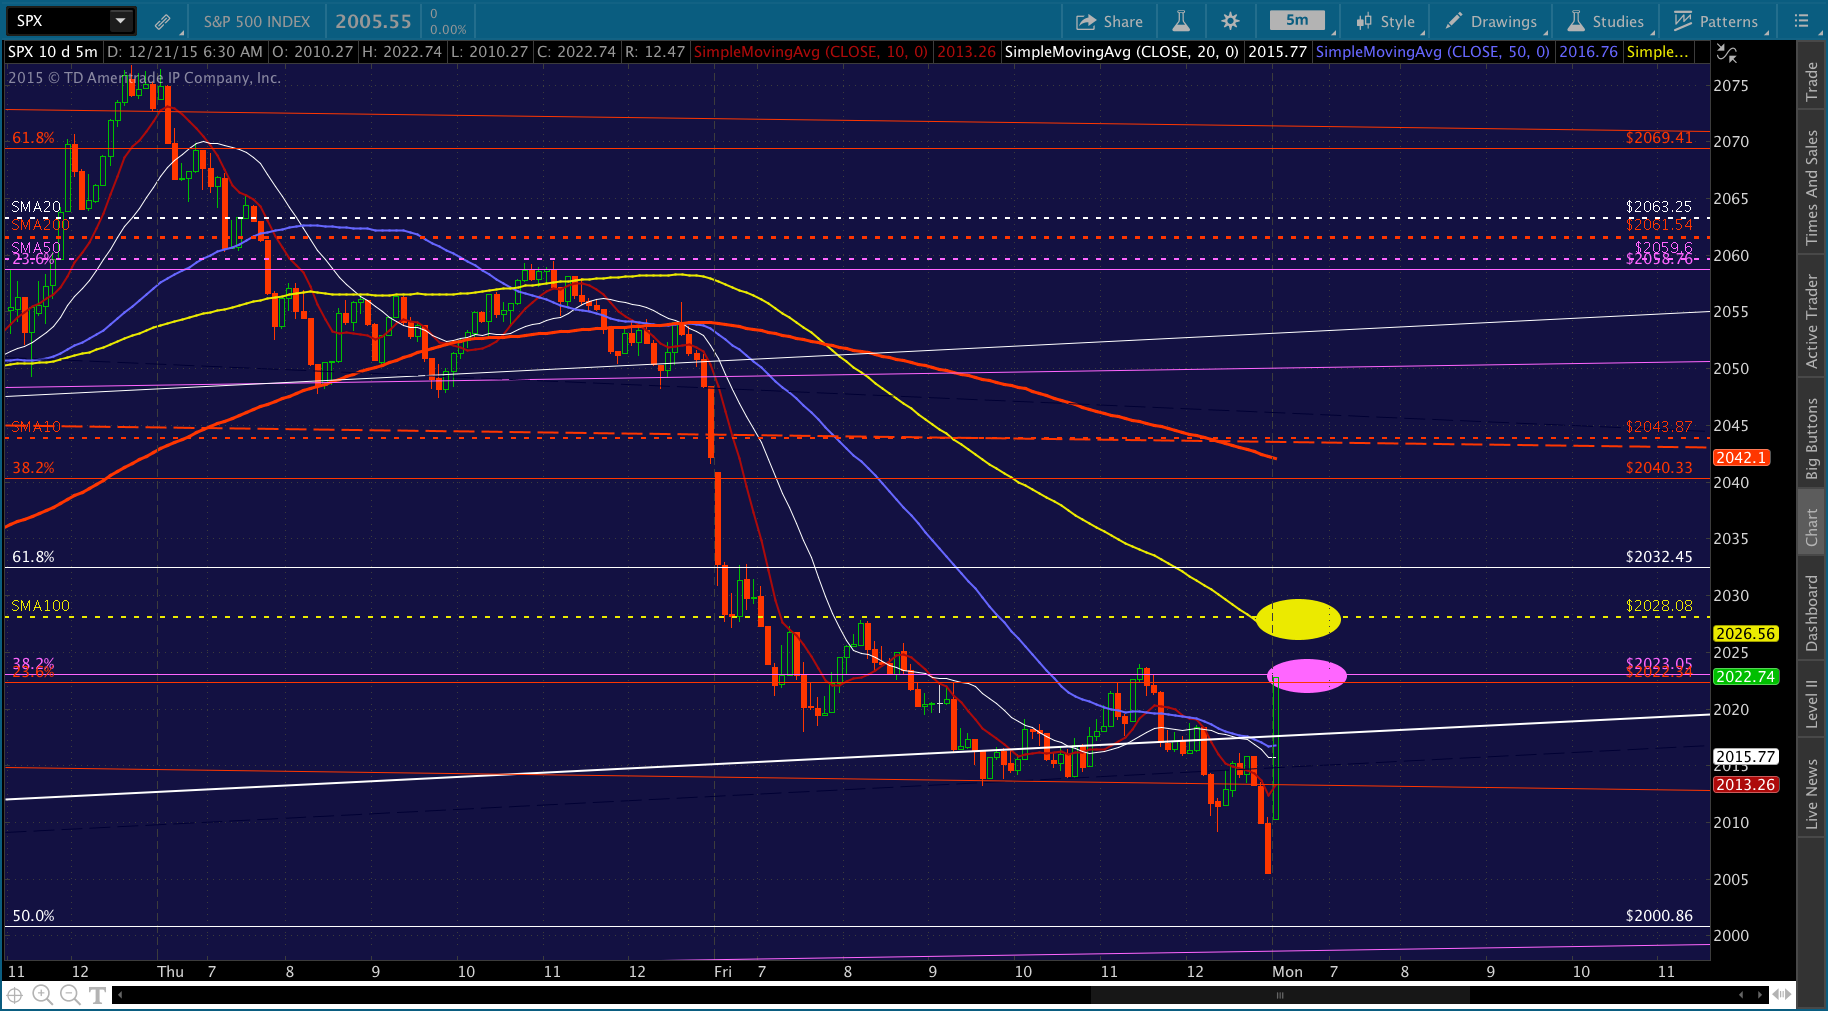
 UPDATE: 9:58 AM
That’s probably good enough for the short trade. I’d take profits here at 2015.48 and ordinarily revert to long for a run up to the SMA100 at 2028.08. The only problem is, I’m still sick as a dog. So, I’ll go to cash for the day instead.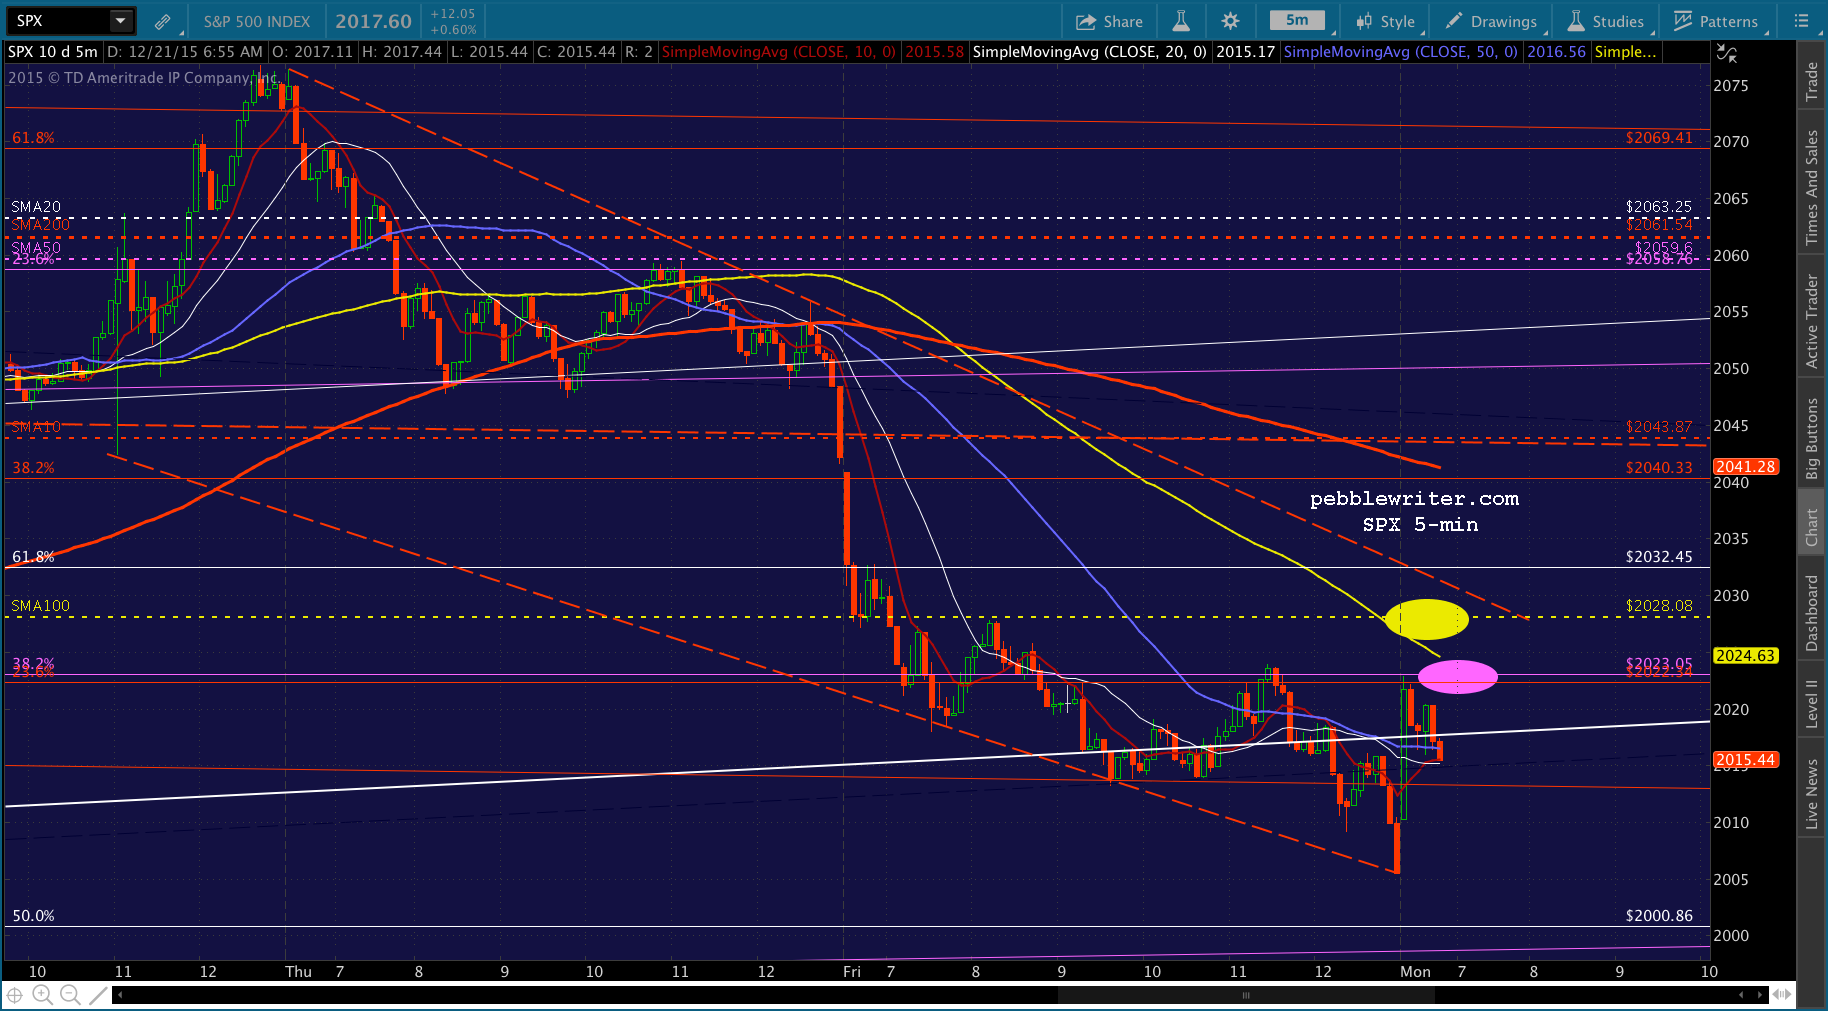 I learned a long time ago not to trade when I’m sick. And, I think that goes for dispensing advice, as well.
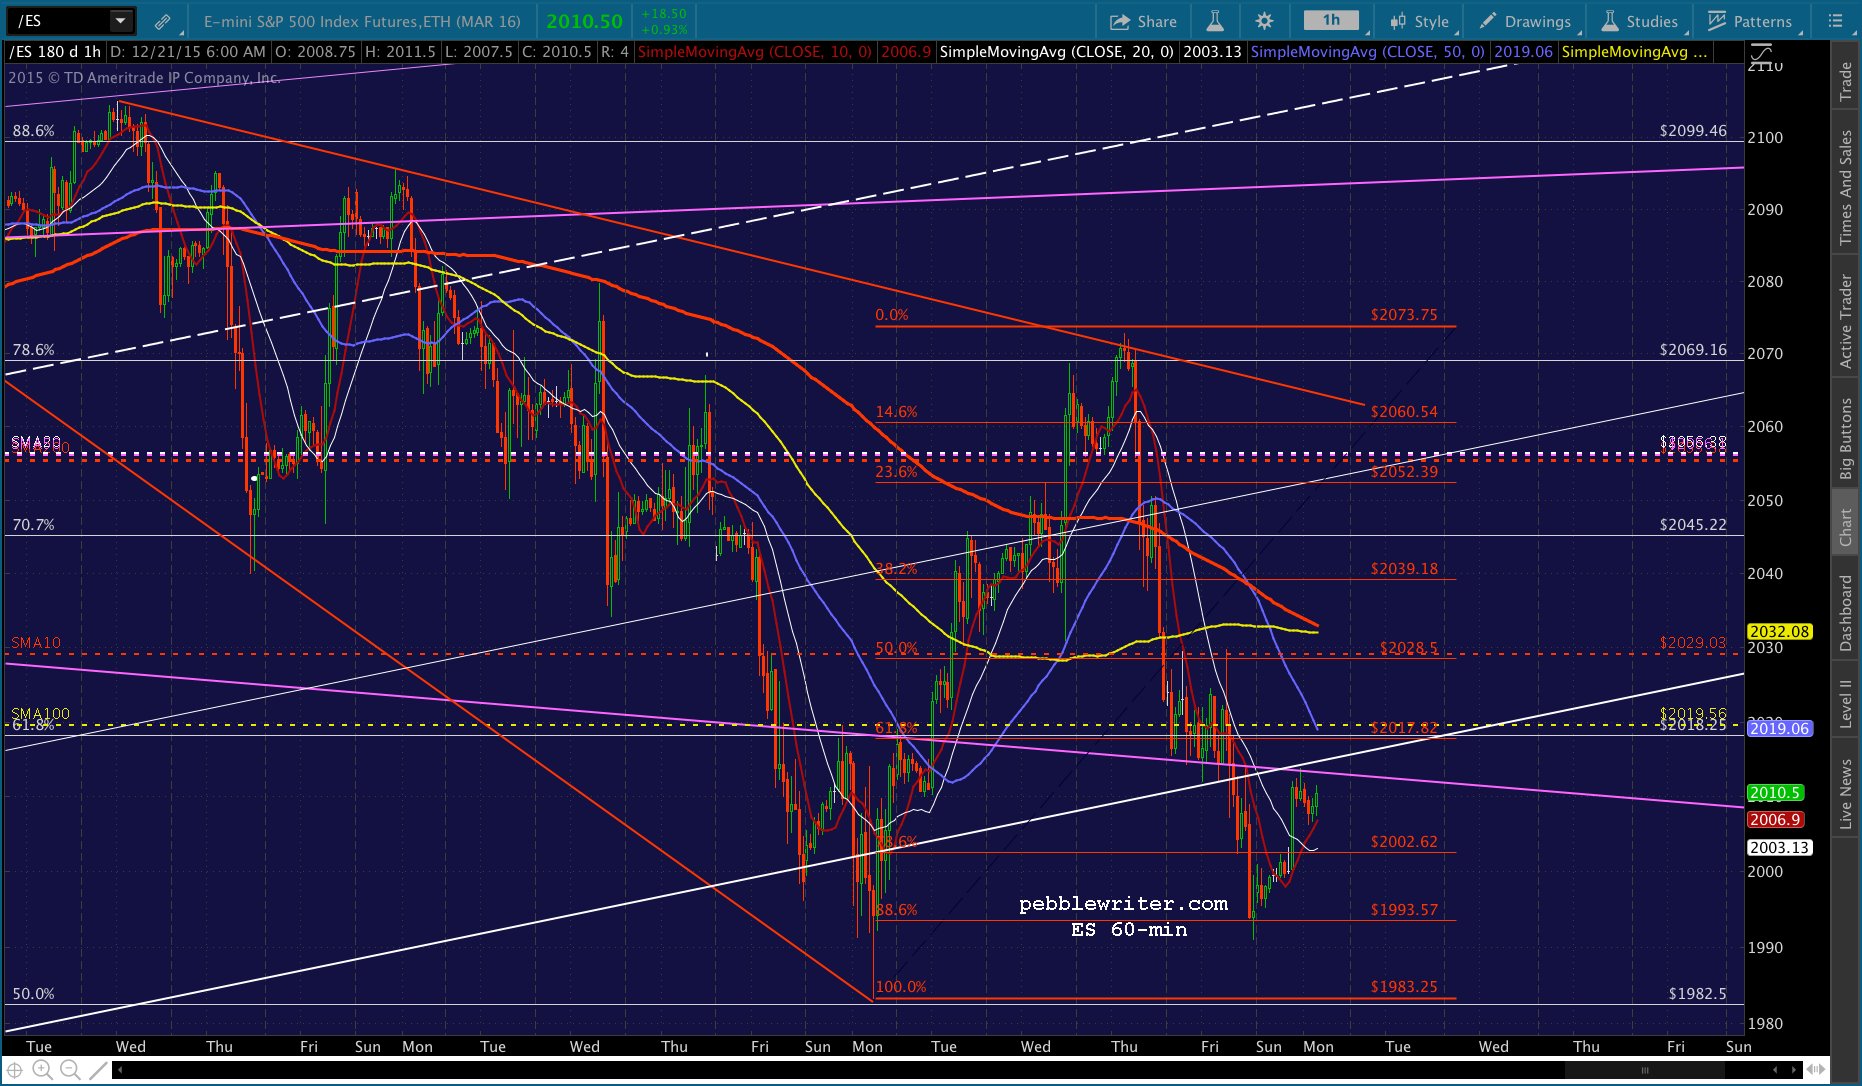
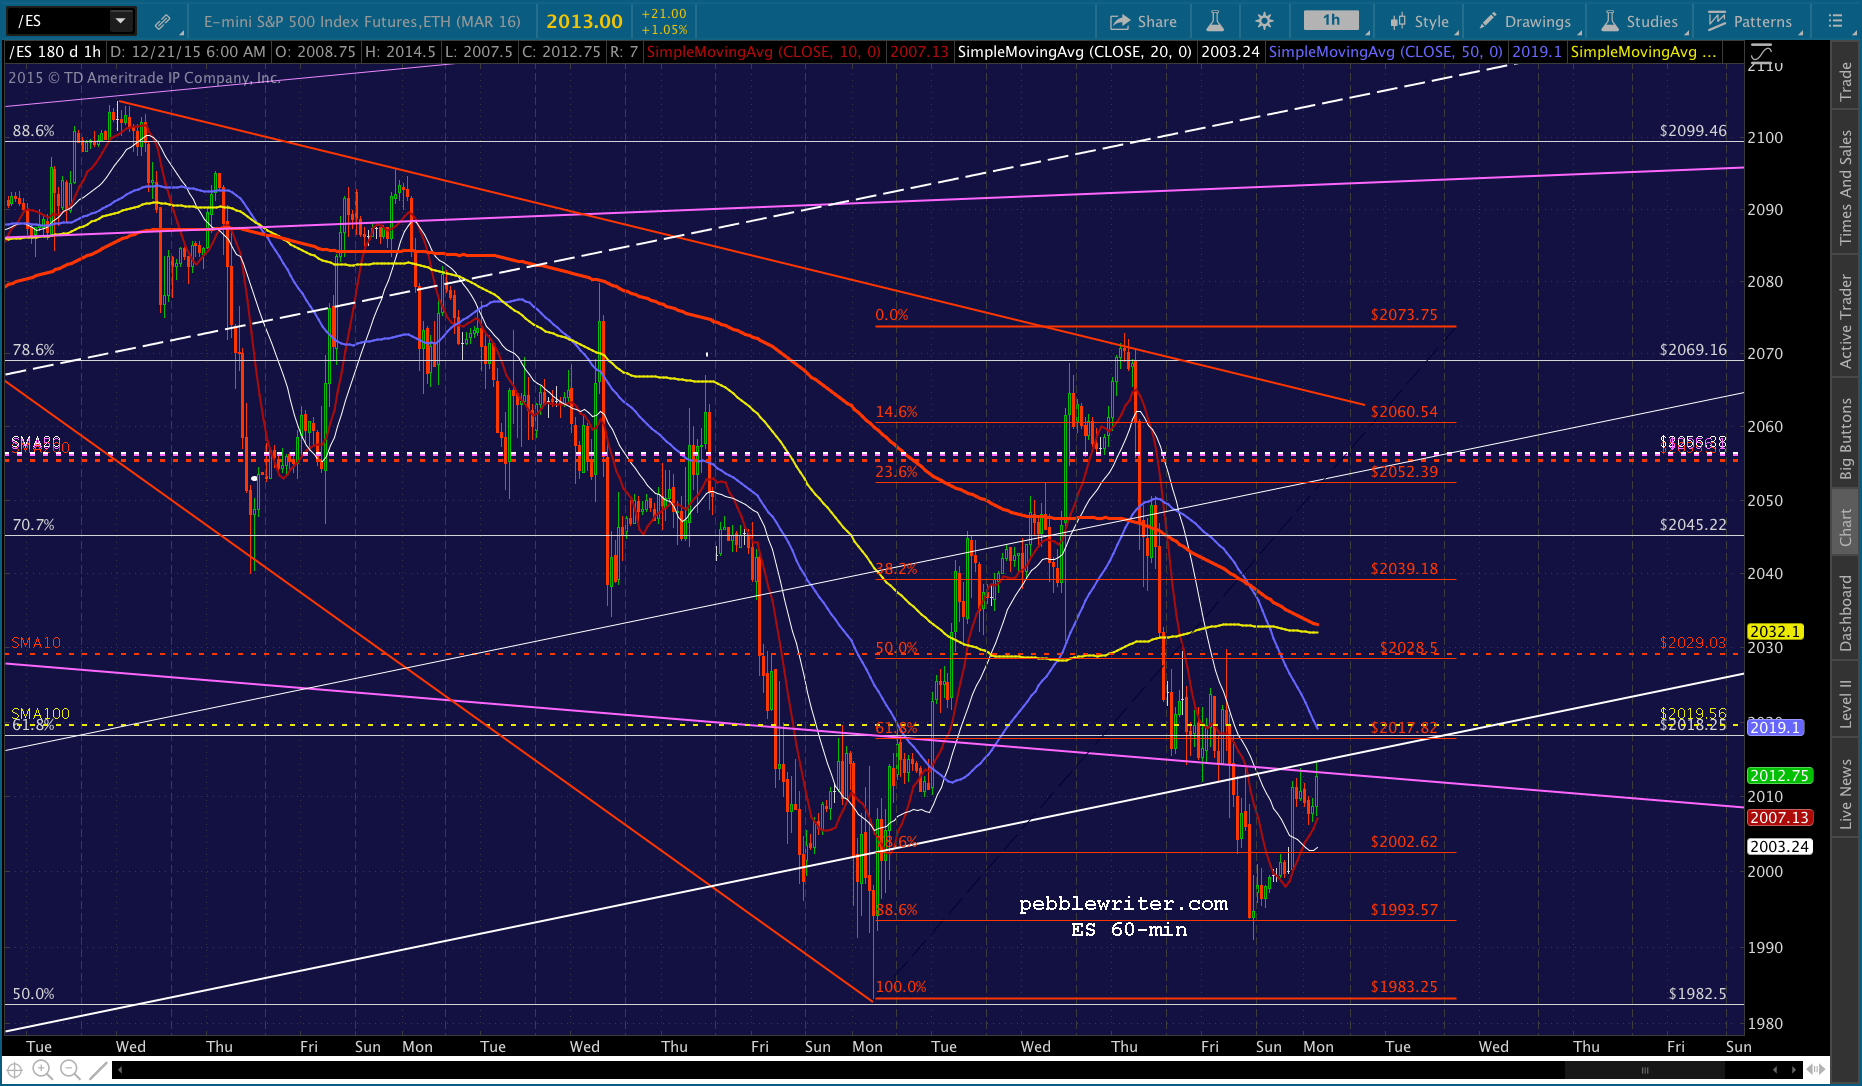
Besides, USDJPY is not supporting a bounce here, and I’m too foggy-headed to figure out exactly what’s going on. Could be all we’re going to get is the bearish channel backtest.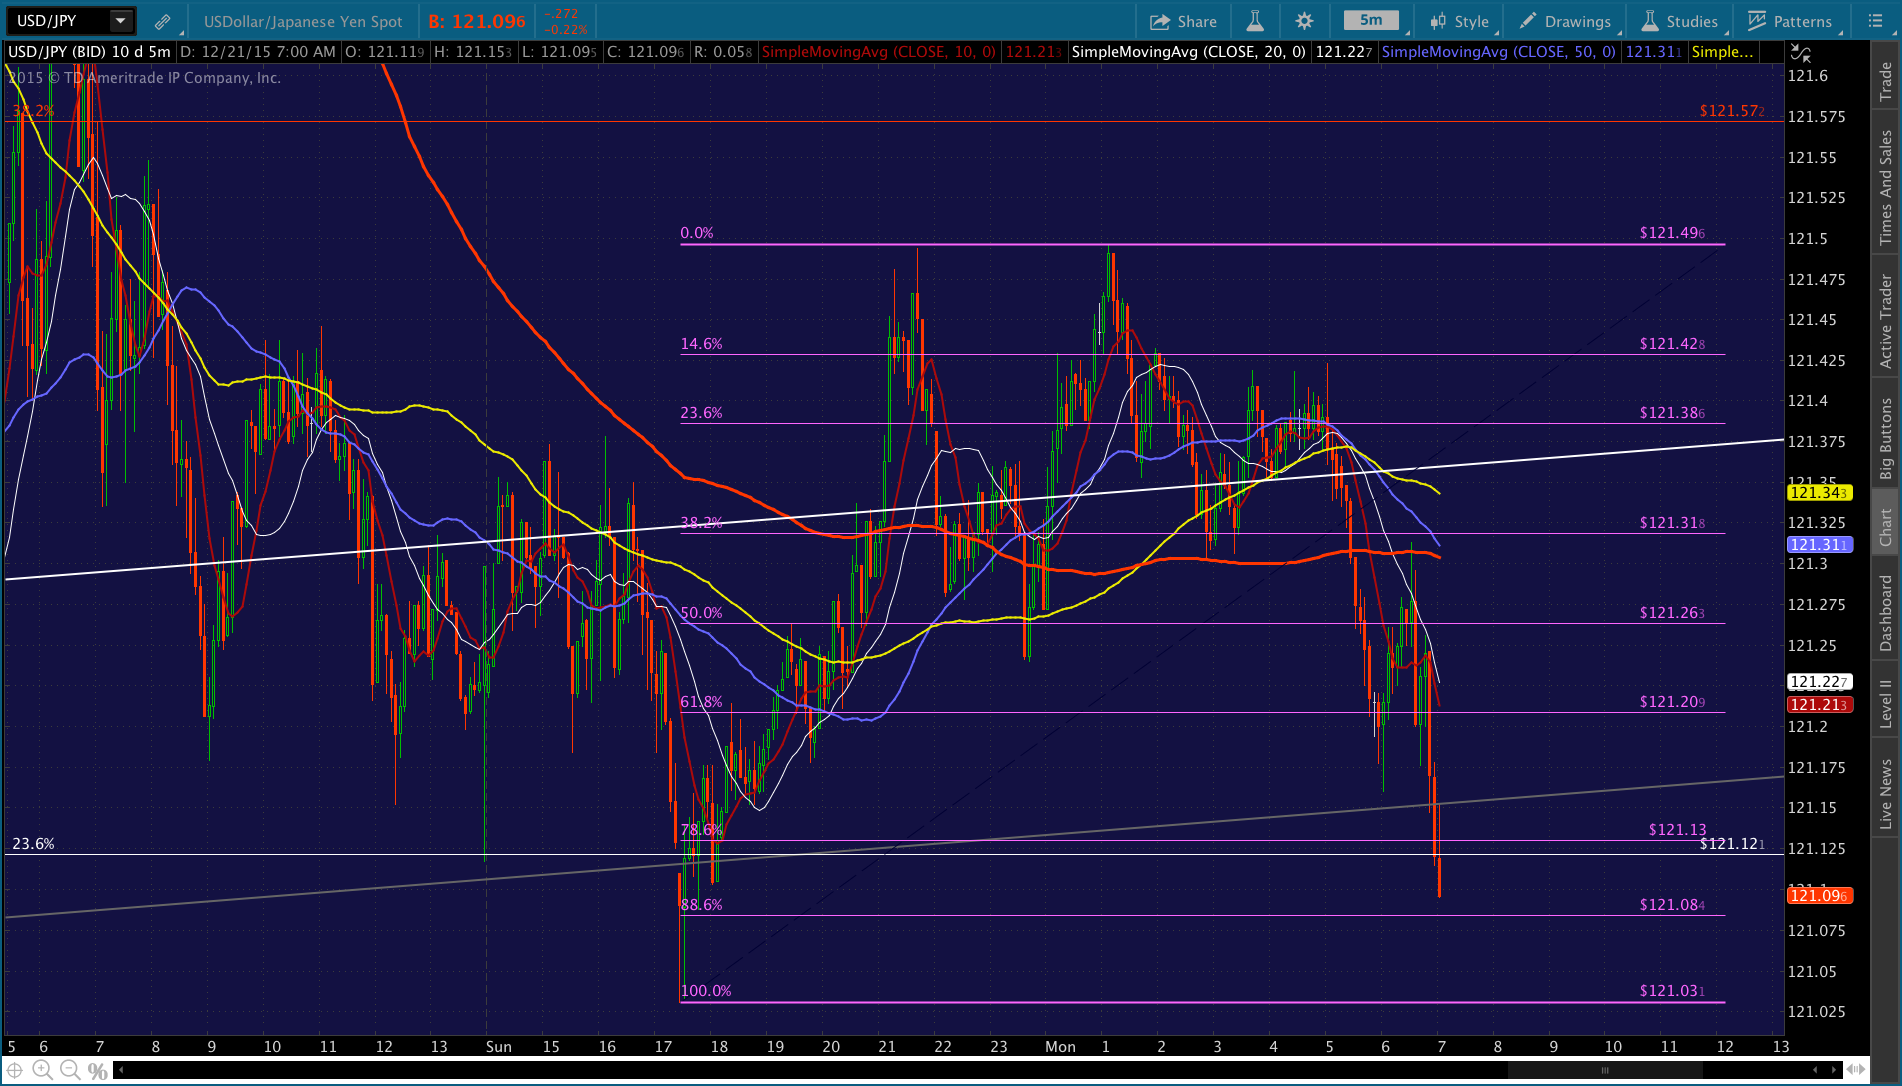 Support on ES is pretty clearly defined, so that should be a good barometer going forward.
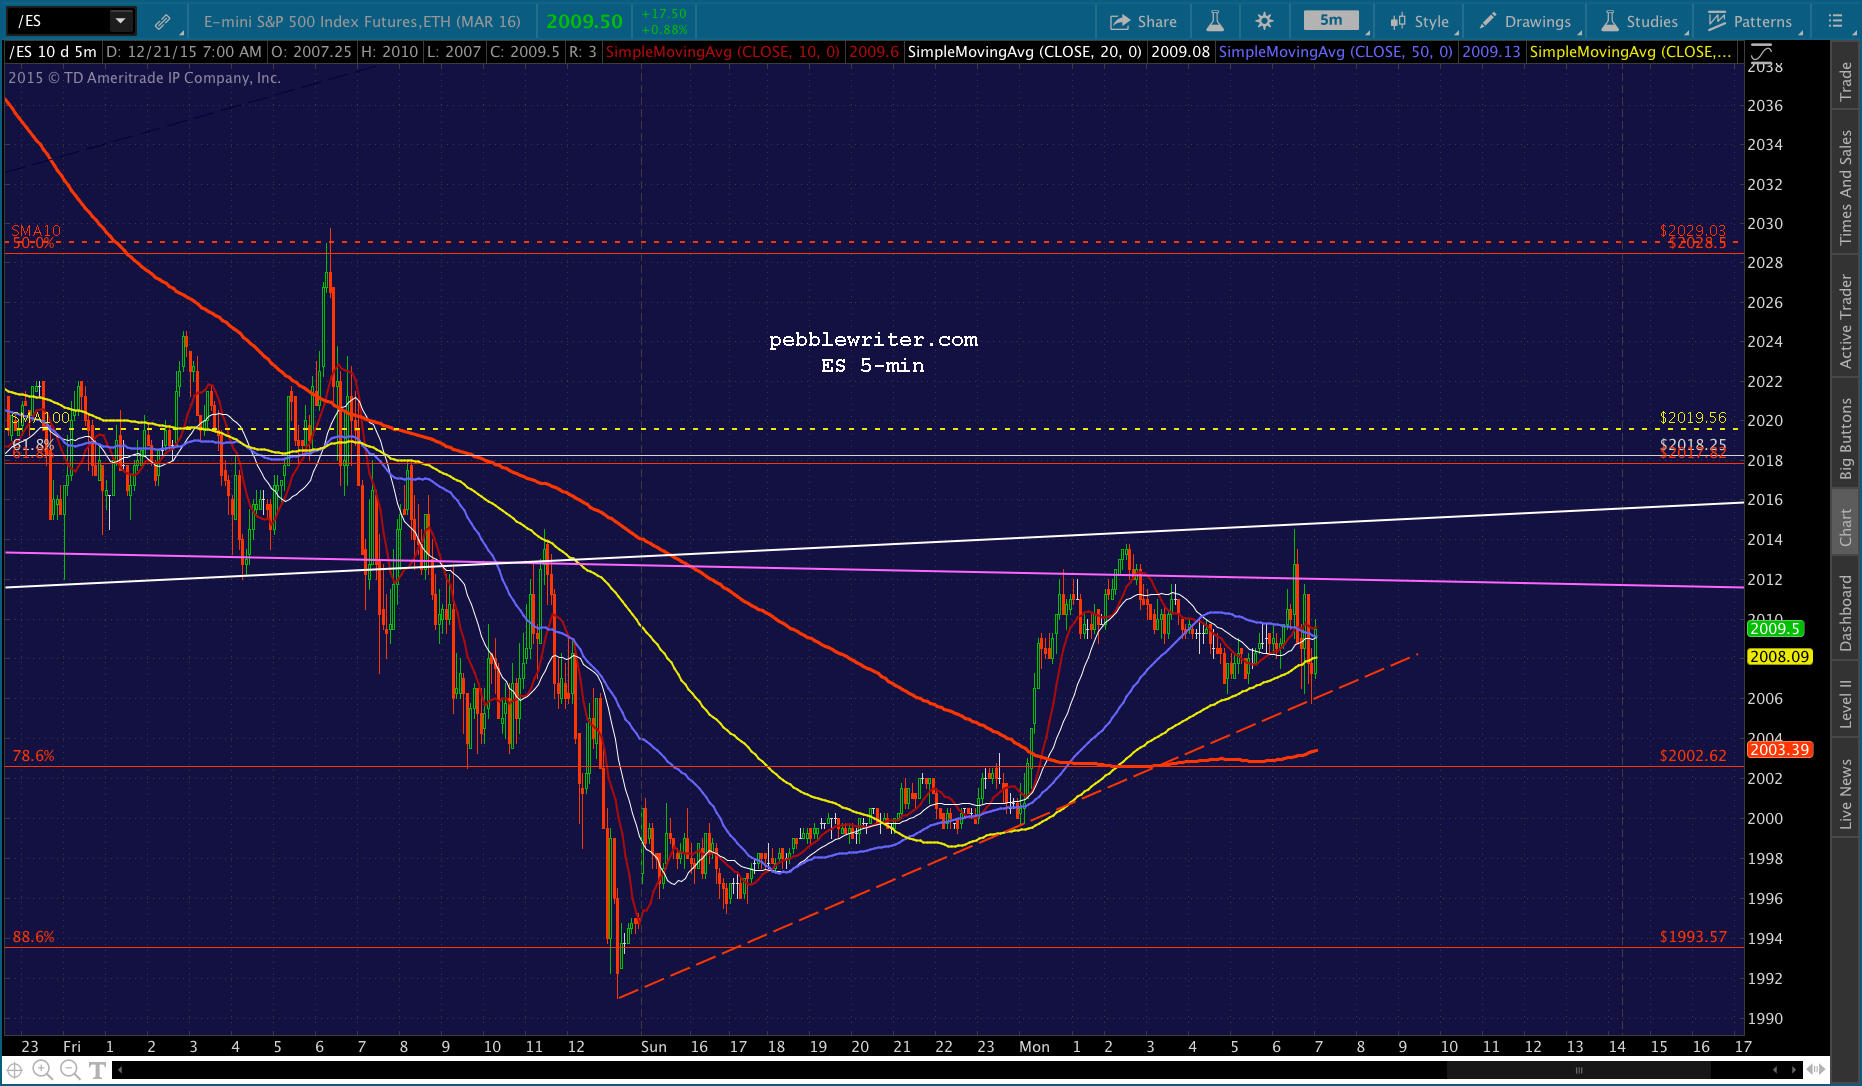 I hope to check back in a little later. GLTA.
Comments
3 responses to “The Big Picture: Dec 21, 2015”
Hope you’re feeling better soon, Pebble. Thanks for another great month!
what index do you trade
As you know, I chart SPX primarily. It seems to be the one index around which all the correlated index revolve. But, ES often takes precedence — especially when the two are out of sync and reaching ES’ target would be more bullish. As far as actual trading, I don’t recommend any particular instrument — though I’ve been partial to ES and in-the-money options that aren’t too far away from expiration. Both are very liquid and have very tight spreads.