UPDATE: 10:30 AM
Last night’s call on the dollar was timely. Check out the candle on the daily chart — the completion of both a Bat and Butterfly pattern.
 EURUSD also seems to have put in a bottom, though as mentioned earlier it’s going to take ein Akt des Bundestages (literally) to save the euro now.

ORIGINAL POST: 2:00 AM
Back on April 30, I held my nose and plunged head-long into the dollar, also shorting the euro. I’m pretty sure I invoked that age-old expression of confidence: “here goes nothing.” Hopefully, lots of pebblewriter members went along for the ride.
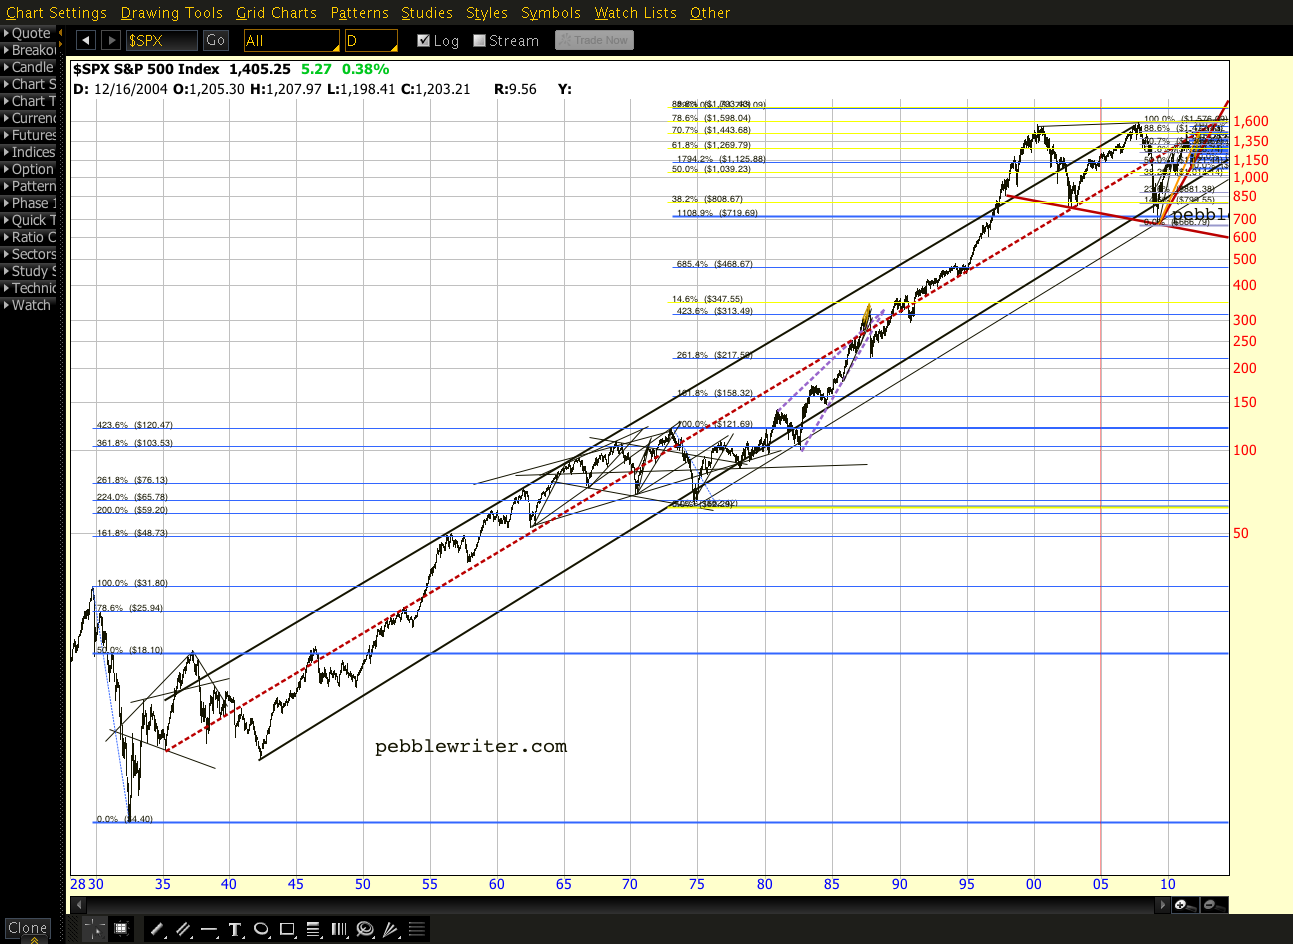
In that night’s post [see: Bet Your Bottom Dollar] I put up the following chart:
 I immediately regretted sketching out the forecast in such detail; and, in fact, I caught a lot of guff from a few readers for so recklessly calling the bottom (you know who you are, wretched givers of guff!)
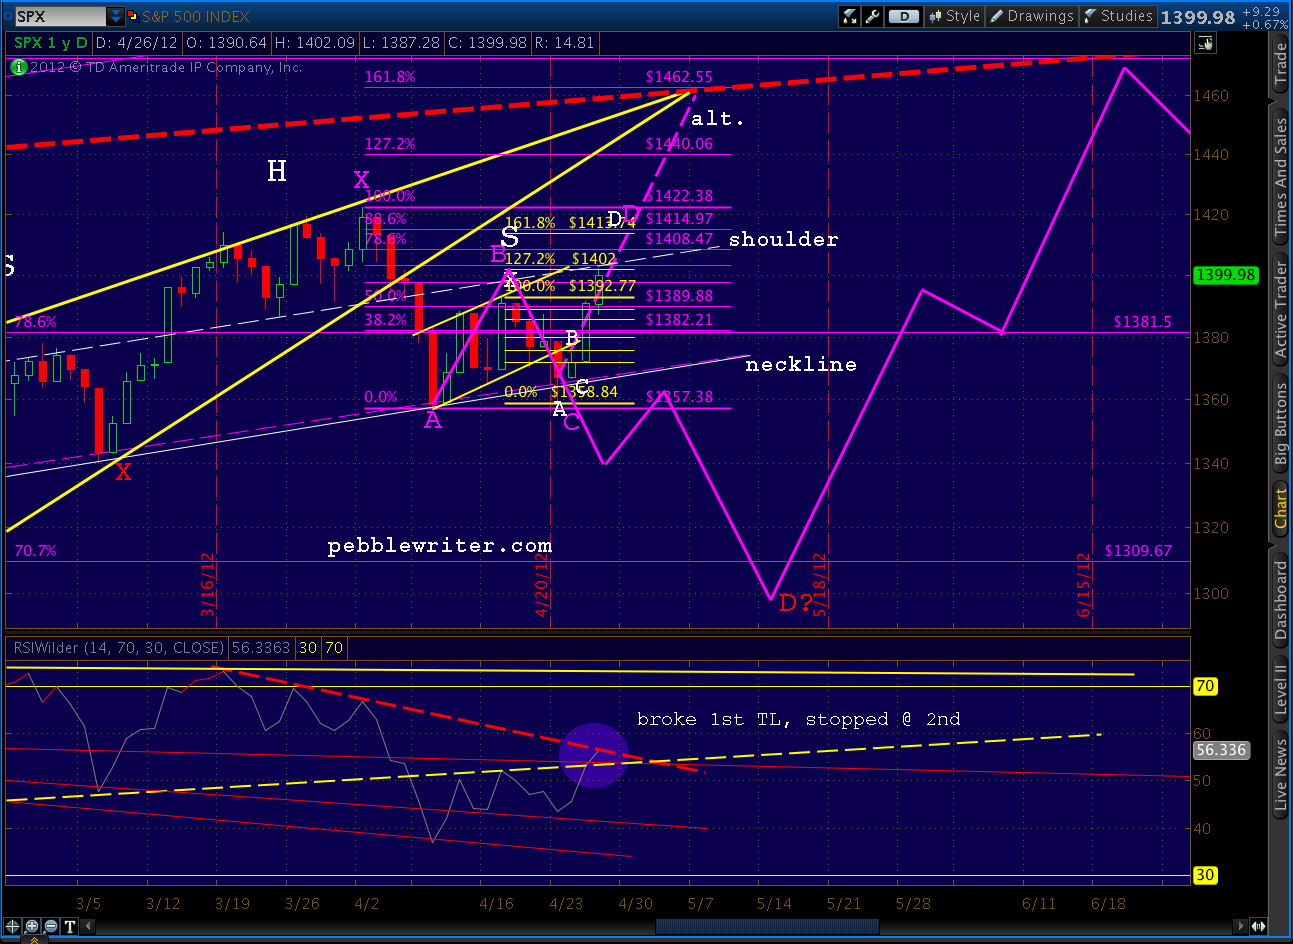
I didn’t look at the chart for a few days, but knew things were going my way. I just didn’t realize how well things were going my way… Here’s the same exact chart two weeks later.
 It deserves a close up…if only to show how spooky a forecast it turned out to be.
 Throwing caution to the wind, I also posted the EURUSD chart below and wrote:
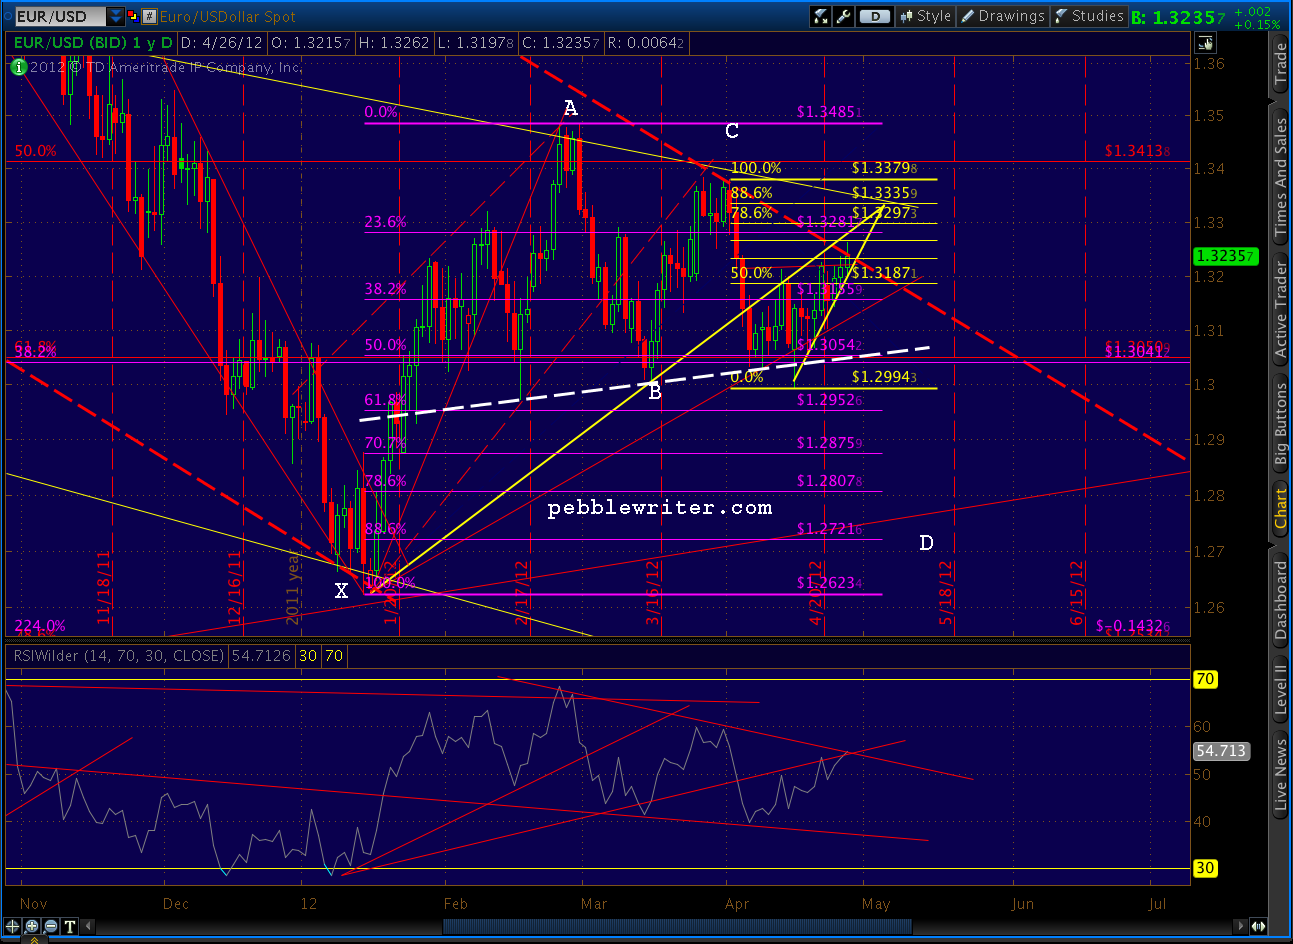
Meanwhile, the EURUSD shows signs of finally breaking down. Both the pair and the RSI action show a rising wedge that’s bumping up against a well-established channel.
Note Point D — the completion of a Bat pattern — sitting down there all by its lonesome.
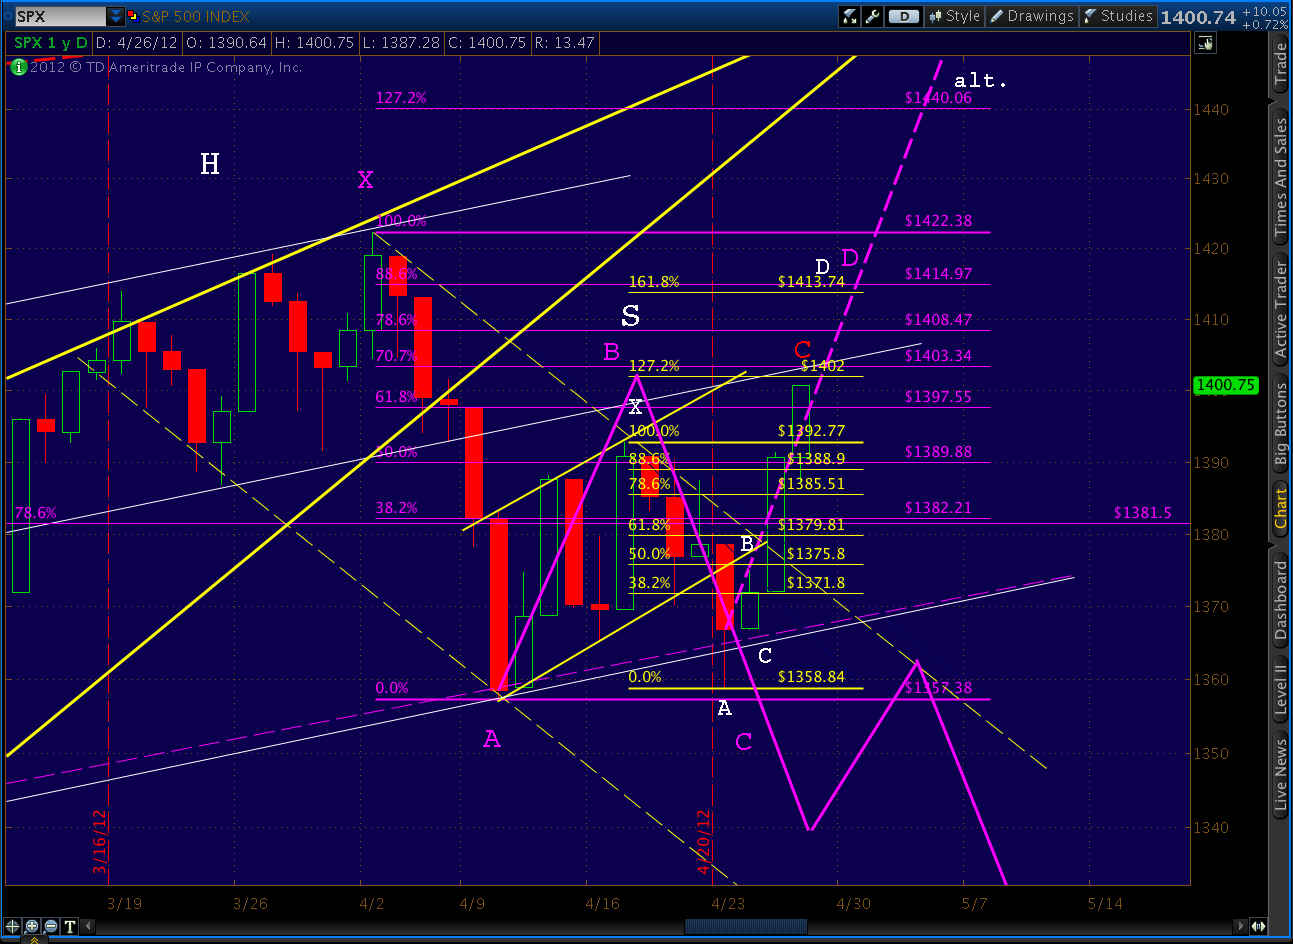
 It now looks like this:
 Yikes! Harmonics don’t always work as well as they have this past month. But, when they do, man is it fun!
************
As far as the road ahead, EURUSD crossed a incredibly important fan line today. It’s either fallen off a cliff, or it’s doing that roadrunner-running-in-mid-air thing. On the other hand, it has completed a Bat pattern (as has DX) that should mean a reversal. The next 24 hours are critical.

 If I had to guess, the RSI leads me to believe we’re going to see a big bounce. But, I’m taking my profits and sitting this one out. If it plunges below the fan line, there’s plenty more downside where that came from.
If it doesn’t, it’ll be because Merkel and Hollande are caught on video, breathlessly moaning “long live the troika” while mending post-election relations.
Seriously, though, a stick save would almost certainly entail a commitment to all things Greek, Portugese, Spanish, Italian, etc. and more LTRO — lots and lots more LTRO.
Stay tuned.
*************
For the last several weeks I’ve been double-posting pebblewriter.com stuff on the original blog and holding this open for former followers. This website has been up for nearly a month now, and it’s time to start winding the other one down. [why?]
If this blog is helpful to you, jump on the introductory prices while they last. I’ve extended the 10% off discount for all new members through this Friday, the 18th.