Tag: RSI

  • Slip Sliding Away

    We’re getting dangerously close to our downside target range of 1295-1323, first discussed back in April.

    • 1349.42 — .886 of the purple Butterfly (tagged)
    • 1343.41 — 1.272 of the yellow Crab pattern (tagged)
    • 1340.03 — horizontal support, prev. Point X  (tagged)
    • 1323.85 — 1.618 of yellow Crab (next)
    • 1317.63 — 1.272 of purple Butterfly
    • 1289.14 — 1.618 of purple Butterfly (and 2.24 of Crab)

    I have been viewing the downside as consisting of three basic scenarios:

    (1)  stick save: Fed freaks over Europe, QEish leak limits downside to 1349 (fail)
    (2)  top case: normal Butterfly completion to 1.272 (1317) or 1.618 (1289)
    (3)  panic sets in: crash and test bottom or large red rising wedge around 1200

    The daily RSI has reached an important trend line of support (solid, purple) and, unlike FTSE, has yet to exhibit positive divergence — meaning it could go lower and tag the dashed purple line.

    I suspect the solid line represents 1323 and the lower, dashed line 1289-1295, but that’s pure speculation on my part.  As we approach 100-pts off the 1422 top, look for lots of investors to throw in the towel.  It’s this capitulation that we need if we’re to see a meaningful rebound.

    As I wrote back on April 12 [see: Analog Details]:

    To me, a drop to 1305-1317 seems fairly plausible.  The tricky part comes in calling for a reversal after SPX has fallen 120 points from its recent high.  The timing looks to be early May.

    Will the Fed and ECB come to the market’s rescue yet again?  I think so.  I think they understand as well as the rest of us how close to the precipice we are. It’s stupid economic policy that will make things worse in the long run, but since when did that matter?

    On the other hand, I have no doubt that the looming derivatives disaster [see: There is Nothing Wrong] I’ve been writing about — handily verified by JPM — could be beyond their ability to control (hint: 2008 all over again.)

    Stay tuned.

    **********

    And, for fellow Simon & Garfunkel fans…

  • Two Targets Down…

    Yesterday, we hit our initial downside target laid out over the weekend [see: So Far, So Good] when we nailed the Fibonacci .886 retracement of the Butterfly pattern (purple) we’ve been following since April 10.

    We bounced hard there, as the RSI chart indicated we might [see: 3rd Time a Charm] and completed a back test of the H&S pattern neckline [see: Back Test Complete] by actually closing on the neckline.

    This morning, we bagged the next target on our list, the 1.272 extension of the smaller Crab pattern (yellow) at 1343, which has me wondering…what’s next?

    Not that it always works this way (enjoy the streak!), but here’s the original list:

    • 1349.42 — .886 of the purple Butterfly
    • 1343.41 — 1.272 of the yellow Crab pattern
    • 1340.03 — horizontal support, prev. Point X
    • 1323.85 — 1.618 of yellow Crab
    • 1317.63 — 1.272 of purple Butterfly
    • 1289.14 — 1.618 of purple Butterfly (and 2.24 of Crab)

    The charts say there’s plenty more downside.  My top case remains 1289-1317.  Though we’re back to that RSI trend line (k-5) that provided yesterday’s bounce.  We can get to 1289 with a cross of that trend line or without. It’s a matter of “recharging” RSI with bounces such as we saw yesterday and this morning.

    At the end of the day, the “bottom” should exhibit positive divergence, and we’re nowhere near that yet.

    So, is it time to pile on more shorts?  If we’ve scored 5 waves down, we should see an a-b-c corrective wave.  As I posted last night, there’s a potential small H&S pattern developing in the right shoulder of the larger pattern.  Prices could loiter in the 1340-1370 area for a day or two and flesh out the small right shoulder before continuing down.  A 7-pt gain at the close would shake out lots of shorts.

    This would offer the added benefit of fully recharging RSI/MACD for the next push down — a very helpful development, should it occur.  I’ll be watching to see if RSI heads up into the intersection of that bold yellow trend line above with the bold yellow channel.

    Good luck to all.

     ********

    Now, we see that the euro zone is considering holding back the next installment of Greece’s bailout, some $5 billion or so. They have this crazy notion that the Greeks might renege on the austerity package/debt restructuring previously agreed to.  All together, now: “duh!”

    Whatever your opinion of why Greece has money problems, the bailout did very little to help the Greek people, who just expressed their heart-felt feelings about austerity in the voting booth. It mostly bailed out the bankers who made too many stupid loans to Greece (gee, where have we seen this before?)


  • 3rd Time a Charm?

    UPDATE:

    Down to 1350.76 so far, getting close to the .886 of the larger purple Butterfly pattern.  We didn’t bounce much at all when RSI first hit its fan line, a show of strength for the bearish case.

    The next test is the 60-min RSI, which has reached 18 — the low since August of 2011 and a sign of short-term oversold condition.  A push into the 17 range would be extremely bearish, though I suspect we’ll get a bounce before too long.

    A reminder of our downside targets posted on the 6th [see: So Far, So Good]:

    • 1349.42 — .886 of the purple Butterfly
    • 1343.41 — 1.272 of the yellow Crab pattern
    • 1340.03 — horizontal support, prev. Point X
    • 1323.85 — 1.618 of yellow Crab
    • 1317.63 — 1.272 of purple Butterfly
    • 1289.14 — 1.618 of purple Butterfly (and 2.24 of Crab)

    I talk a lot about bounces, but watch the market’s momentum.  If we slice through one level, consider adjusting stops rather than closing out positions.  We’ve seen it happen often enough on the upside — where logical reversal points were routinely ignored by a runaway bull.  The same thing can happen on the downside.  It’s just been so long that it’s easy to forget, LOL.

    ORIGINAL POST:

    This push below the neckline looks rather convincing, but — as before — the key is a close below it, currently around 1364.  The fly in the ointment is the RSI, which just tagged the fan line from Aug 2011.  It should provide at least a bounce.

    More shortly.

  • So Far, So Good

    Over the past 5 weeks, our forecasts have been remarkably accurate.

    The Butterfly pattern identified back on Mar 29 [All the Pretty Butterflies] correctly called the 1422 interim top.  As anticipated on Apr 10, we got a bounce at 1357 (the .786 of the 1340-1422 rise) and began tracing out a head & shoulders pattern that fit with an analog of the Feb-May 2011 topping pattern [Analog Details].

    The analog been very accurate thus far, although the initial right shoulder bounce had us wondering whether the alternate path to 1462 was playing out.  Our RSI indicators kept us on the right path.  Instead, we got a complex H&S pattern, with a second test of the neckline and subsequent round trip to the shoulder line, accurately forecast in both time and price.

    Friday’s bounce at 1367 was within 2 points of our 1365 target [2d Time a Charm], with a nice little back test — as forecast — to the neckline, where we closed out the week.  The only reason I mention all the above is that, while this degree of accuracy is always desirable, it’s not typical and should not be expected.

    Regardless of how well your investments have performed the past five weeks, don’t forget that they are out to get you.  Even now, as it appears that the analog is playing out nicely, the financial establishment is working overtime to separate you from your money.  There will be more times, such as in January, when perfectly good harmonic and chart patterns don’t play out as they should.

    Always use stops!

    Now, with that out of my system, it looks like the results of the Greek and French election, on top of Friday’s dismal non-farm payroll numbers, is going to provide the push we need to get on with the downside.

    Remember, our target is 1288-1323, although 1288 has been fudged to 1295 simply because a dip below 1292 would be problematic for the bulls from a wave count perspective;  i.e., I think they’ll pull out all the stops to avoid it.

    Potential bounces along the way include:

    • 1349.42 — .886 of the purple Butterfly
    • 1343.41 — 1.272 of the yellow Crab pattern
    • 1340.03 — horizontal support, prev. Point X
    • 1323.85 — 1.618 of yellow Crab
    • 1317.63 — 1.272 of purple Butterfly
    • 1289.14 — 1.618 of purple Butterfly (and 2.24 of Crab)

    But, I divide the downside into three basic scenarios:

    (1)  stick save: Fed freaks over Europe, QEish leak limits downside to 1349.
    (2)  top case: normal Butterfly completion to 1.272 (1317) or 1.618 (1289.)
    (3)  panic sets in: crash and test bottom or large red rising wedge around 1200.

    I expected to be able to update all of the charts today, but my youngest daughter has been home with stomach flu while my wife and daughter #2 were at an all-day volleyball tournament.  Needless to say, it wasn’t as productive a day as I expected.  Look for updated charts Monday.

    *****************

    Over the next couple of days, I’ll finish converting the new website to a premium site.  Many thanks to those of you who have joined up.  I hope you’ve been able to act on my forecasts; if so, you’ve more than earned back your subscription costs in the first week.

    To anyone still thinking about it, the end is near.  The old site will still display articles of general interest and delayed market updates.  But, members of the new site will enjoy the first and best of what I can put out.  To join now, click here.

    Good luck to all.

  • A Swing and a Hit!

    We didn’t have to wait long for the Bat pattern I posted at 11am to play out.

    The .886 target was 1414.97, and we reversed at 1415.32 at 11:50am — closing just a fraction above the subsequent low for the day of 1405.25.

    I was disappointed to be stopped out of my short position early this morning, but more than made up for it by establishing new shorts at 1415.  I enjoy 60% intra-day profits as much as the next guy, but what’s really cool about the way the day closed is the effect on the RSI channel.

    I posted yesterday about the RSI channel that was setting up on SPX.  I added another post late last night (early this morning?) showing essentially the same pattern on all the other indices I watch.  It strongly suggests that the rise since 1357 is nothing more than a back test.  Here’s the view at yesterday’s close.

    This morning’s elevator ride sent RSI right through that dashed, red line — making the channel look about as valid as a $3 bill.  In fact, RSI spent most of the session ignoring my channel line. But thanks to the Bat pattern reversal, at the end of the day (literally) the channel held.

    And — wouldn’t you know it — SPX closed right at the shoulder line (white, dashed line) where it can torment us with uncertainty for another day.

    For a peek at the other indices and their channels, check out New Charts! posted last night.  Also, each index has its own page under the MARKETS menu, and will be updated at least weekly.  SPX, DX and VIX are typically updated intra-day on the main page, depending on market conditions.

    ************************

    While you’re poking around, consider signing up.   Current pebblewriter followers who join by midnight tomorrow are entitled to $100 off an annual membership.  Also, the first 100 annual members who sign up by tomorrow will have their membership rate grandfathered for the life of the site.  No increases, ever — which will be pretty cool when it costs $500 just to fill up your Suburban.

    Over the next day or two, this website will be password protected, so those of you who have already subscribed (thanks!) will enjoy first dibs on the latest and greatest.  If you haven’t subscribed yet, might as well do it now and save yourself $100.  If you bought a dozen at-the-money puts at 1415 today, you’re already up more than the cost of an annual membership.

    Good luck to all.

  • Spain Downgraded: April 26, 2012

    S&P cuts Spain two notches, from A to BBB+, based on contracting economy…cites declining disposable income, private sector deleveraging, front-loaded fiscal consolidation and an uncertain outlook for external demand in many of Spain’s key trading partners.

    This could be the catalyst for the turn we’ve been wondering about.  It could be the difference between the H&S and analog playing out versus our top alternative.  Notice that we did break the RSI trend line identified the other day (yellow, dashed) but were stopped by the 2nd one we discussed earlier today.  Today’s high was right at the shoulder line of the H&S pattern, and retraced a Fibonacci .707 of the recent 1422-1357 decline.

    Keep an eye on the CDS and bond rates for Spain/Portugal/Italy and key regional banks.  Remember, all these rates are available right here, just go to the economics menu and select market data.

  • On the Verge: April 26, 2012

    UPDATE:  5:35 PM

    S&P cuts Spain two notches, from A to BBB+, based on contracting economy…cites declining disposable income, private sector deleveraging, front-loaded fiscal consolidation and an uncertain outlook for external demand in many of Spain’s key trading partners.


    UPDATE:  3:25 PM

    Here’s a close up of the alternative path, which looks stronger with every uptick.  I haven’t altered its course since first charting it a couple of weeks ago.  Remember, it remains only an alternative until the H&S pattern busts.

    As we originally discussed, the thick, red dashed line is our target.  It’s the center line of a channel that goes back to 1935.  Really.  The rising wedge apex intersects with it at around 1462, which is the 1.618 extension of the purple Crab pattern detialed below (Point X at 1422.38).

    FWIW, it’s also the 3.000 extension of the small Crab pattern (yellow) nestled in the B-C-D legs of the larger Crab.

    UPDATE:  3:15 PM

    Interesting that today’s ramp has come without any help from the euro zone.  EURUSD continues to stall at the channel line discussed in this morning’s update on the euro.

    ORIGINAL POST:  1:45 PM

    Yesterday we examined the fact that SPX had broken a 26-session channel and was in danger of following our alternative forecast higher — the purple dashed line marked “alt.” in the chart below.  Remember, that alternative calls for a strong move to 1462-1472 in short order, while the analog calls for a breakdown first.

    We took a close look at the RSI trend line that, broken back on the 5th when the rising wedge was broken, was being back tested big time.  I mentioned I’d be watching it like a hawk, as I felt it would hold the key to which way this confusion resolves.

    As of right now, that RSI trend line is being broken.  While it’s possible this is an intra-day head fake, I’m not so sure that I’m willing to bet cold, hard cash.  Note the highlighted circle on the RSI portion of the chart below.

    And, expanded here…

    There is the possibility that the downward sloping red, dashed TL will catch it on the way up, but the yellow TL just broken was a major feat.  A close above the TL would imply a definite momentum shift.

    From a bearish perspective, one small Bat pattern that indicated more downside busted when we moved above 1392.  The larger Butterfly (labeled in red) will need its Point C moved over to today’s high, but won’t bust until/unless we exceed 1422 (where C > A.)

    From a bullish perspective, the Bat/Crab pattern marked below in purple correlates very well with the smaller yellow Crab — which, until this morning, was just a Bat.  Remember, Bats terminate at the .886 retracement, and Crabs at the 1.618 extension (or more).

    The small yellow Crab’s 1.618 is 1413.74, while the larger purple Bat’s .886 is 1414.97.  When two targets are in such close proximity, it lends additional credence — all else being equal.    Technically, we could get a move to 1414ish and still have a valid H&S pattern, but as we discussed yesterday, it puts additional strain on the pattern — and the analog — playing out, unless we see a very quick reversal.

    As we approach 1400, the market should at least pause.  It’s the original H&S “idealized” shoulder line, the 1.272 of the small Crab pattern, and a nice round number.  But, unless we reverse in the next hour and see that RSI dip back below the TL, I’m increasingly positive about a move to at least 1414-1415 to fulfill the Crab and Bat.

    Remember, this is still a back test of the rising wedge.  But, I’ve been studying rising wedges a lot lately; and, as we discussed many times [see: In a Fix], it’s not uncommon for a back test to go on up and tag the original apex — faking out all who were playing the broken wedge.

    More later.

  • VIX at a Crossroads: April 18, 2012

    Where there was once a falling wedge, there is now a channel.  The April 10 breakout that looked so promising completed a Bat pattern and promptly reversed nearly 61.8% of the move from the 13.66 bottom.  Is this the end of the ride, or are there bigger and better things in store for VIX?

    I have tentatively added another channel to the RSI to accommodate the latest spike.  It would likely guide the next leg down, if indeed that’s forthcoming — which I mostly doubt.

    Of course, every time we complete a Bat pattern with a Point D at the .886, we’re also establishing a potential Point B in a larger Crab pattern.  In this case, that would result in a completion Point D at the 1.618, which is 27.12.

    That’s an interesting price, because it equates with the 2.618 of the small Butterfly pattern potentially setting up on the hourly chart.

    Things get real interesting when you back out and look for competing or complimentary patterns.  On the 60-min chart, we can see that the move off the bottom conforms to a upward-sloping channel (in white) so far.  This channel will intersect with the downward sloping main channel (yellow) on Friday — which, of course, is OPEX.

    It’s only fitting that the point at which VIX must commit to one channel or the other arrives on OPEX.  The situation reflects the alternatives we’ve been discussing for SPX.  The analog we’ve been watching indicates a short-term top is at hand, and we should see a brief but scary sell-off in the next few days.  This would correlate with sideways action in VIX, followed by a breakout of the yellow channel to follow the white one — probably topping out at the 27.13 level at the bottom of SPX’s decline to around 1305-1317.

    The alternate SPX view is that we go on up and tag the rising wedge’s apex without the sell-off first.  There’s certainly enough important news in the pipeline over the next few days to bring either course to fruition.  Such a movement in stocks would mean the white channel breaks down and the yellow one holds — knocking VIX back to the 14.5 — 15.8 range.

    Of course, such a move would complete most of an inverse H&S pattern (in yellow) and set up the next upside break out.  Technically, we have enough of a right shoulder as it is, but a drop to around 16 would be ideal.

    In summary, my leading assumption is sideways until OPEX, then a breakout up to the 23-24 range to complete the IH&S that correlates with the SPX’s H&S move down.  We should then see a back test of the yellow neckline and subsequent push to the 27-30ish range to correlate with SPX’s move to 1307-1317.

    It would be a break of the yellow channel (which has a grand total of two anchor points on its upper bound) that would be similar to the Mar 16, 2011 breakout to 31.28 (see below.) But, such a move would bring it back the midline of the long-term channel that’s been such a magnet for breakouts over the past few years.

    That midline, by the way, is in the same neighborhood as the Inverse Head & Shoulders target of 28.20, which would be very doable if SPX were to plunge 70-80 points over the next week.

    But, keep the alternatives in mind.  The market is exceedingly hinky lately; and, as much as I like the analog, it’s certainly not guaranteed to play out.  As always, please use stops.

    Good luck to all.

  • Bottom Fishing

    EOD:  2:25 AM

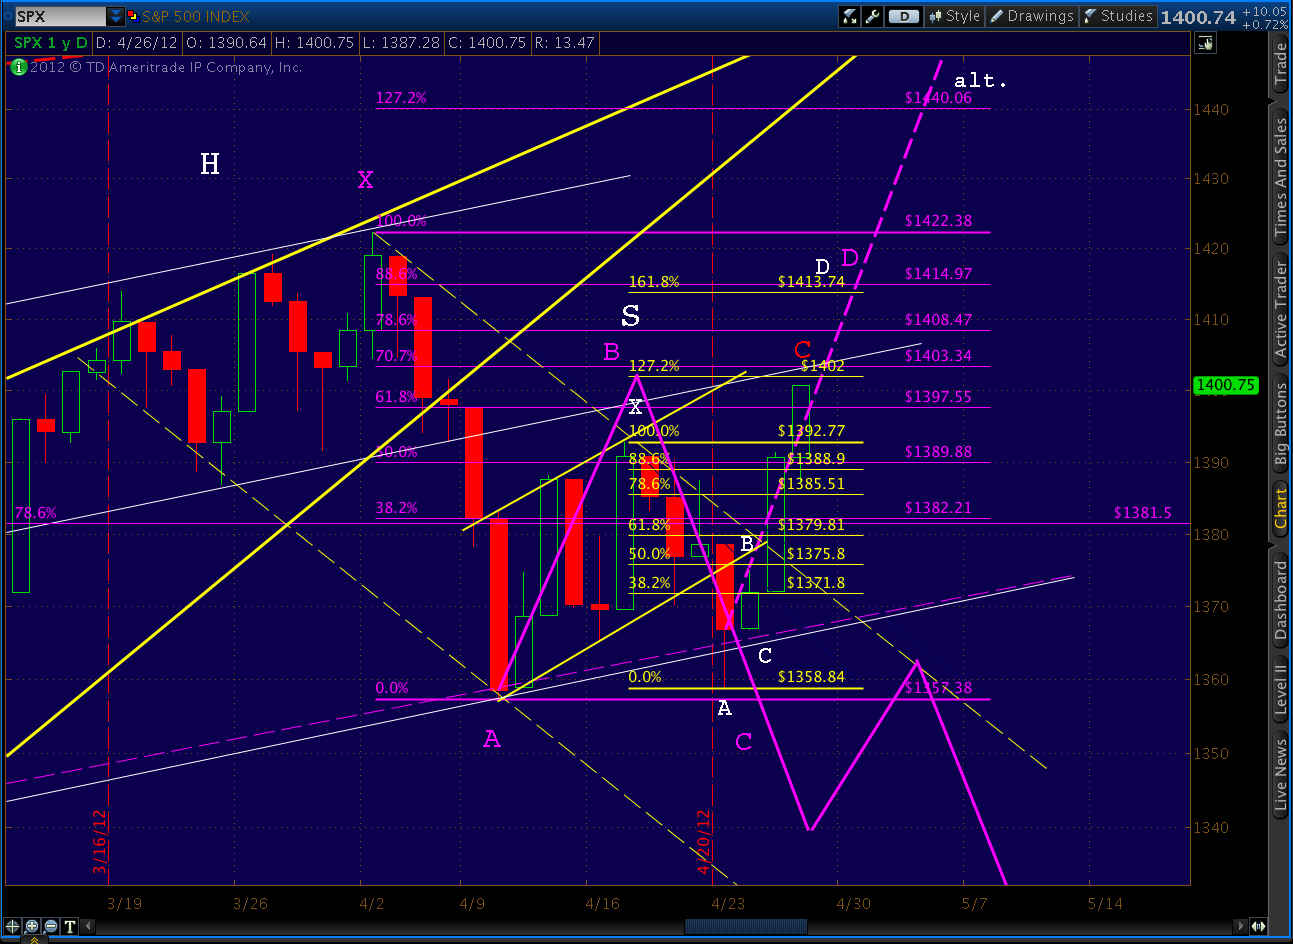
    SPX overshot the Crab’s 1.618, whichever Point X we use.   The next major lines of harmonic support are are the red pattern’s 2.24 at 1342, correlating with the purple pattern’s 2.618 at 1341.

    Given the level of oversold on the day, here’s an alternative view.

    UPDATE:  11:55 AM

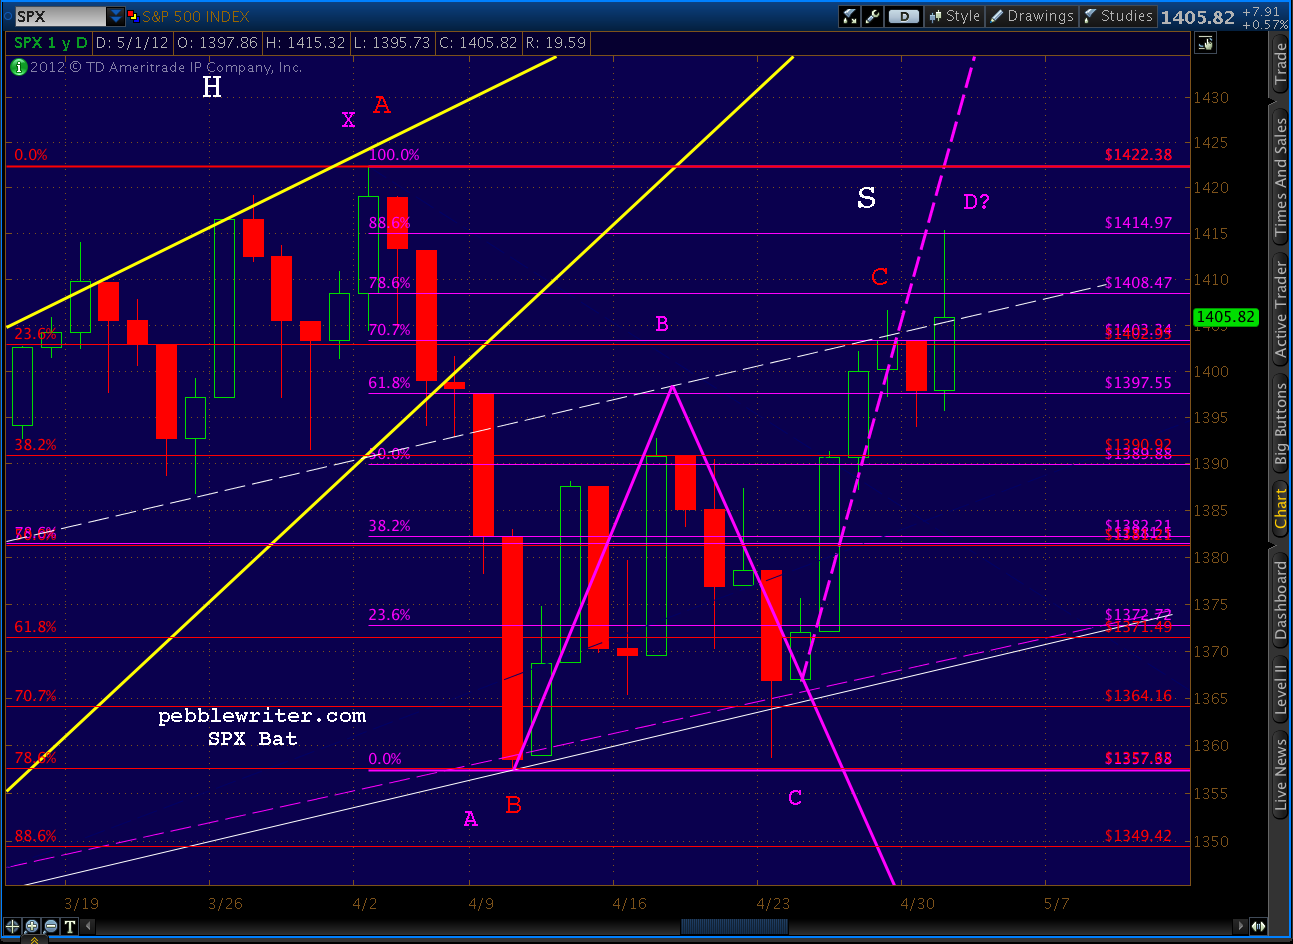
    The Crab Pattern I posted about earlier pulled a fast one on us.  It either busted, or I drew it wrong.

    Technically, it’s forbidden for Point C to exceed Point A — kind of like Wave 1/Wave 4 overlaps in Elliottworld.   But, it happens.   I’ve redrawn the Crab to begin with the March 23 1386 low instead of the March 29 1391 low — which means that the 1.618 extension is 1364.92 instead of 1372.51.

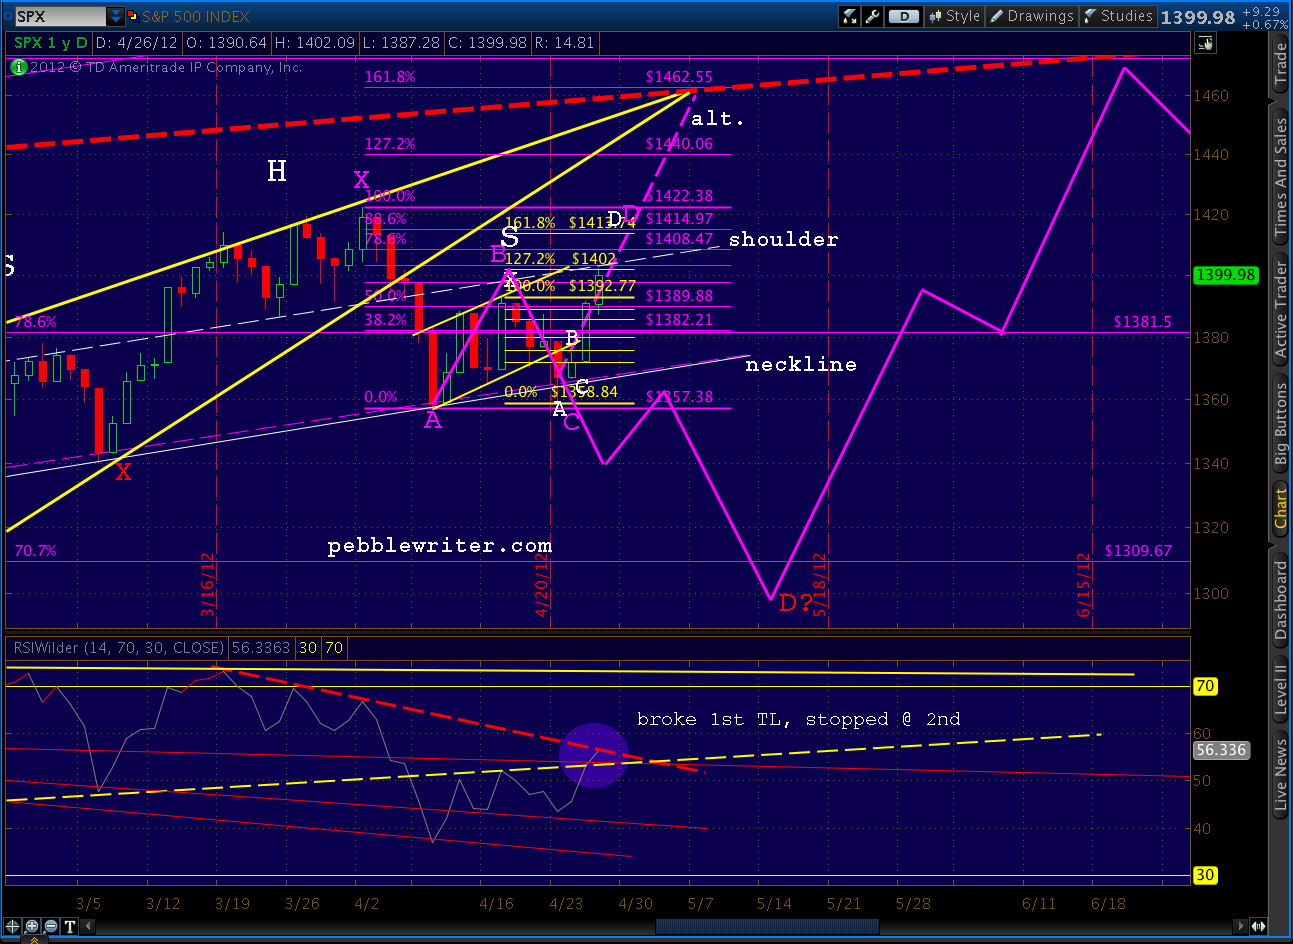
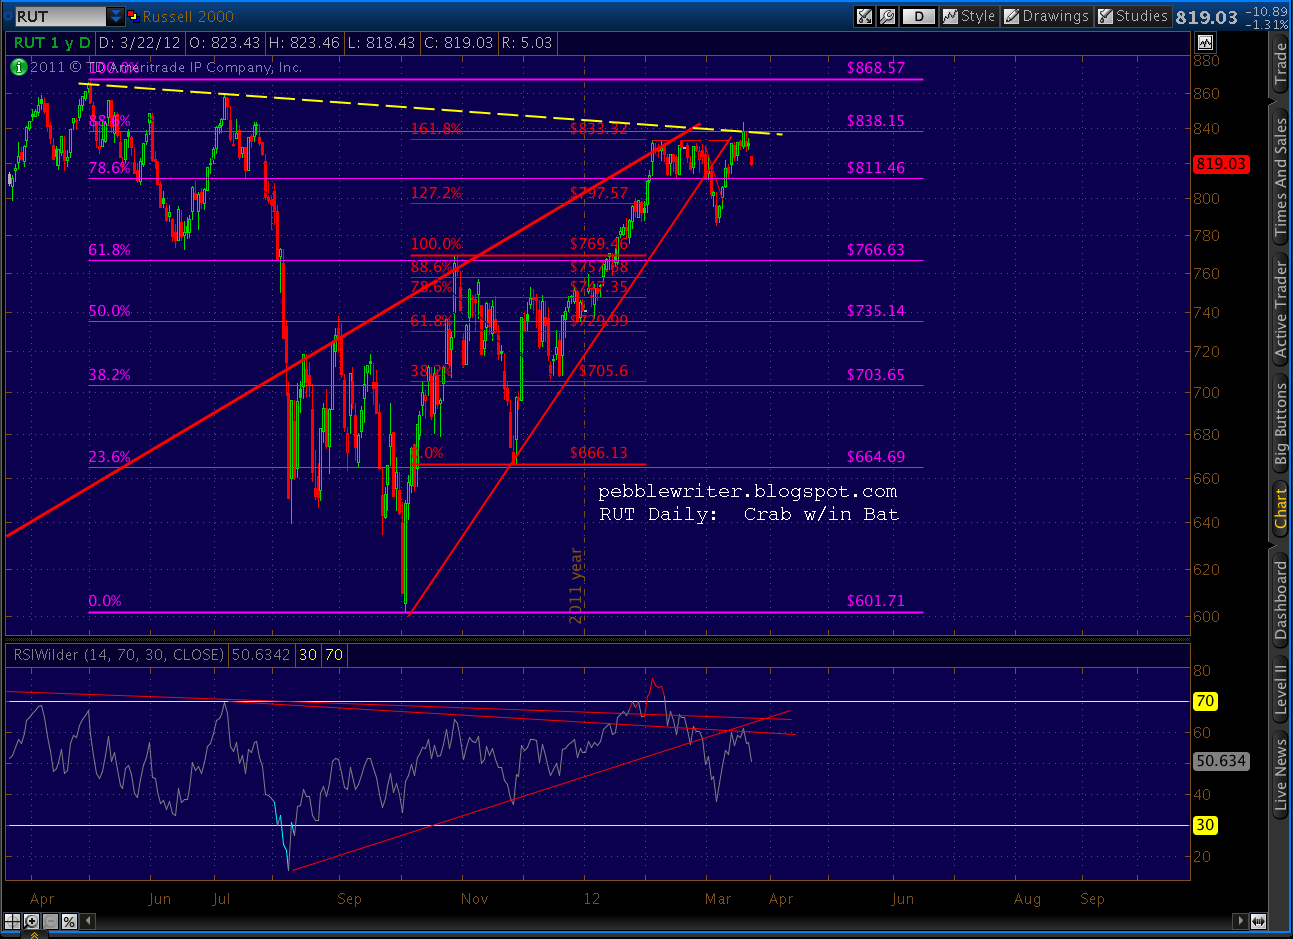
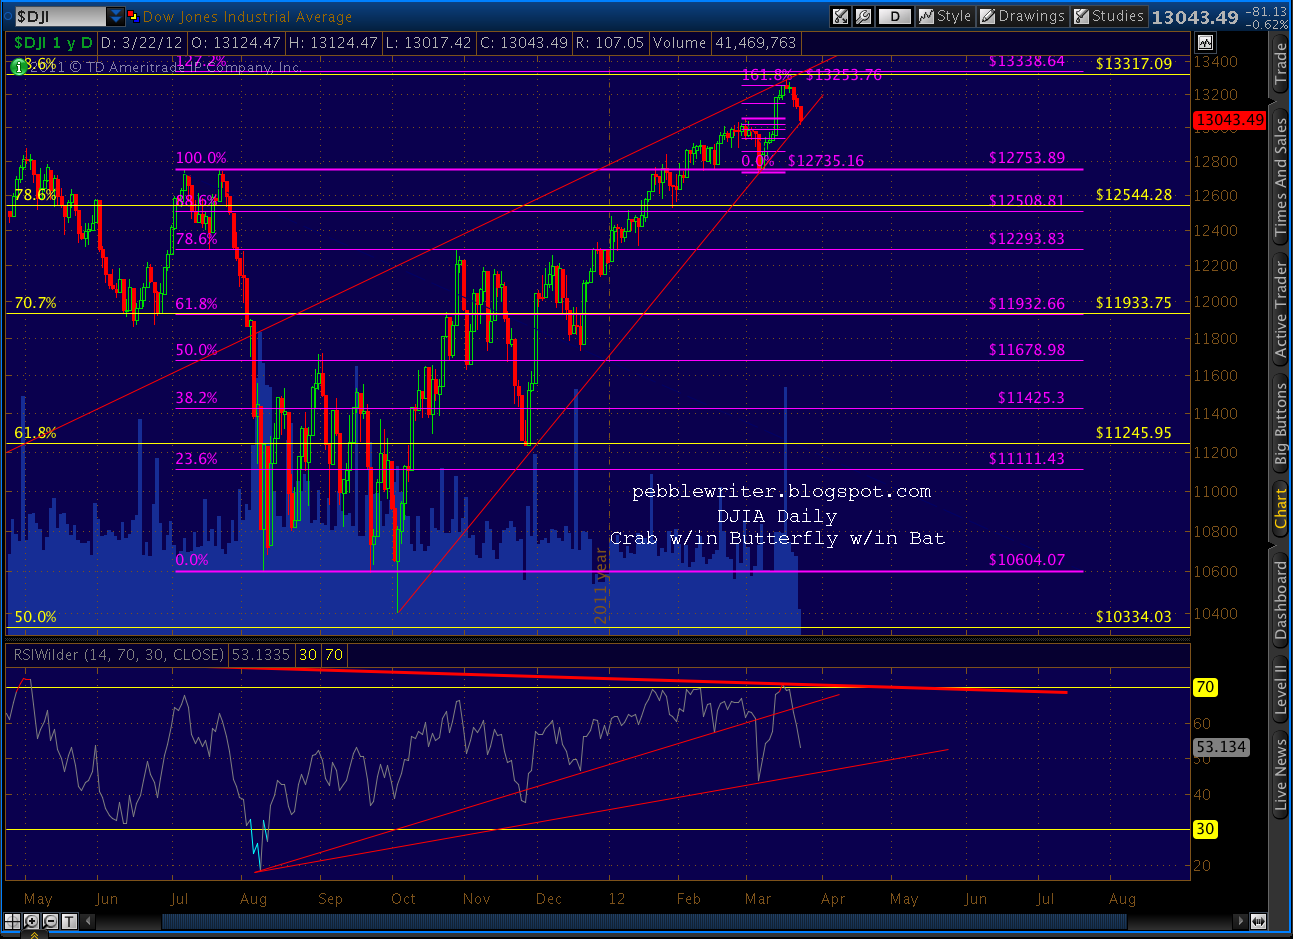
    Note the daily RSI tag on the same trend line (red, dashed) that stopped the Oct 4 and Nov 25 declines. The previous tags are highlighted in light blue.   This decline is picking up momentum, so the RSI TL and the Crab pattern might get mowed down.

    But, be cautious.   Like any trading system, once you start bending the rules in Harmonics, it opens up a can of worms.  Markets frequently overshoot logical targets, and it’s no cause to discard the methodology.

    I’m taking some profits off the table at these levels, and will let the rest ride essentially risk free.  Note that 1364 is the .707 of the 1340-1422 move.  If it doesn’t hold, the next support is at the .786, which would equal 1357.  An intra-day push to 1357 and close at 1364 would be interesting.


    ORIGINAL POST

    After yesterday’s close below the rising wedge, we can safely consider it officially broken.  Now, the question is whether SPX will freefall in an epic fail of the bull market, or find support at some interim level for another leg up.

    In the near term, we’re approaching a potential Crab Pattern turning point at 1372.51.  We might have reached it yesterday but for the little acceleration channel SPX has been in since 1422.  Today, the channel passes right through 1372, so we could get a good test.

    This isn’t a big pattern, so we might not see earth-shattering results, but it should be good for at least a nice bounce if not an outright reversal.

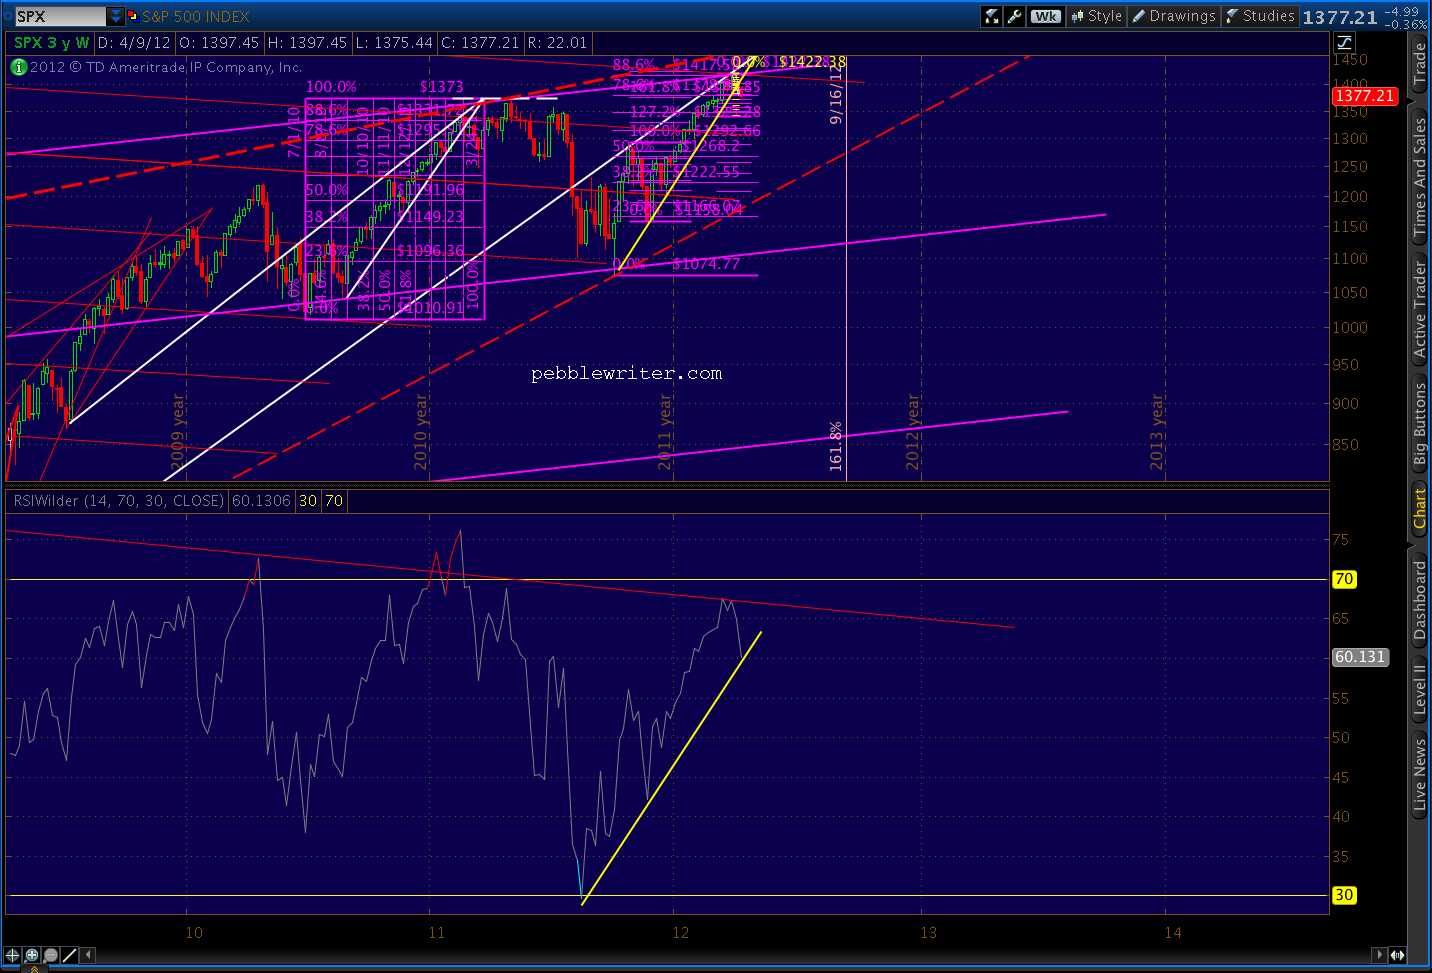
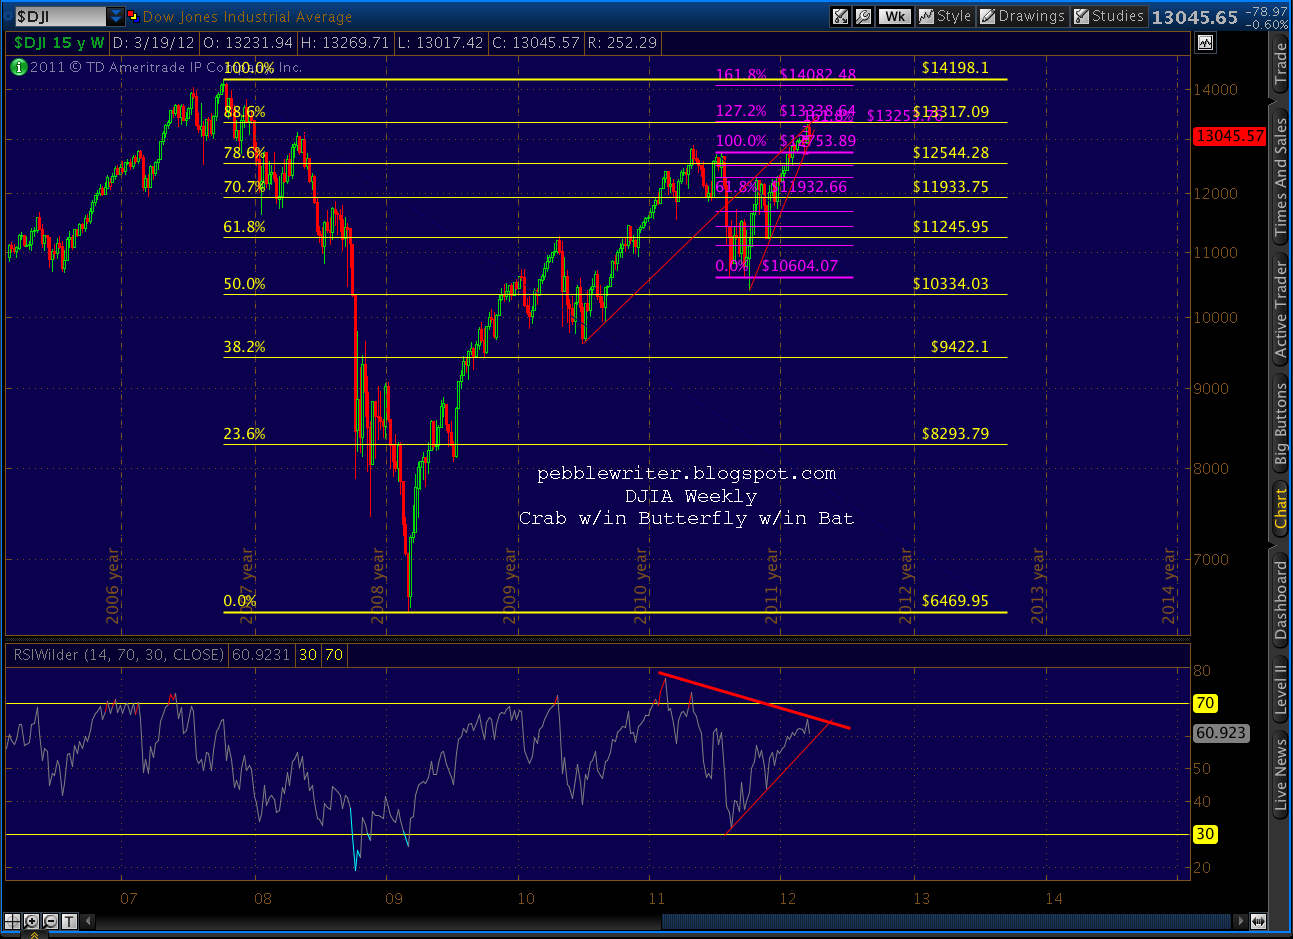
    I think an outright reversal might be in the cards, though.  The hourly RSI shows positive divergence with this morning’s leg down, and daily RSI shows a tag of an important internal trend line.  But, it’s the weekly RSI chart that, as a bear, really gives me pause.

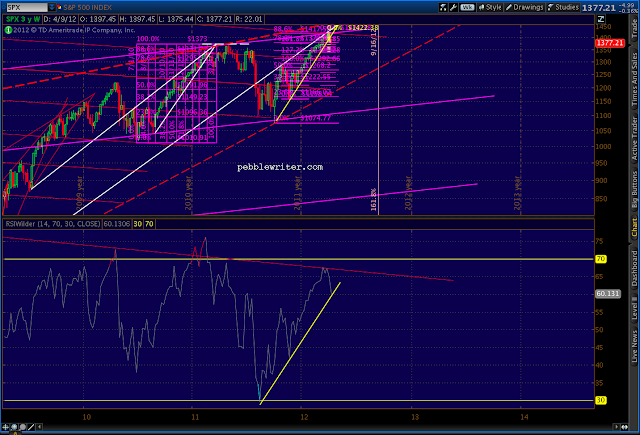
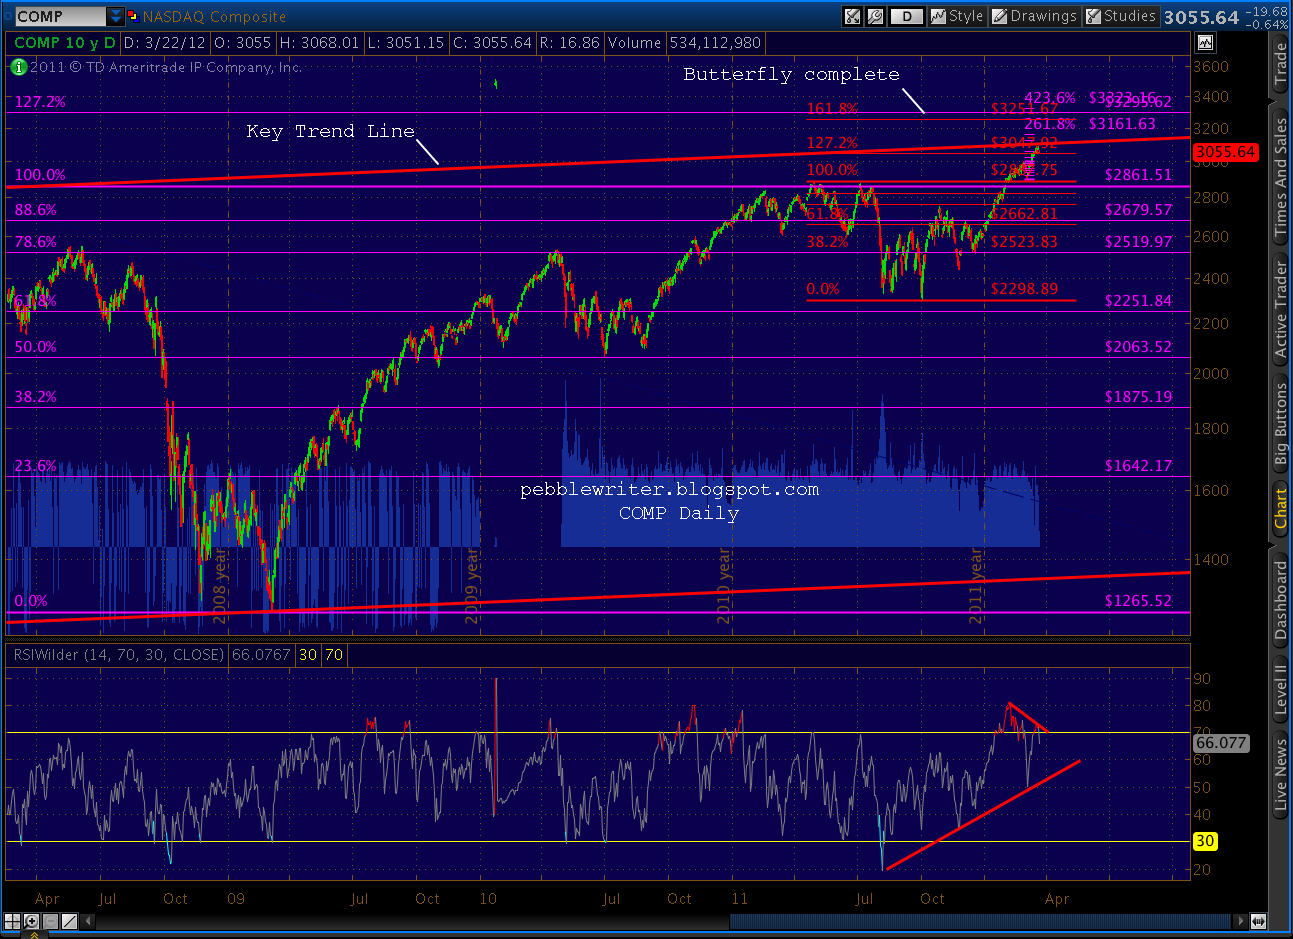
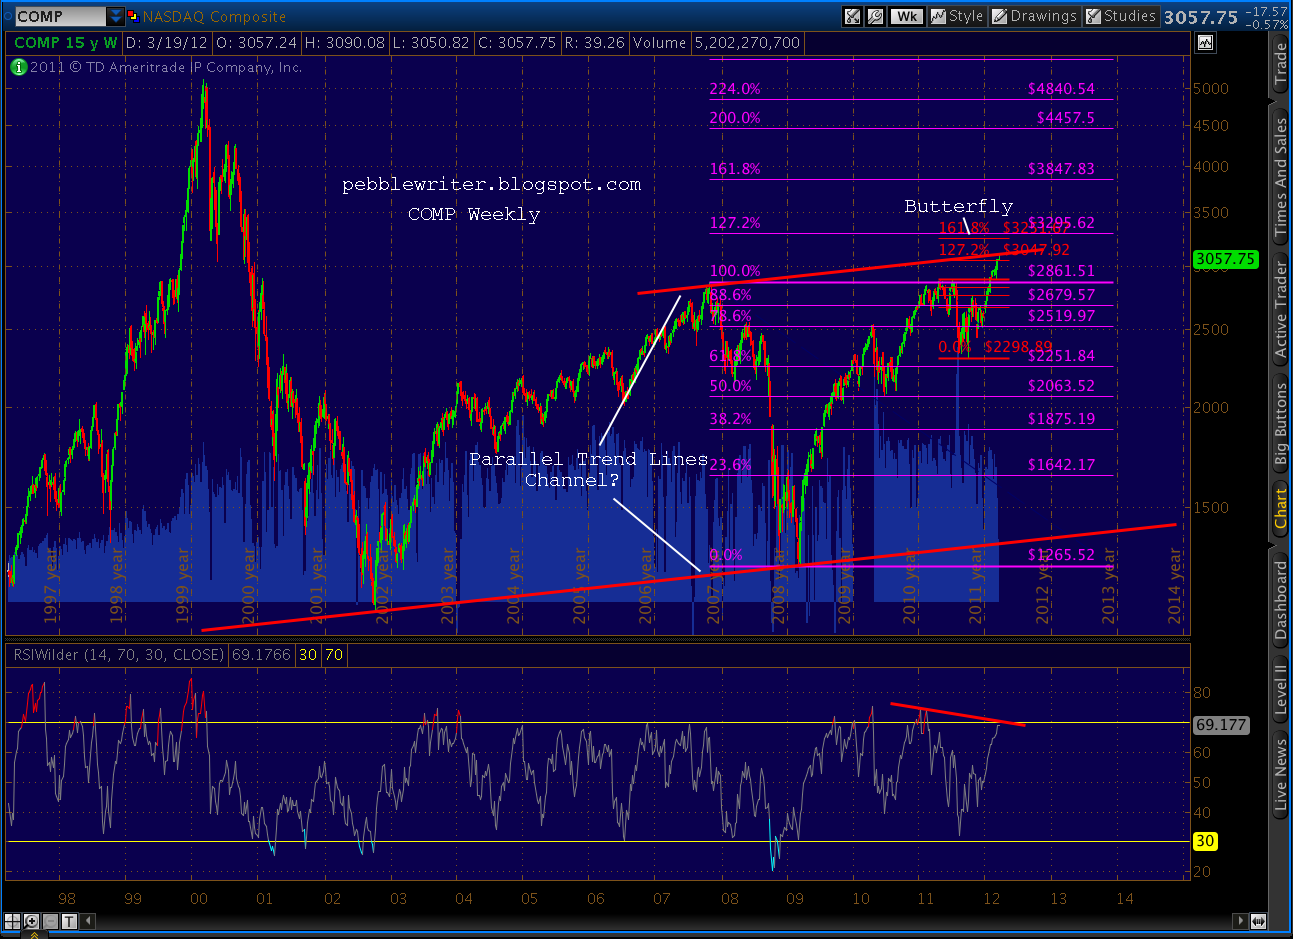
    Expanding the RSI chart gives us a clear view of a trend line that might provide significant lift at these price levels (ignore the compressed upper chart.)

    I’ve also been watching VIX’s price action, constructing some probable channels months ago: the yellow channel guiding the downside, transitioning to the red channels for the subsequent rise.  Since then, I’ve barely adjusted them.

    Note how well they’ve called the turns.  At this point, they hint at a likely breather for VIX.  All things considered, I think we’re likely to see a backtest of the VIX falling wedge that will correspond with a return to the other side of the red channel.  It could happen any time, but might well occur coincident with the afore-mentioned bounce in SPX.

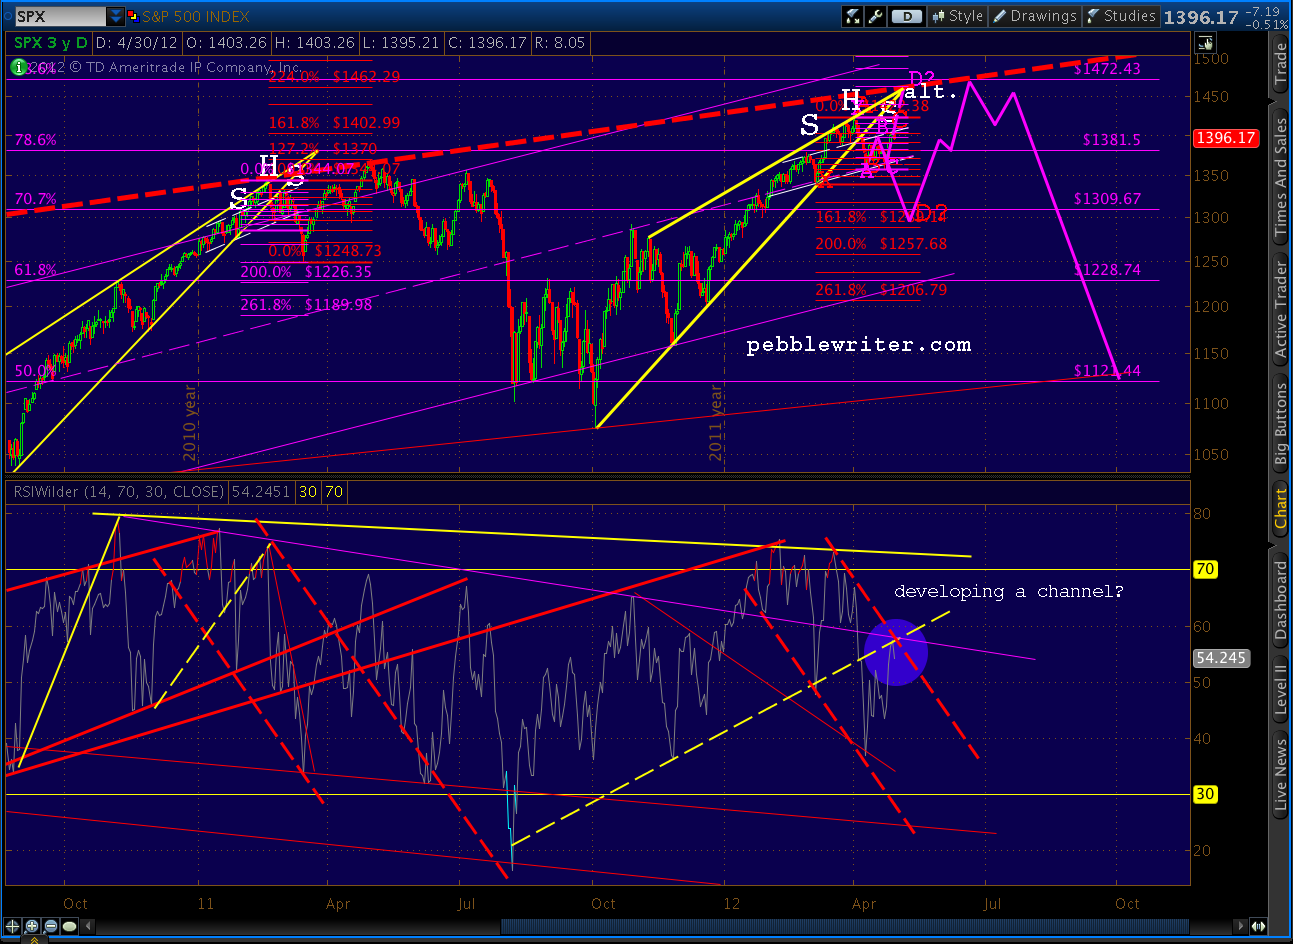
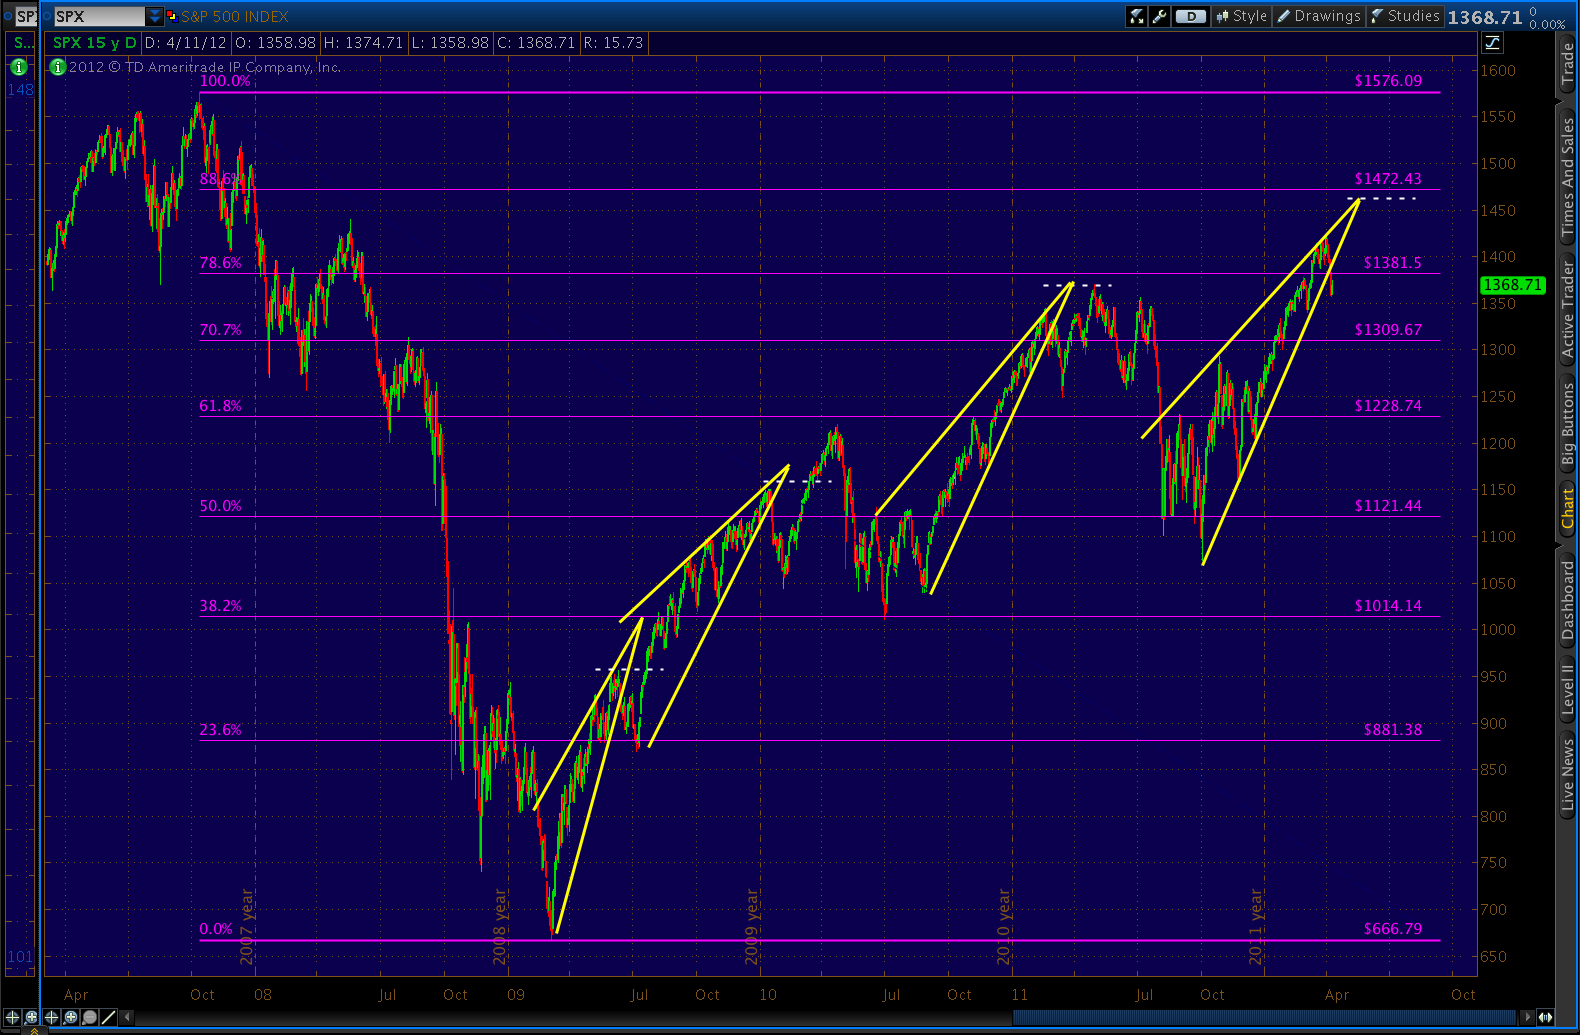
    All this begs the question, what kind of bounce will we see?  As we discussed the other day, this rising wedge is a reasonable facsimile of the 2010-2011 one [see: Analog Watch.]

    The most likely drawing of the current wedge puts the apex around 1460-1470 somewhere around May 7-11, meaning we reached only 88.6% of the potential in both time and price at the recent 1422 high.  [see: Was That It?] If we repeat the pattern, we’ll head back up to tag that apex — exactly as we did in May 2011 at 1370 (note the dashed white line that connects the March 2011 apex to the May 2011 top.)

    More importantly, however, we’d tag the upper bound of the huge rising wedge (red dashed) that dwarfs the rising wedge (yellow, solid) that just broke down.

    I’ve drawn its upper bound as the biggest, boldest red line I can muster on the above chart.  Why?


    Stay tuned.

  • Charts I’m Watching: March 22, 2012

    ORIGINAL POST: We’re finally seeing reactions on the harmonic pattern completions we’ve been watching for what seems like forever [see: Everything’s Coming Up Crabs.]RUT completed a Crab Pattern (in red) within the last leg of a Bat Pattern (purple) off the 2011 highs.  It never has cleared the TL off the May and July highs.  The May 2011 high was a double-top to 2007’s.

    COMP completed a tiny Crab within a little Butterfly pattern and tagged a key trend line off the 2007 highs.

    I call it a trend line because it’s exactly parallel to the line connecting the 2002 and 2009 lows.  A reversal here would make for four touches — i.e. a channel.  But, COMP could continue bucking its bearish divergence and go up to complete the larger Butterfly pattern (purple) at 3250-3295.

    DJIA still hasn’t made a new high since completing a Crab Pattern a stone’s throw away from a Butterfly Pattern (purple) completion at 13,338.64.  We’re still watching for a clean break of the rising wedge in the price chart and the trend line in the RSI chart.


    Though, it’s important to note that, at these prices, we came within 28 points of completing a Bat pattern (yellow) at the .886 (13,317) in the weekly chart.  That would make for a logical back test if/when the rising wedge finally breaks.  It might also be the 5th and final wave target if today’s move stays within the wedge itself — which is just as likely.

    Coming up….SPX.