Financials have had a great run ever since we called the June 4, 2012 bottom [see: So Crazy, It Just Might Work]. But, all good things must come to an end. I’d give them another few days/points at most.
I had jumped on the short side Mar 27, 2012 [see: End of the Line and Lots More], riding GS, MS and JPM down around 30%.
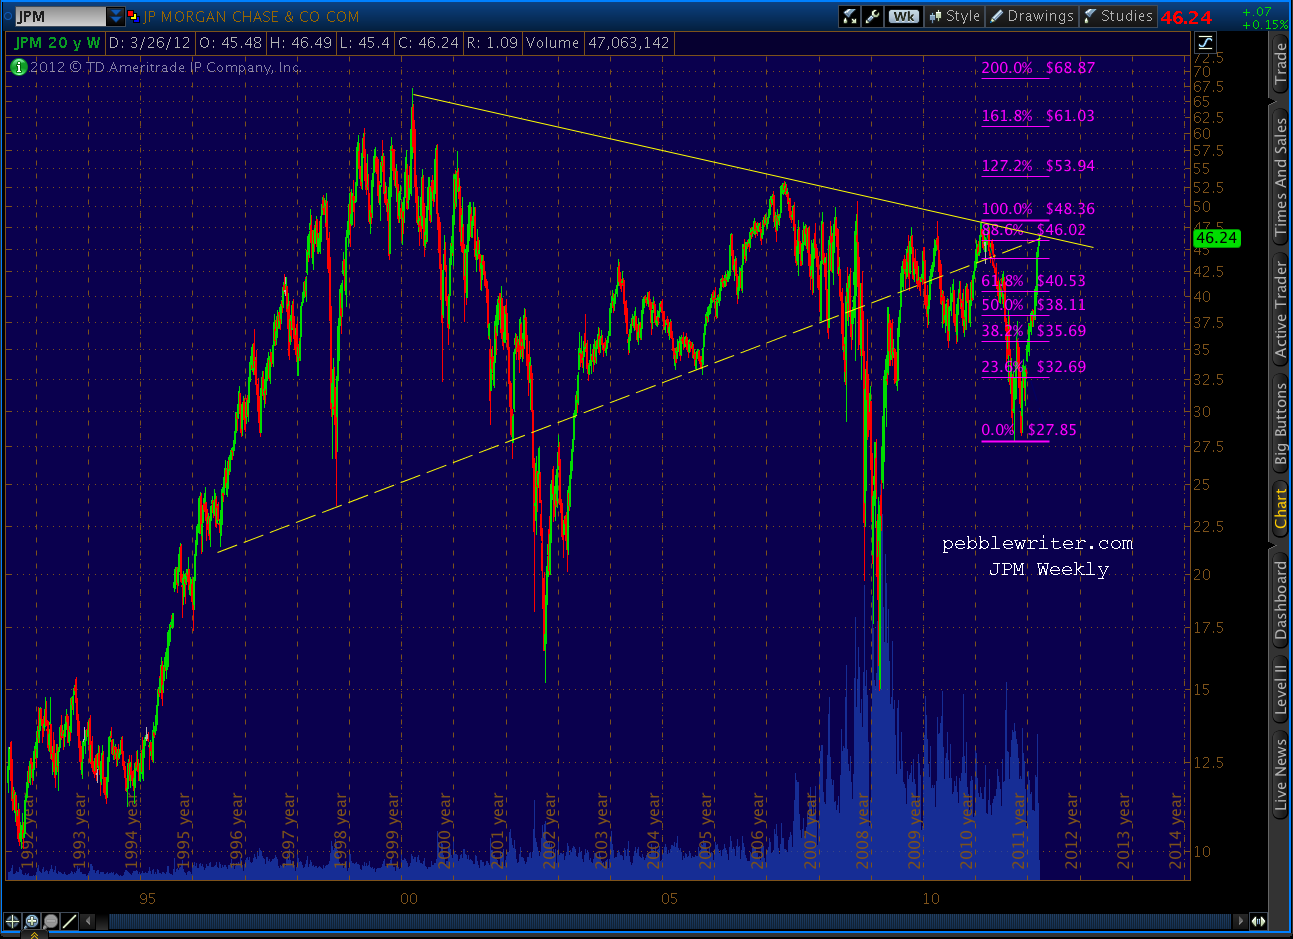
JPM: 46 – 32 = 31%
GS: 127 – 92 = 28%
MS: 20 – 12.50 = 38%
On June 5, we loaded up on the long side. Our targets, as posted that day:
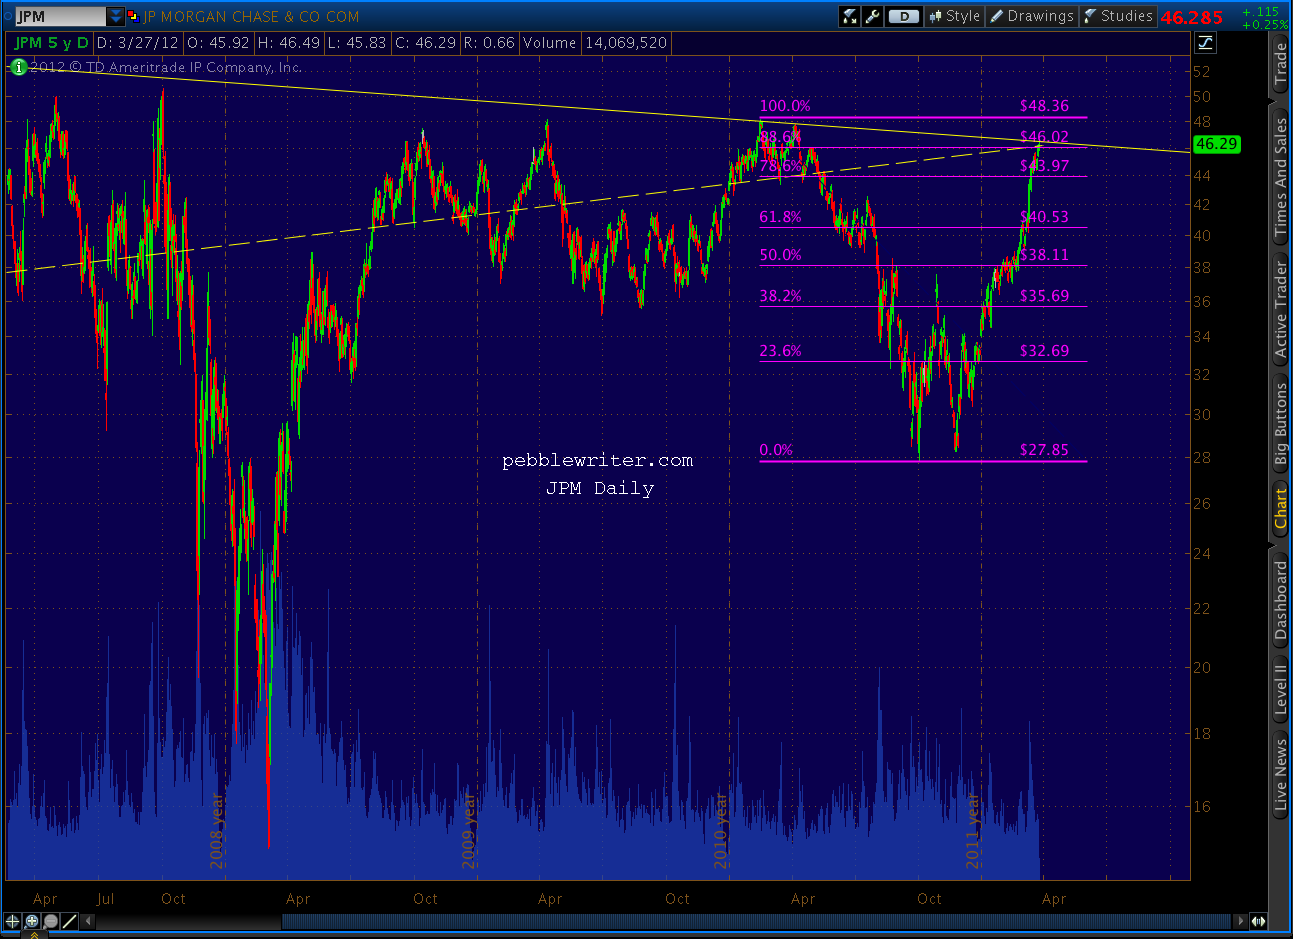
JPM: today’s close = 31.99, price target = 38.69 (+21%)
C: today’s close = 25.75; price target = 34.79 (+35%)
BAC: today’s close = 7.10; price target = 11.34 (+60%)
Obviously, those targets proved to be a little conservative. JPM reached its target by Aug 21, consolidated for 2 weeks, then zoomed even higher – reaching 49.31 today and finally (after 4 near misses) reaching the .886 retracement of its 53 to 14 plunge.


C reached its 34.79 target on QE3 day (Sep 14 — lovely being able to dump all those crappy MBS on the Fed) backed off a few points, then proceeded to rally up to today’s high of 44.50.
 It only ever recovered 7.95% of its 2007-2009 plunge from 570 to 9.70 (adjusted for reverse splits) and is struggling to reach the .786 of its swan dive from Jan to Oct 2011: 51.50 to 21.4. If the .786 at 45.06 doesn’t do the trick, the .886 at 48.07 should.
 And, just today BAC came within a nickel of the 50% retracement (12.39) of its post-2009 high. It reached our 11.34 target in mid-December.
 If it gets past 12.67, it could still take a run at 14.13. But, it won’t be easy.
 Most of the financials are in a similar situation — at or near major resistance either from Harmonic or Chart Pattern targets. But, it’s XLF itself that looks shakiest.
Today, XLF reached an important channel line as it tagged the 1.618 of the Mar-June 2012 decline.
 If it sneaks up past current levels, the .382 retracement of the fall from 38.15 in 2007 is waiting at 18.21.