Tag: DJIA

  • The Same, but Different

    Yesterday started out with a VIX-driven pop that quickly fizzled and nailed our downside target before rebounding and hitting our upside target.  Since SPX closed right at resistance, it needed a boost overnight.  So, why not go back to the same clever trick that worked the day before?

    Yes, VIX’s red channel has broken down again.  And, the algos are eating it up… to the tune of +5 on ES.

    Will it pop and drop, again, or will this one take?

    continued for members(more…)

  • Reproach and Retreat

    The first big Republican victory — the repeal and replace of the ACA — has morphed into reproach and retreat.  The net impact: what does this failure portend for the rest of the Trump agenda and, thus, the Trump Rally?

    Regular readers know that I’ve looked askance at this rally from the start [see: Why the “Trump Rally” is a Fraud.]  It was born of a sharp reversal in CL, USDJPY and VIX — the key algo drivers.  Momentum traders jumped on board as it rose.  And, somewhere along the way, mainstream investors convinced themselves that the new and improved outlook justified an 18% rally.

    But, live by the algo, die by the algo.  The yen had to appreciate to compensate for higher oil prices.  Higher US and euroland inflation necessitated a drop in oil and gas.  And, front-running the Fed’s tepid response to spiking inflation was widespread.  With the Trump Rally narrative in doubt, there were simply too many plates to keep spinning.

    Futures are off 22.50 at the moment, leaving us some clues as to what to expect for SPX.  But, the more important side of the equation is where do WTI and the USDJPY dip to?

    continued for members(more…)

  • Update on DJI: Jun 19, 2013

    Since breaking above the 2007 high, the Dow’s been on a tear — eager to leave 2007-2009 in the past.

    In so doing, it sliced right through the white 1.618 extension of the 2011 correction and the 1.618 and 2.24 extensions of the drops from Apr 2012 and Sept 2012.

    What’s next?

    continued for members(more…)

  • The Dow: Time to Double Down?

    Many are watching the Dow Transports’ recent all-time highs, wondering if Dow Theory suggests new highs for the DJIA as well.

    Without wading into the debate over which interpretation of the theory holds water and which are all wet, I think it’s important to recognize that the DJIA is one of those indices not making new all-time highs lately.

    Should the Industrials not break above 14,198.10, this would be considered a Dow Theory non-confirmation, at least on a larger scale.  The last time this happened was in July of 2011, when the Transports made a new high of 5627.85 and the DJIA failed to best its May 2 12,876 high.

    We can argue about cause and effect, but there’s no argument about what happened next.

    Eighteen months later, the DJT has again broken out to new all-time highs.  DJIA has not.  Here’s the current visual, which shows the current degree of divergence is much larger than back then.

    The Industrials, in fact, are a great candidate for a double-top.

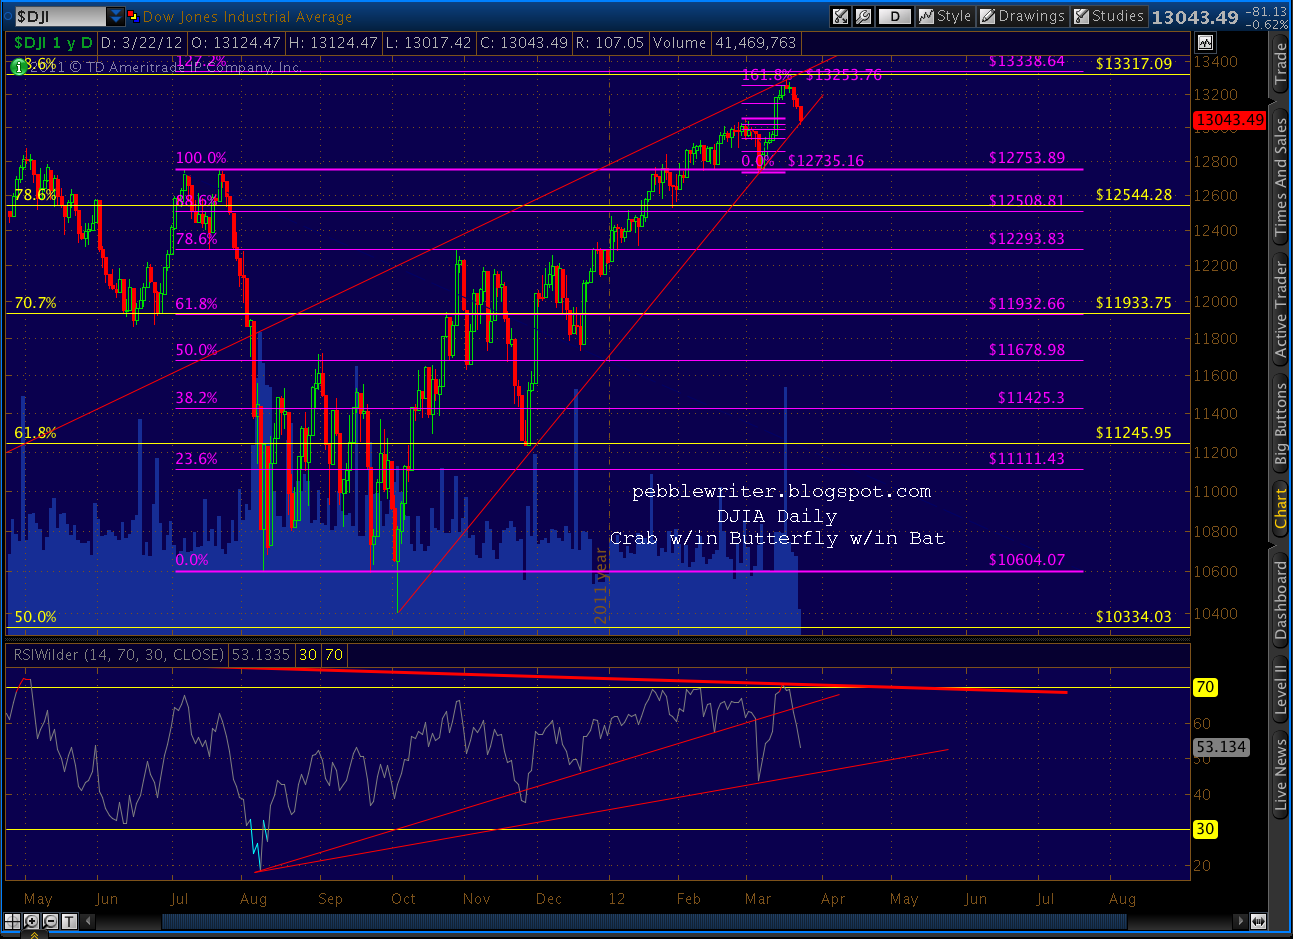
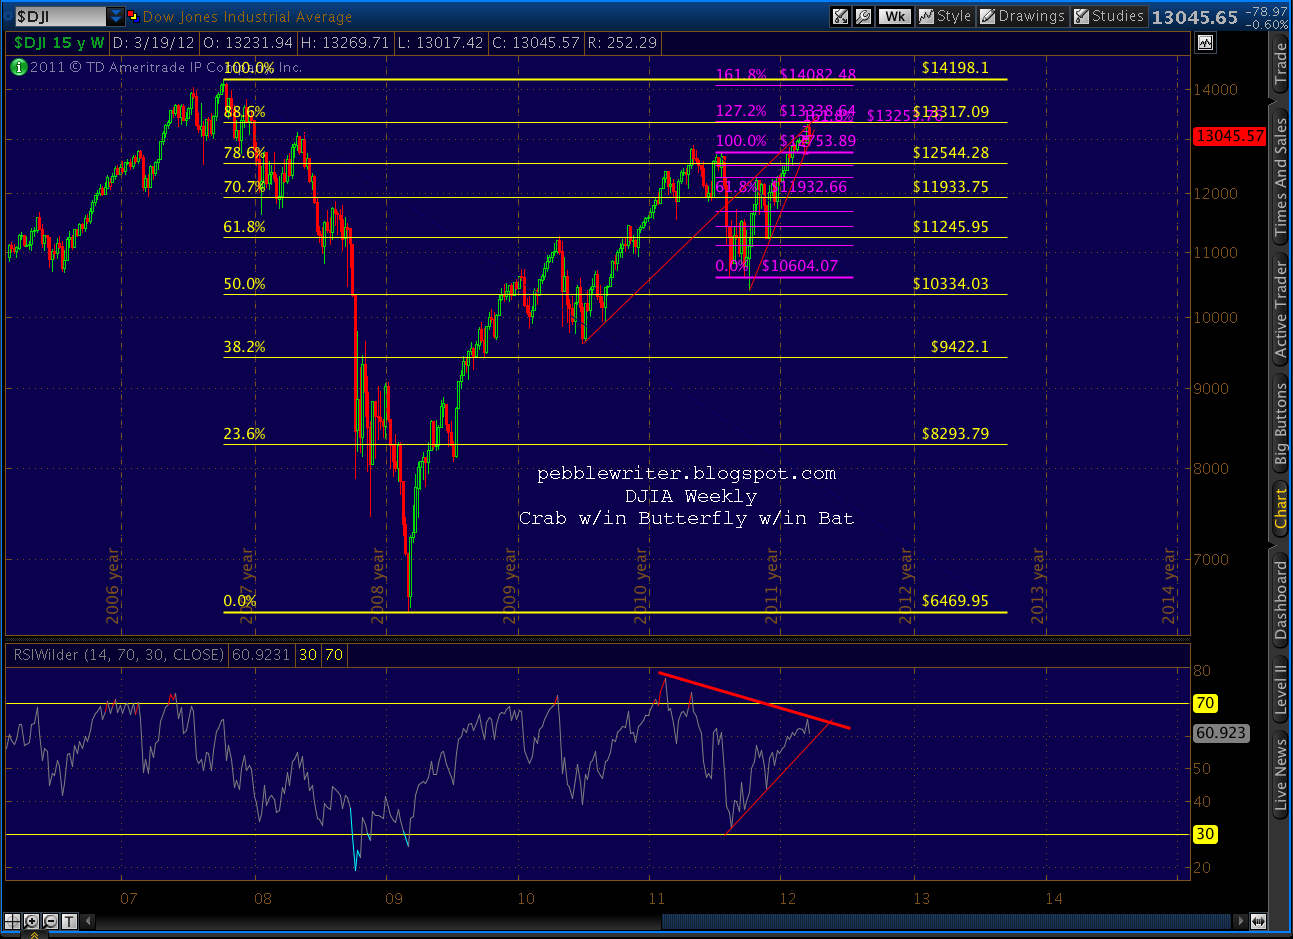
    Drilling down, we can see DJIA has nearly completed a Crab Pattern at the Fibonacci 161.8% extension (14,201.84) of the July-October 2011 crash (the white pattern.)

    It intersects nearly perfectly with the previous 2007 high of 14,198.10 at the very point where the purple channel top and white 25% channel line also intersect.  But, it need not even reach that level to be considered a double top (within 1%.)

    And, only a few points away we find a Butterfly Pattern target (small red pattern) at 13,985.65 and a Crab Pattern target (in white) of 13,963.50.

    The last leg up in the move since October 2011 has been 1424 points — roughly 87% of the leg 3 rally between June and September of 2012.  A Fibonacci 88.6% of the leg 3 rally would register at 13,912 — well within the margin of error for any of the harmonic patterns mentioned above, and only 16 points above today’s high.

    And, for those who, like me, love to channel stuff, the DJIA’s daily RSI has its own bearish tale to tell.

    Could DJIA blow through 14,200 confirm the Transports’ all-time high and spoil the bears’ party?  Of course.  There are still plenty of earnings reports to sift through, including AMZN, CAT, FB, YHOO, IP, PFE and F in the next few days.  We could get great Durable Goods numbers Monday, Case-Shiller Home Price Index on Tuesday, or a bullish FOMC outcome on Wednesday.

    But, anyone counting on new all-time highs should remember July 2011 and consider protecting their downside.

  • Update on Everything: Jan 11, 2013


    Around the horn with major indices and currencies…  Like SPX, most are at a threshold where they must either break down or break out (I think “break down,” but we’ll know soon enough.)

    Coming up: VIX, RUT, COMP, NYA, NDX, DJIA, FTSE, SPX, DX, EURUSD, USDJPY, AUDUSD, CL, GC, SI.  And, yes, I’m happy to take requests — first come, first served after the above are done.

    *  *  *  *  *  *  *  *

    VIX

    continued for members(more…)

  • Zweig Breadth Thrust

    Came close Friday, but didn’t happen.  A ZBT requires a move from .40 to .60 in 10 sessions or less.  Here’s a successful signal from Sep 2011:

    And, here’s where we ended up Friday — the 10th session from the .40 cross:

    Ditto for NYSE & DJIA too, BTW.

  • New Charts!

    Lots of updates posted here tonight:  SPX, DJI, VIX, COMP, NYA, NDX, DX and EURUSD.   Summary charts here, or check the index tabs under the MARKET tab in the MENU.  I’ll have the rest of the indices and the metals posted later today.

    Each of these will typically be updated at least weekly, while I usually rely on SPX, VIX and DX to tell the day-to-day and intra-day story.

    In general, I’m seeing an almost identical pattern setting up in each of these RSI charts — and it’s bearish.  Unless this is a masterful fakeout, the next move should be down — possibly the result of PMI manufacturing or construction spending data due out at 10:00AM EST.

    Good luck to all.

  • The Dow’s Analog: April 16, 2012

    The Dow is setting up with the same chart patterns and harmonics as SPX, leading me to believe it’s also on the path to completing an analog of its Feb-May 2011 top.  The big difference is that DJI already came very close to and reacted off its .886 Fib.

    However, this doesn’t trouble me too much.  In 2011, the Gartley pattern played out with a 20-pt near miss on the .786 (after a .618 Point B) on Feb 18.  The reaction was pretty significant, with a 834-point swoon over the next 17 sessions.  Yet, DJI swept back up to meet and exceed the .786 by 332 points before topping out in May.

    Now, as it’s making a bid for higher highs, it has the same three options as SPX.  Remember, it’s all about getting to the .886 Bat pattern completion (13,217) and then the price level of the rising wedge’s apex — about 13,730.

    If the analog holds, we should top out tomorrow somewhere between 13,125 and 13,240 followed by completion of the H&S pattern and a swift decline to 12,320-12,420, then a subsequent rise to a new high in the 13,730 to 13,840 range.

    But, if this current rise gets a head of steam on it, we could just go on up and tag the apex and long term midline (red, dashed) around May 7 at 13,737-ish.  There’s a Crab pattern that completes at 13,659 that is already in the works (red Fib pattern.)

    The third option will be the trickiest: DJI reverses, nearly completes the H&S pattern, but can’t seal the deal.  It follows the same path of least resistance up to 13,737 around May 7.

    The analog and the 2nd alternative are shown on the chart below.

    As it now stands, DJI has retraced about .707 of its recent decline.  It can go as high as the .886 at 13,230 and still form a decent H&S pattern.  Any higher and it starts looking really wonky.  A rise above 13,284 means we’re likely pursuing the alternate instead of the analog.

    For now, I’m expecting the analog to hold.  The RSI chart, particular, shows a distinct possibility of a turn in the very near future (note the red, dashed line.)

    Good luck to all.

  • Charts I’m Watching: March 22, 2012

    ORIGINAL POST: We’re finally seeing reactions on the harmonic pattern completions we’ve been watching for what seems like forever [see: Everything’s Coming Up Crabs.]RUT completed a Crab Pattern (in red) within the last leg of a Bat Pattern (purple) off the 2011 highs.  It never has cleared the TL off the May and July highs.  The May 2011 high was a double-top to 2007’s.

    COMP completed a tiny Crab within a little Butterfly pattern and tagged a key trend line off the 2007 highs.

    I call it a trend line because it’s exactly parallel to the line connecting the 2002 and 2009 lows.  A reversal here would make for four touches — i.e. a channel.  But, COMP could continue bucking its bearish divergence and go up to complete the larger Butterfly pattern (purple) at 3250-3295.

    DJIA still hasn’t made a new high since completing a Crab Pattern a stone’s throw away from a Butterfly Pattern (purple) completion at 13,338.64.  We’re still watching for a clean break of the rising wedge in the price chart and the trend line in the RSI chart.


    Though, it’s important to note that, at these prices, we came within 28 points of completing a Bat pattern (yellow) at the .886 (13,317) in the weekly chart.  That would make for a logical back test if/when the rising wedge finally breaks.  It might also be the 5th and final wave target if today’s move stays within the wedge itself — which is just as likely.

    Coming up….SPX.