Tag: derivatives

  • The Same, but Different

    Yesterday started out with a VIX-driven pop that quickly fizzled and nailed our downside target before rebounding and hitting our upside target.  Since SPX closed right at resistance, it needed a boost overnight.  So, why not go back to the same clever trick that worked the day before?

    Yes, VIX’s red channel has broken down again.  And, the algos are eating it up… to the tune of +5 on ES.

    Will it pop and drop, again, or will this one take?

    continued for members(more…)

  • A New Analog: EURUSD

    As noted back on Feb 21, the EURUSD has broken down from its rising channel (white) and accelerated to the downside, breaking the Jan 4 1.2996 low and the psychologically important 1.30 level.

    The intersection of the purple .618 and two white channels at 1.38 will have to wait (till my next visit across the Pond, no doubt.)

    Losing the rising white channel hurts momentum quite a bit, but it’s the drop back through the 75% line on the falling white channel that represents the bigger problem for the pair.

    This channel dates all the way back to Dec 06. Reaching the top for the third time is still possible, of course, but it’s that much harder now that the pair needs to retake the higher channel line and mount a fresh attack.  Suppose it doesn’t?

    I’ve redrawn the falling white channel as red and will lower its top (for now) to reflect that possibility.  I’ve also sketched in a more relaxed rising channel (light blue) that reflects potential channel support at current prices (the intersection of the falling red .75 and the rising light blue .25.)

    I don’t know whether the pair needs to retest the falling white midline or not.  The bottom of the new light blue channel intersects with the red .75 in mid-March.  Also there is the .25 of the very large rising purple channel, which provided a huge bounce in Jun 2010.  It’s easier to see in the LT chart below.

    Here’s the really big picture.

    Several months ago, I noticed that the entire chart looks a bit like an expanded replay of the little dip way over to the left.  Playing with channels, I got some interesting results.

    The huge rising white channel seems to matter quite a bit. Note the support it offered from Aug 93 – Jan 97.  When it broke, the pair fell precipitously to the midline, shedding .15 in about six months.

    The midline offered support again through Feb 99, then completely fell out of bed (equities maxed out in Mar and Aug 2000.)

    EURUSD spent 18 months in the penalty box confirming the channel bottom until finally breaking out early in 2002.  It nearly reached the midline again two years later, and spent almost 4 additional years grinding higher – reaching 1.60 at a little over the 1.618  before zigzagging lower to its present level.

    We’ll circle back to these charts Tuesday and take a look at the analog’s implications for the US dollar and equities.

    To be continued…


  • Down the Rabbit Hole: Part 2

    Alice laughed: “There’s no use trying,” she said; “one can’t believe impossible things.”   “I daresay you haven’t had much practice,” said the Queen. “When I was younger, I always did it for half an hour a day. Why, sometimes I’ve believed as many as six impossible things before breakfast.”
                                        ― Lewis Carroll, Alice’s Adventures in Wonderland


    The market never ceases to amaze me.  Despite all the ingredients being in place for a sizable correction, it’s sailing along as though everything were copacetic.

    Negative divergence abounds.  The correlated currencies are all selling off.  Gold is down.  Silver is down.  Even AAPL is down. Numerous indices have completed bearish Harmonic or Chart Patterns.

    The Fed let slip yesterday that the adrenaline drip will soon be removed — leaving banks without a buyer for their underwater mortgages and the stock market without any downside protection.  They’ve finally admitted what we’ve all known for some time: QE’s effect is diminishing, and the risk is growing.

    The budget showdown is still ahead (the part of the fiscal cliff that really matters.)   The most fractured Congress in modern history, which utterly failed to resolve the important issues, will now turn the task over to an arguably more partisan Congress.

    The country’s AAA credit rating is hanging by a thread at both Moody’s and Fitch.  A downgrade by either would require massive selling by institutions which require at least two AAA ratings in order to comply with their investment policies (especially insurance companies.)

    Unemployment has reportedly declined, but only because we no longer count the dejected job seekers who are leaving the work force in droves.  Include them, and the actual picture is startlingly bleak. (source: Shadowstats.com)

    The EU is officially back in a recession (though it never really left.)  Its banks are being kept afloat by the ECB/ESM, which is exchanging (somehow AAA) paper backed by shaky sovereigns for junk sovereign debt as fast as it can.  Meanwhile, unemployment continues to soar.


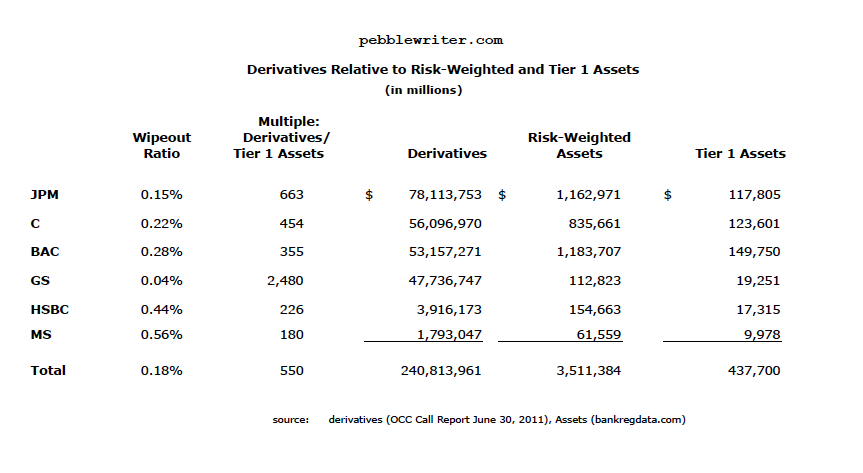
    The big 2013 headline that isn’t (yet) is the global derivatives debacle:  $700 trillion — over 10 times the global economy — of unregulated, unpriced, unreported private contracts which have been sliced and diced so many times that no one has the slightest notion what the risk really is — except that it dwarfs the capital of the banks that hold it.

    In my opinion, the only things keeping the economy and the market afloat are the unrelenting screech of MSM fairy-tale “good news” and the Bernanke Put (the Fed’s money printing and plunge protection operations.)

    As long as these two factors can outweigh the negative fundamental picture, the market stands a good chance of rising.  Take one of them away, and the resulting crash will be swift and severe.

    That said, I’ve spent the past two days assessing the current state of our analog and forecast.  I’ve quantified it as best I can in an attempt to eliminate my admittedly negative bias.  I’ll lay it out over the next several hours, a few charts at a time.

    If you’d rather skip to the punchline, I’m still bearish.  In the absence of a push through 1474, I think we’re in for a sizable correction and remain short from 1462.  If 1474 is broken, everything changes.

    For members who enjoy getting their fingers dirty, stay tuned.

    *  *  *  *  *  *  *  *

    About an hour ago, we completed a Bat Pattern which is nestled inside of a Bat Pattern which is nestled inside of a Bat Pattern.


    UPDATE:  3:15 PM

    RSI channels show how much is riding on this moment.  A push through the top of the purple channel brings the red channel mid-line into play.  Could it correlate with 1474, or maybe just the next channel line on the intra-day?

    I’m not sure.  The intra-day 1.272 is 1468.17 and the 1.618 is 1471.61.  A double-top would be a real nut-buster.

    All I know is there’s still negative divergence across the board, so I don’t expect the red mid-line to be broken.

    My apologies for the delay in getting the forecast charts up.  They’ll have to wait until after the close.  I’ve been distracted by the melt-up, checking and re-checking my charts to see what I might be missing.

    continued for members(more…)

  • Running on Empty

    UPDATE:  EOD

    SPX went straight to our 1338 target and hung around pretty much all day — closing right on the H&S neckline.

    The analog I first posted on Mar 9 is still very much on track.  It called for the low 1300s by May 16 — which looks doable if we have another day or two like today.  Keep in mind, though, that while I had to pick a particular price target in order to chart the analog, I consider the downside to consist of a range from 1295-1323.

    UPDATE:  10:00

    We got the H&S completion we discussed earlier, seen below on the daily chart.  As expected we also got a bounce at the neckline.


    ORIGINAL POST:  9:20 AM

    With this morning’s continuing fallout from the latest JPM debacle, we should see the completion of the smaller H&S pattern we’ve been watching.  The neckline is around 1338, so look for a bounce there on the opening.

    As we discussed last Thursday [see: Still on Track], the latest H&S pattern targets 1275, but I believe it’ll be a challenge getting below 1292.  Remember, the overall targets I originally laid out on May 6 [see: So Far, So Good]:

    • 1349.42 — .886 of the purple Butterfly  [tagged May 8]
    • 1343.41 — 1.272 of the yellow Crab pattern [tagged May 9]
    • 1340.03 — horizontal support, prev. Point X [should tag this morning]
    • 1323.85 — 1.618 of yellow Crab
    • 1317.63 — 1.272 of purple Butterfly
    • 1289.14 — 1.618 of purple Butterfly (and 2.24 of Crab)

    Completion of the neckline mentioned above around 1338-1340 should also find horizontal support from the previous Point X (Mar 6) in the Butterfly pattern we’ve been watching since March [see: All the Pretty Butterflies.]

    But, my base case remains 1295-1317 for now.  It’s hard to calculate the damage that could be done by JPM’s screw-up.  As discussed last week [see: There is Nothing Wrong] JPM can easily withstand a $2-5 billion trading loss.  The danger is that much more damage lies beneath the surface — not difficult to imagine given the enormity of their $78 trillion derivatives portfolio.

    As I said back on April Fool’s Day [see: The Wipeout Ratio]:

    I fear this is the story of the year, folks.  And, it’s just now starting to get some press.  As we learned with AIG, if one segment of the financial markets suffers huge unanticipated losses, the entire house of cards can come crashing down.

    Such is the nature of today’s leveraged, re-hypothecated securities markets.  And, 99% of this stuff isn’t even quoted or openly traded, so who knows what skeletons are out there?  My gut tells me there’s plenty more where this came from.

    ***************

    And, for you Jackson Brown fans…

  • There is Nothing Wrong…

    I can picture it clearly:  It’s 1963 and 10-year old Benny Bernanke sits staring at the black & white Zenith in the living room of his East Jefferson Street house, captivated by the voice of Vic Perrin…

    “There is nothing wrong with your television set.  Do not attempt to adjust the picture.  We are controlling transmission.  We will control the horizontal.  We will control the vertical.  We can change the focus to a soft blur, or sharpen it to crystal clarity.  For the next hour, sit quietly and we will control all that you see and hear. You are about to participate in a great adventure.  You are about to experience the awe and mystery which reaches from the inner mind to the outer limits.”

    click on the image for a trip down memory lane

    These were the formative years for the future leader of the financial world.  The idea that anyone could completely alter someone else’s reality must have captivated him then, as it clearly does now.

    How else to explain the market’s rise after one of the world’s biggest banks admitted to [tip: think icebergs] a $2 billion trading loss on what they insisted was a matched book?

    Now, $2 billion isn’t going to ruin JP Morgan Chase.  They have $1.2 trillion in assets and $112 billion in Tier 1 capital.  The ruinous aspect of this news is that they, as some of the smartest guys in the room, have lost control of their derivatives trading.

    As every aspiring muppet-master knows, JPM has the largest derivatives portfolio of any US bank — an astounding $78 trillion as of June 2011.  This represents a startling 663 times their Tier 1 capital, meaning a miniscule 0.15% move in the value of their derivatives portfolio would wipe out all Tier 1 capital [see: The Wipeout Ratio.]

    Needless to say, the Plunge Protection Team has been mobilized.  In yesterday’s conference call, Jamie Dimon as much as admits that the worst is yet to come:

    “Net income in Corporate likely will be more volatile in future periods than it has been in the past.”

    It’s as clear as the worry lines on Blythe Masters’ face that they have no idea how ugly this might get [read: much, much worse.]  And, if this guy — the Prince of Wall Street — has such tenuous control on the goings-on in his Chief Investment Office, what are we to think about the rest of his $78 trillion in derivatives?  How about the other $630 trillion held by other bankers? [see: City of Dreams]

    click on the above to watch

    In one of Bernanke’s first televised post-fed meeting interviews, Dimon joined in the Q&A, bashing Bernanke for the litany of regulations and reforms that were preventing the financial community from recovering from the financial crisis.  Needless to say, there was no mention made of his role leadership in creating the crisis.

    This is analogous to bailing your kid out of jail, only to have him complain about how long the drive home is taking.  I was impressed by Bernanke’s restraint as he provided a thoughtful response, while no doubt thinking: “I saved your sorry ass, and this is how you repay me!?”

    There’s an old adage in banking: if I owe you $100 and can’t repay it, I’m in trouble.  If I owe you $1 million and can’t repay it, you’re in trouble.  While the TARP loans have long since been repaid, Wall Street’s survival is still very much in the hands of its enablers — the Fed.

    As the guy ostensibly at the controls, Bernanke must feel more than a little perturbed that things aren’t going according to plan.  I wonder if Vic Perrin’s words ran through his mind yesterday as listened to the JPM call.  I wonder, as he called Dimon to lay down the law (“no, really, I mean it this time — no more bailouts!”) whether he heard those familiar words from the other end of the line…

    “There is nothing wrong with Wall Street.  Do not attempt to adjust the picture.  We are controlling transmission….”

  • City of Dreams

    I’ve been harping on the incredible threat represented by the $250 trillion in almost entirely off-the-books, unregulated derivatives market — 95% of which is should be but isn’t on the books of the top five US banks [see: The Wipeout Ratio.]

    It’s an astonishing 550 times the tier 1 capital on the books of these same banks — all of which are considered too big to fail.  Looking at it another way, a two-tenths of 1% decline in the value of those derivatives could completely wipe out all tier 1 capital altogether.  If that weren’t bad enough, it’s dwarfed by the global derivatives market of $707 trillion.

    It’s hard to appreciate just how much money we’re talking about.  But, demonocracy.com does an outstanding job of putting it into perspective, focusing on the 9 largest banks’ $228.72 trillion in exposure.

    Take the time to read this, and please pass it along. Click anywhere on the nice pretty picture below.

  • The Wipeout Ratio

    A simple calculation comparing major banks’ derivatives positions to their assets and capital shows how little it would take to wipe out either.  The first ratio is the multiple that derivatives represent of Tier 1 capital.  The second shows the miniscule percentage decline in the value of derivatives portfolio it would take to completely wipe out Tier 1 capital.


    Goldman Sachs, for instance, has $47 trillion in derivatives exposure — 2,480 times its Tier 1 capital.  A 0.04% decline in the value of the derivatives portfolio would wipe out Tier 1 capital altogether.

    Overall, a 0.18% decline would do the entire bunch in.    Something to think about, especially as the vast majority of derivatives are OTC, are not priced in public markets, and are obscured/netted out in balance sheets.  Remember, “too big to fail” really means “subject to taxpayer bailout.”

    A little over a week ago in a Zerohedge article we learned that Italy’s previously hidden derivatives exposure amounted to 11% of the country’s GDP.    A recent $3.4 billion payment to Morgan Stanley to settle a 1994 contract wiped out half the value of the tax hikes recently imposed on an already crumbling economy.

    If this doesn’t seem terribly important, consider that the derivatives exposure of the five banks above alone, at $240 trillion, is four times the combined GDP of every country on earth.  JPM, by itself, has notional derivatives exposure that exceeds the combined global GDP.

    I fear this is the story of the year, folks.  And, it’s just now starting to get some press.  As we learned with AIG, if one segment of the financial markets suffers unanticipated losses, the entire house of cards can come crashing down.  Banks know how bad the situation is; how else to explain the lack of interbank lending — particularly in the euro zone?

    Stay tuned.