

Futures were already off 20+ points even before the big miss in PPI: -0.3% vs +0.1% expected. This is the worst print since Sep 2015. The YoY picture continues to look bleak, with PPI and Core continuing to roll over.
 It’s an excellent metaphor for the overall market — which makes me wonder when the next Kudlow soundbite will hit the wires. Could Trump stifle himself as SPX reaches 2900, 2840 or 2820? Remember, last Thursday [see: Did Kelly Evans Just Take the Red Pill?], it happened when SPX reached a 1% loss.
continued for members…Our downside targets remain unchanged. Keep an eye on ES 2912 — the bottom of the channel which temporarily broke down last week.

 Oil and gas are also rolling over.
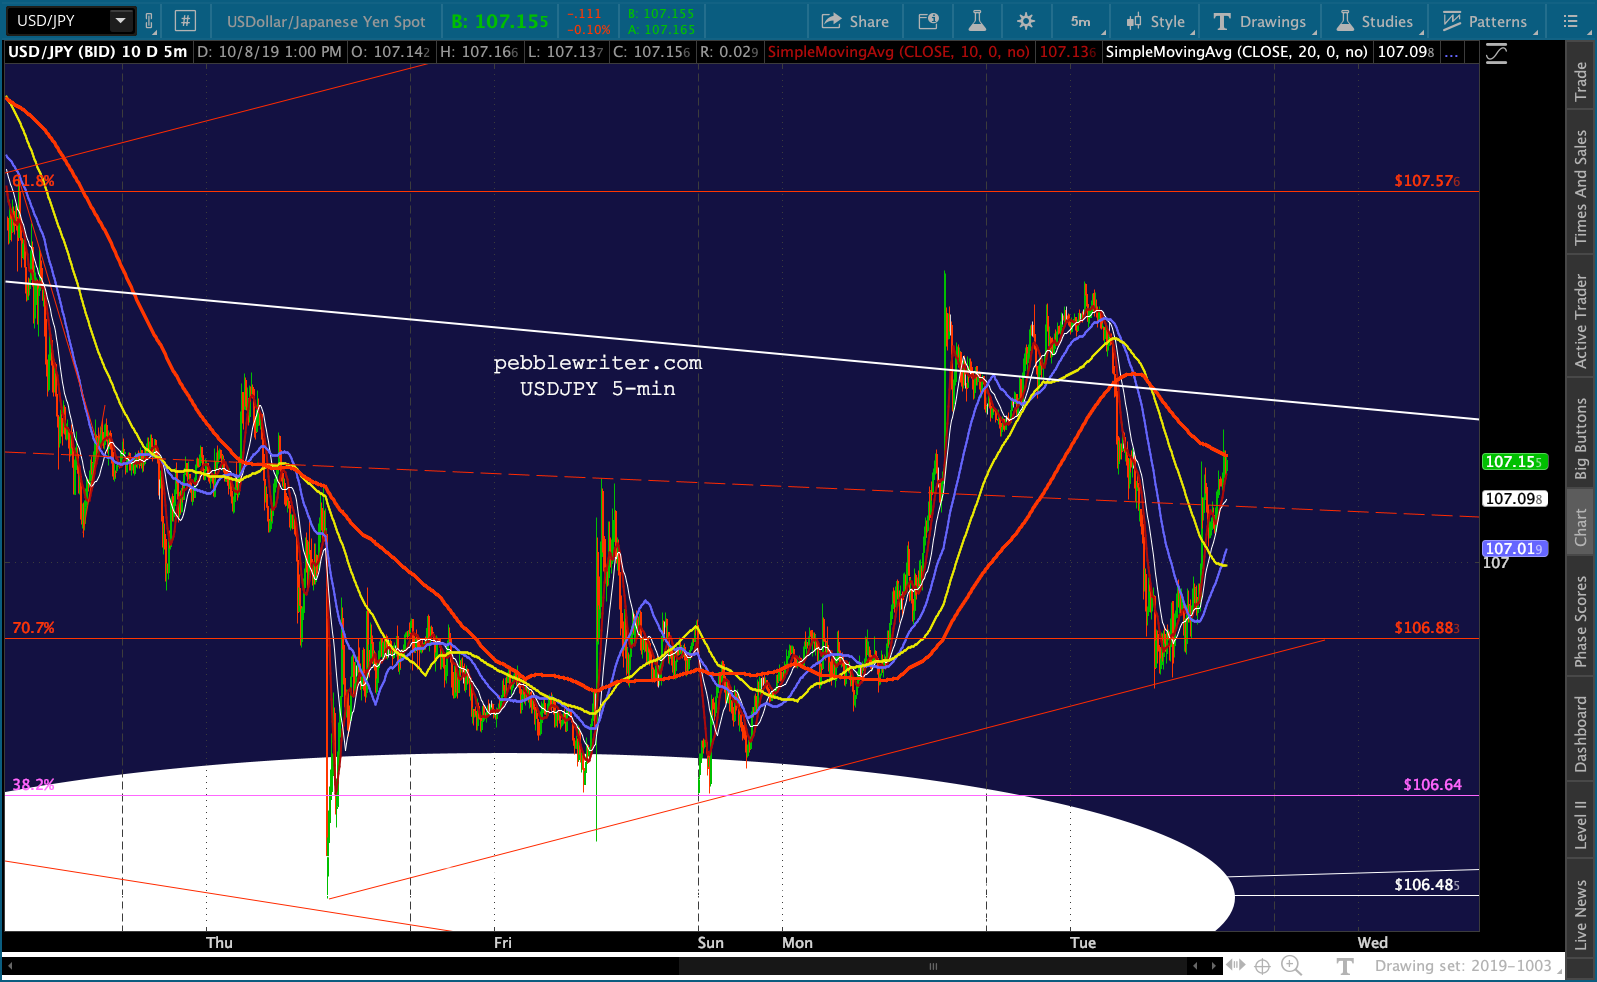
 USDJPY and NKD are still holding their own…for now.
 And, VIX has made up more than half its losses since Thursday.
 UPDATE: 11:37 AM
One of the reasons I was uncertain about a bounce the other day was that it would raise the possibility of a large H&S Pattern. It can be seen for ES below in yellow. It would complete (if today) around 2860 — about 13 points above ES’ SMA200 — and would target 2669.41.
 That’s a significant level, as it correlates with the white .500 Fib on the daily chart below. It would also tag the bottom of the yellow channel…
  …which is a subset of the larger white channel from 2009.
 So, again, it would be a perfectly acceptable target in a perfect, unfettered world. It’s worth putting a pin in it just in case.
On the SPX chart, the budding H&S Pattern would complete at 2858.50 and would target 2682. As above, it would correlate with the white .500 and would come pretty close to an important channel line — the midline of the gently rising purple channel. Interestingly, it would also intersect with a TL drawn between the Aug 5 low and the .618 target I have for the early Nov low at 2606.87.
 I seriously doubt that Trump will let things get so out of hand at this time. But, it’s important to know that the charts would support a completion of the H&S and a drop to 2682. It’s also important to note that SPX’s SMA200 has now surpassed its .886 at 2844.91. This is one of the side effects of putting off the current plunge so long.
If it had occurred on Sep 13 (Day 32) as the analog had suggested, the SMA200 would still have been below the Aug 5 lows. Again, this would never have been a problem had the Aug 5 plunge not exceeded the analog target by such a large margin.
In a perfect world, SPX would dip to 2844.91 today, nicking the SMA200 in the process. But, I worry (I always worry) that the algos won’t permit it and will instead delay the SMA200 tag until it reaches the yellow neckline sometime around Oct 16 or Oct 21. Note that in 2015, it tagged the SMA200 all three times: Day 46, 55 and a 23-pt overshoot on Day 58.
 From the looks of things, a failure to tag 2845 either at the close or tomorrow morning would quite likely result in such a scenario playing out.
UPDATE: 12:50 PM
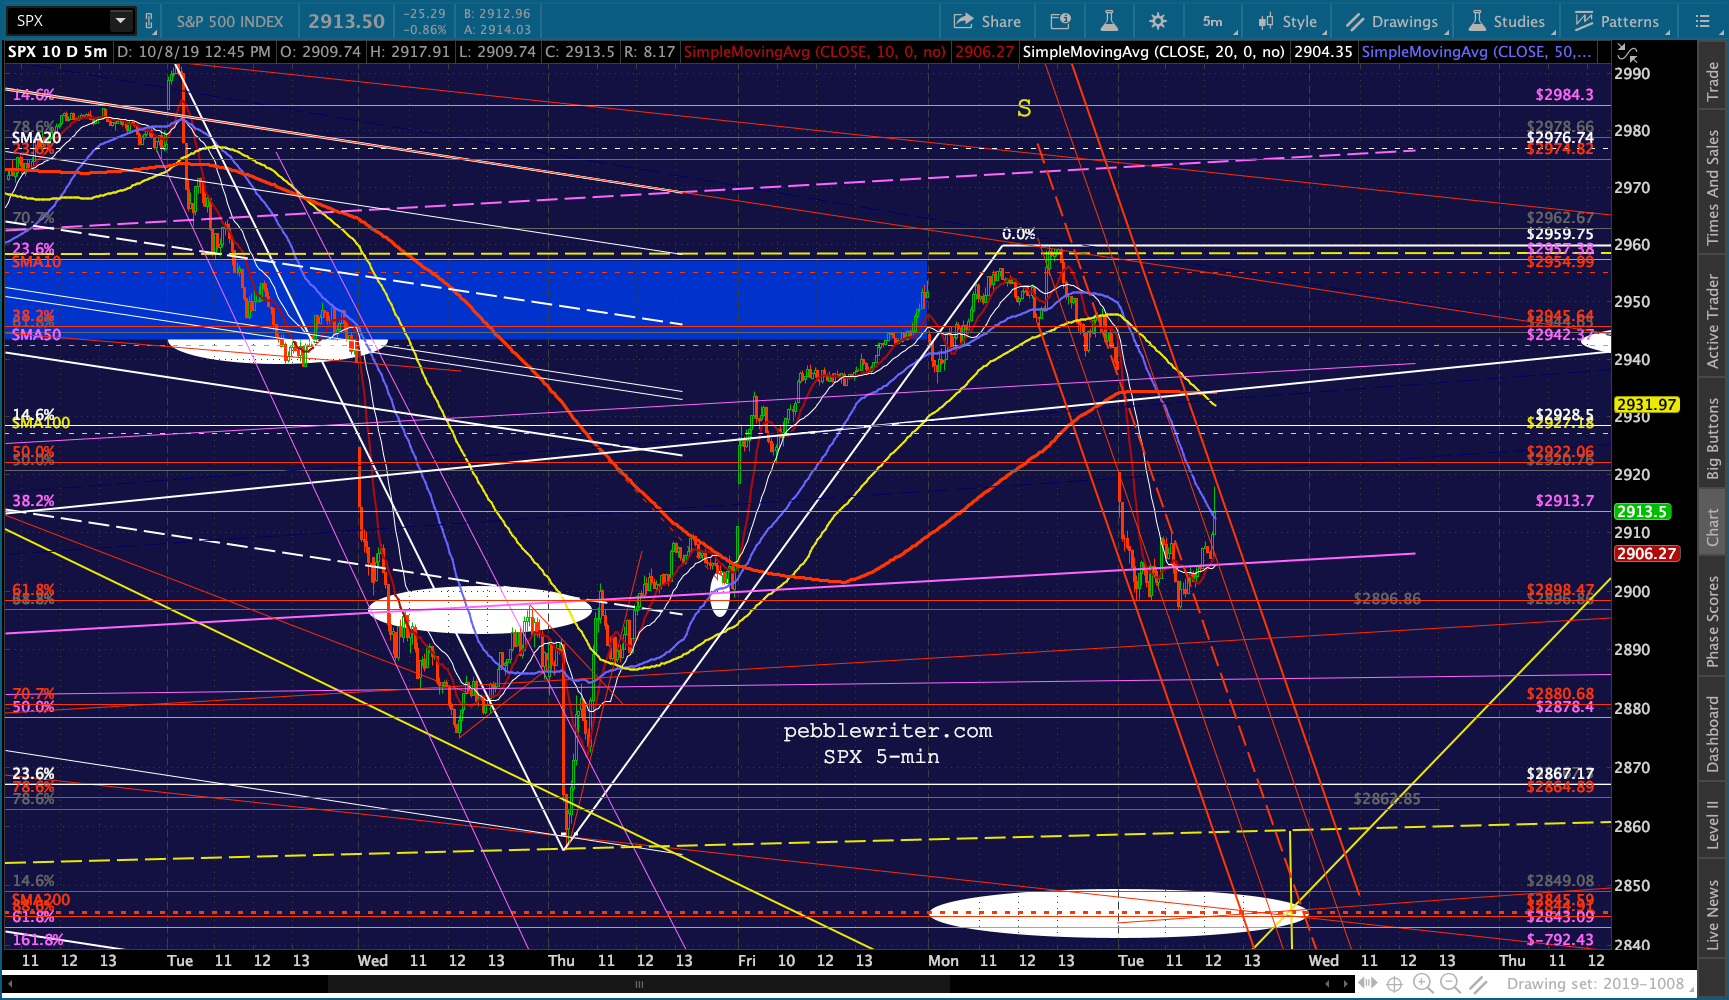
Pretty much do or die time if it’s going to happen today. TPTB shouldn’t be too worried about a 14-15 point overshoot of the SMA200 as long as there’s a decent Fib line from which to rebound.
 I believe DJIA argues for the quick dip — a double tap on the SMA200 similar to what occurred on Aug 5 and Aug 7.

 Decision time for CL, RB, USDJPY and NKD.


 UPDATE: 2:02 PM
A crack opens…
 UPDATE: 5:00 PM
EOD leaves SPX 47.51 shy of its SMA200, which closes the day at 2845.55. ES closed at the dotted red TL, which is a concern for the bears.
 VIX picked a place that wasn’t very significant.
 Bottom line, we are perfectly positioned for the rest of the move first thing in the morning. That’s what worries me.
The rest of the cast shows nothing but algo-baiting all day long.


 More in the morning…