

Thanks to the ongoing assault on VIX, the bear rally from mid-June is on the brink of becoming an actual breakout. Bolstered by some key earnings beats and surprisingly dovish commentary from Powell, fundamental buyers can’t be faulted for being bullish.
 Or…it could just be a masterful headfake designed to wash out the massive downside bets which had legitimately accumulated earlier in the year – in which case, a sharp downdraft is just ahead after this morning’s data dump.
continued for members…Our analog is in serious trouble, with the timing thrown off (at the very least) by 10 days and counting.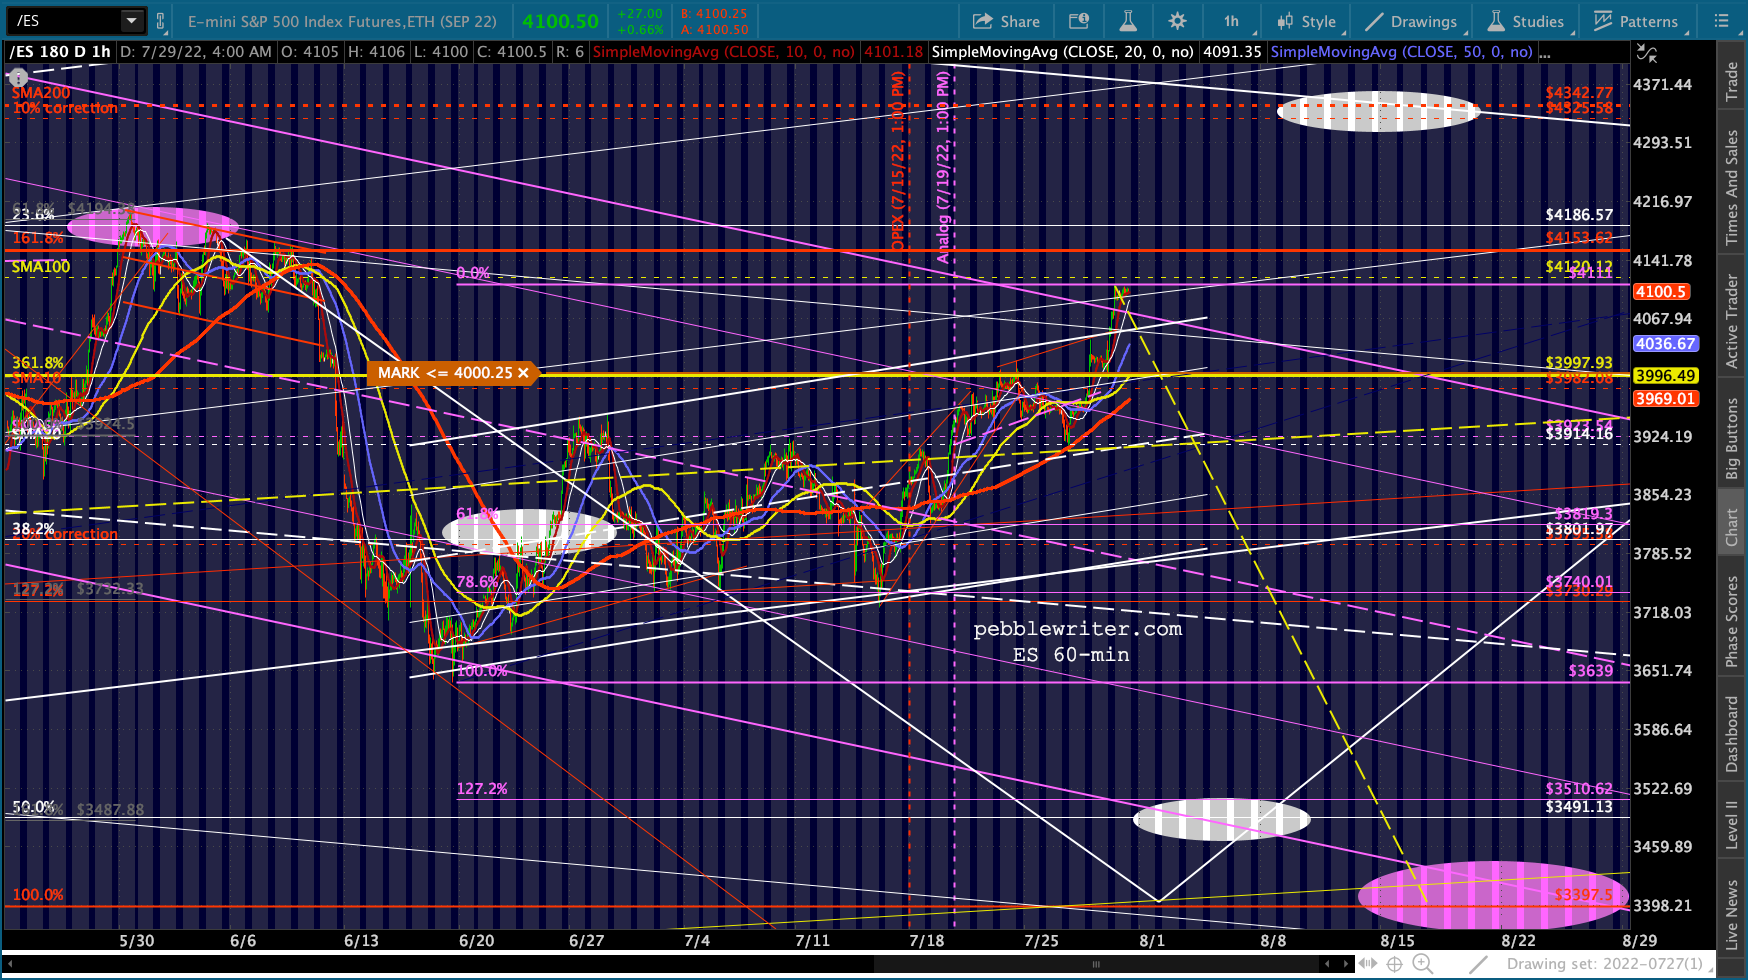 The fact that ES has topped the 3.618, broken out of its flag pattern, and is threatening to break out of the falling purple channel is of particular concern. If it pushes past the SMA100 at 4120, there isn’t much resistance between there and the SMA200 at 4342.
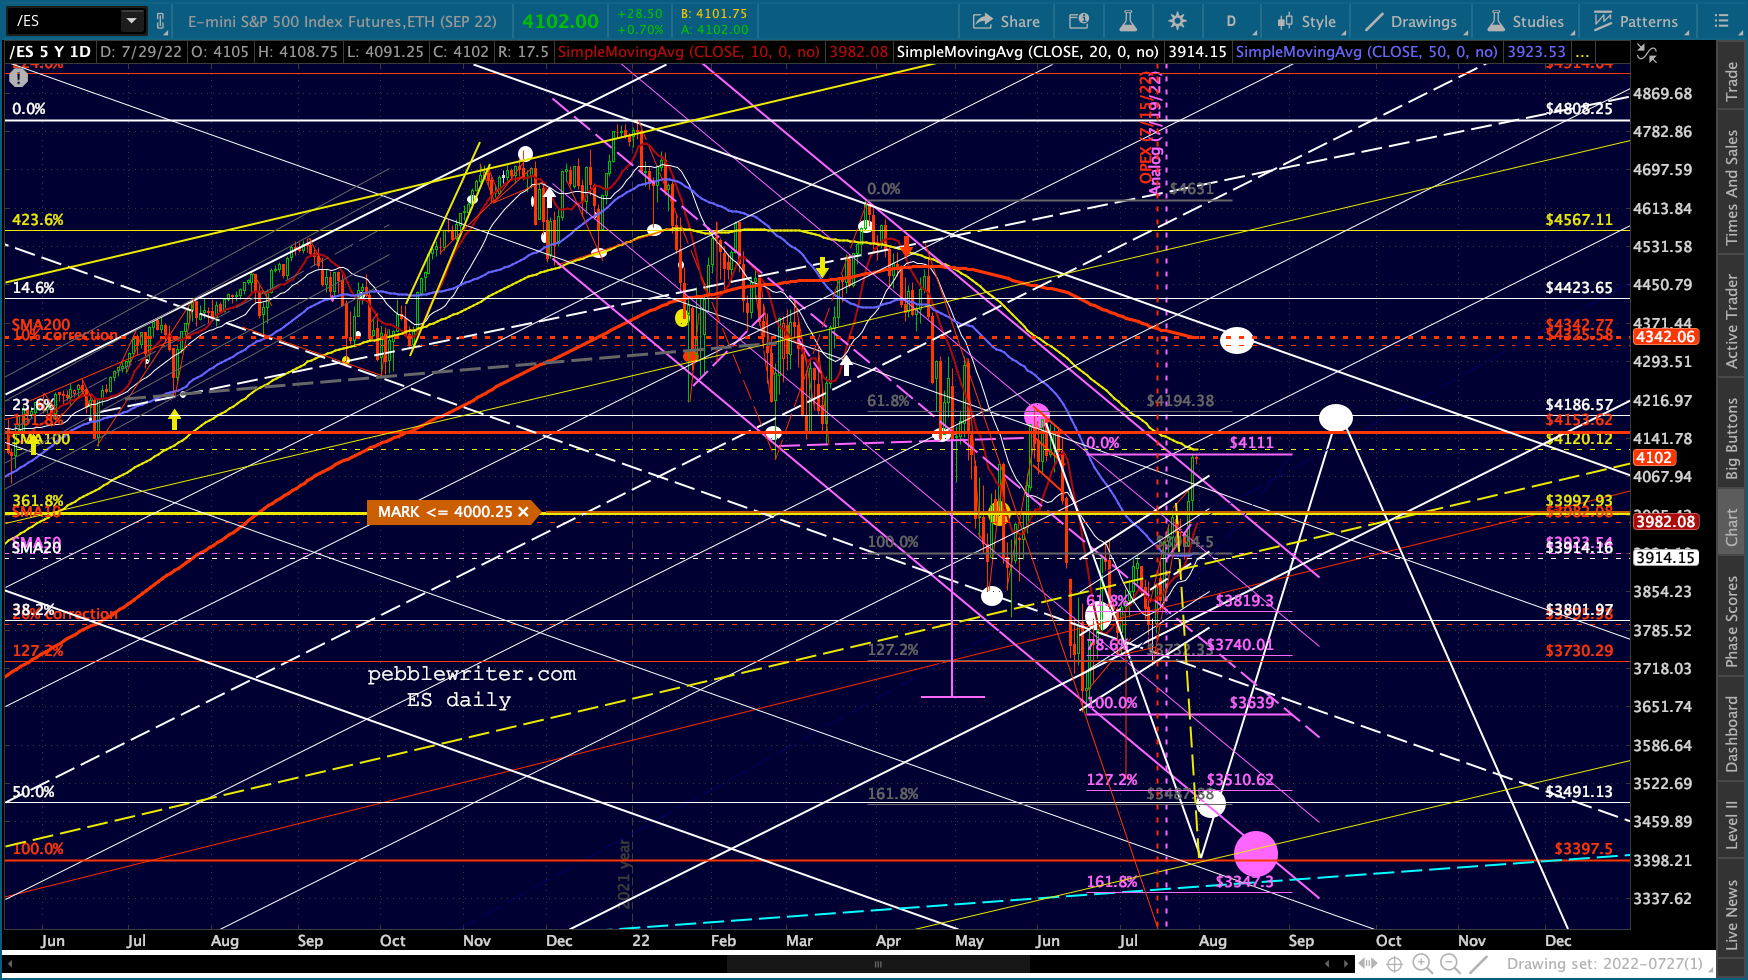 SPX tells a very different story. It hasn’t broken out of its flag pattern (but could if futures don’t come back to flat by the open.) It also hasn’t yet broken out of the falling purple channel. Last, it has backtested its yellow channel midline without breaking through.
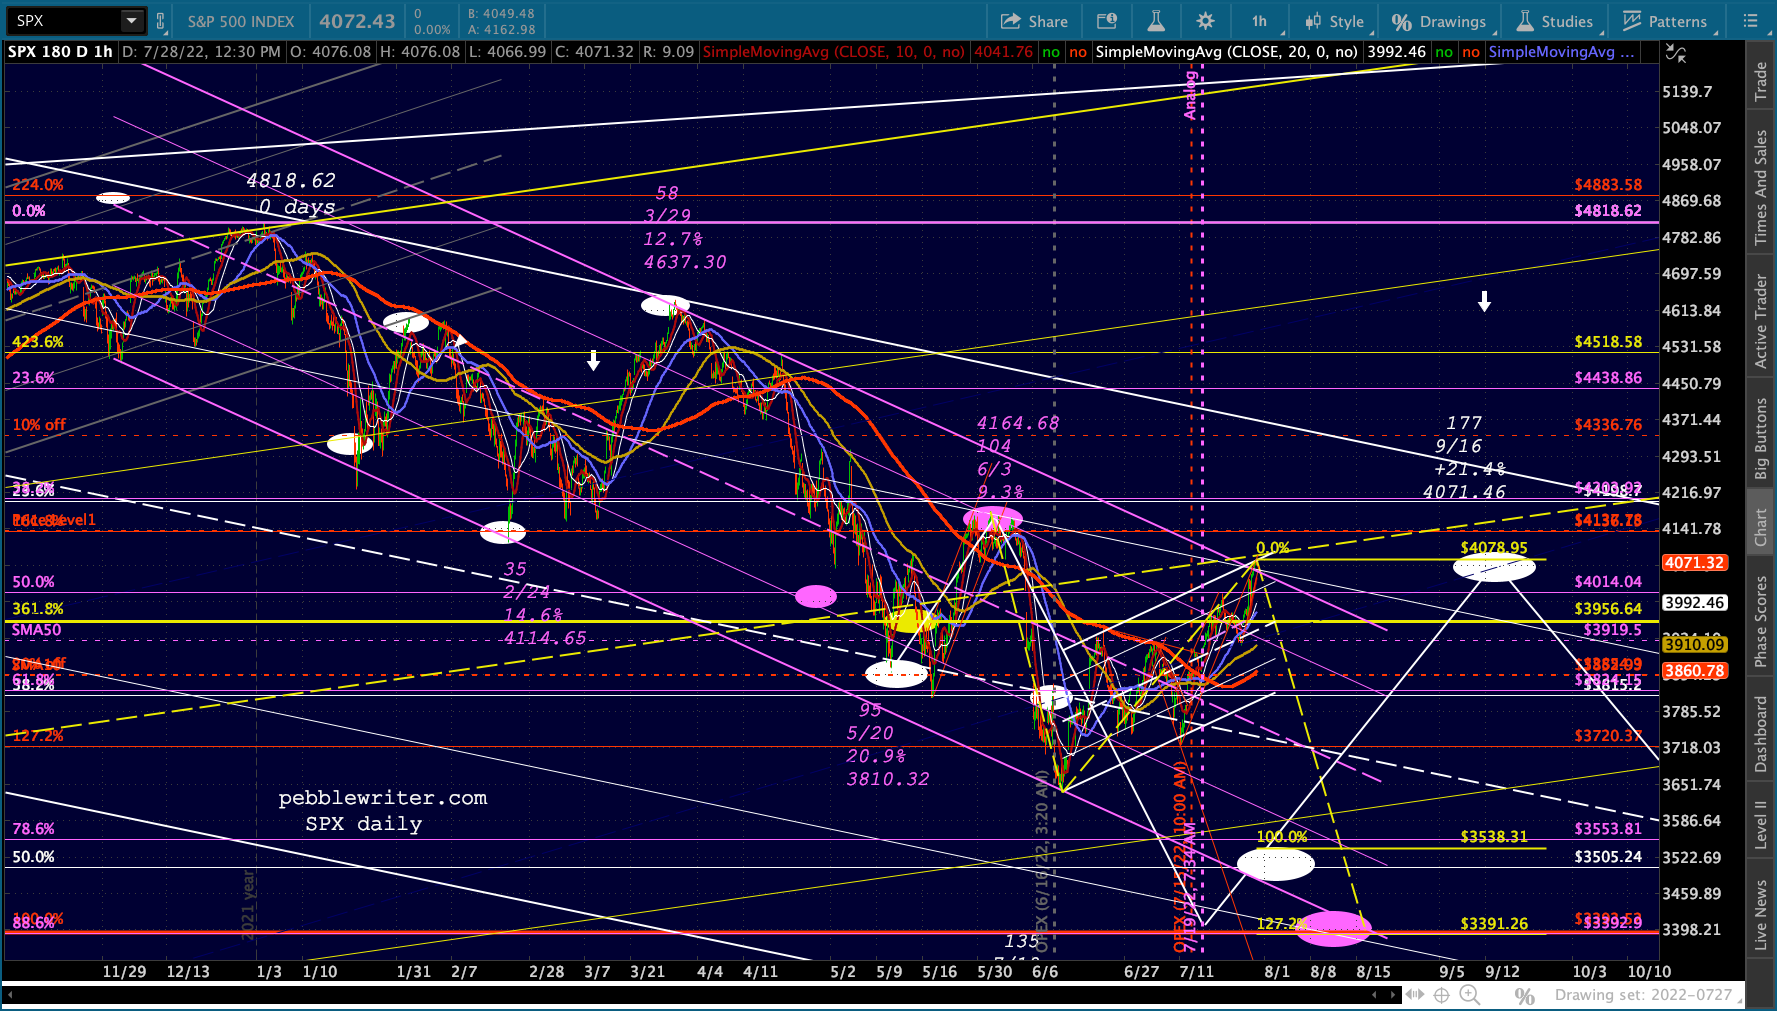 COMP also faces resistance at the SMA100 and channel line.
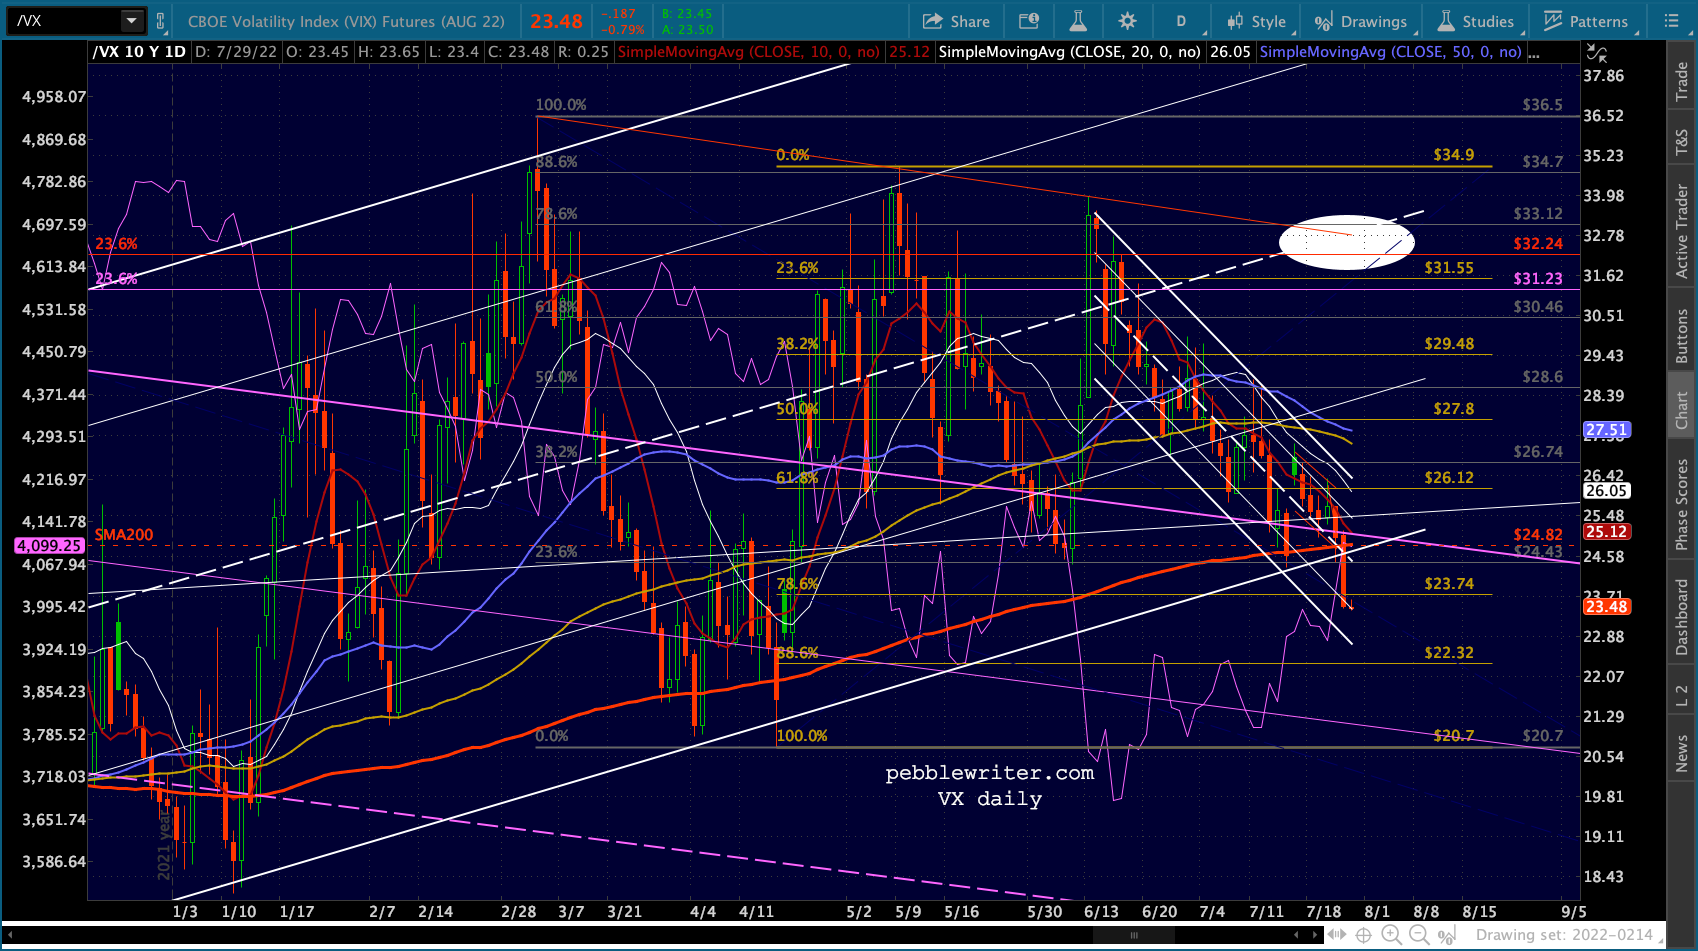
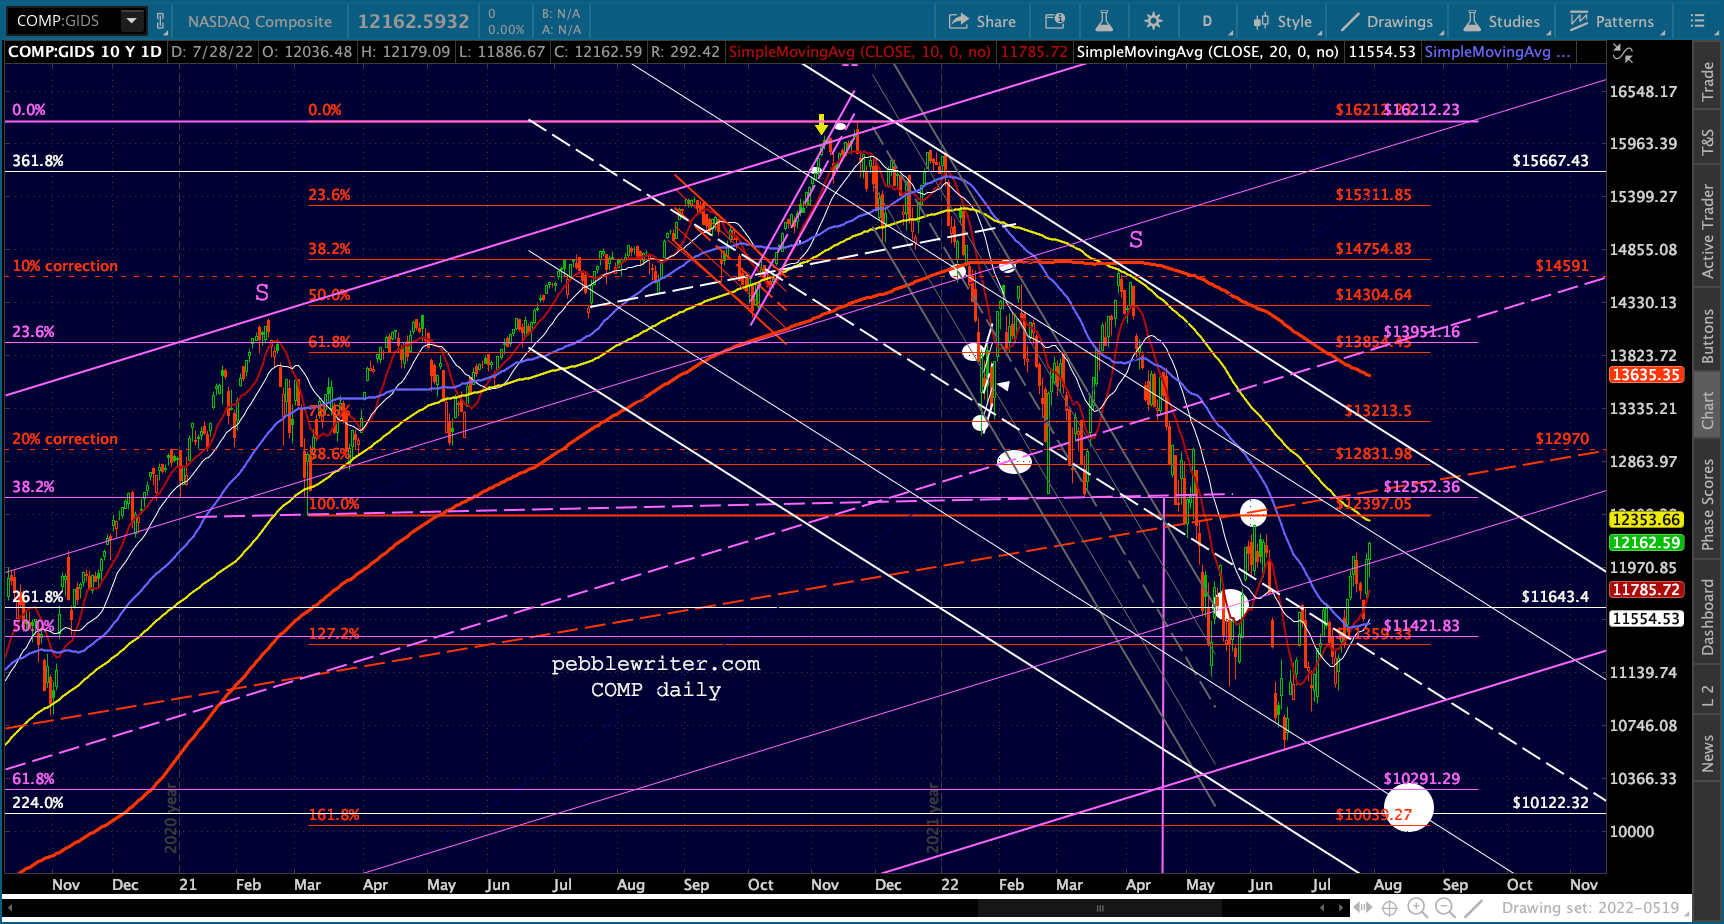 It all boils down to VIX, which is still clinging to its rising white channel bottom.
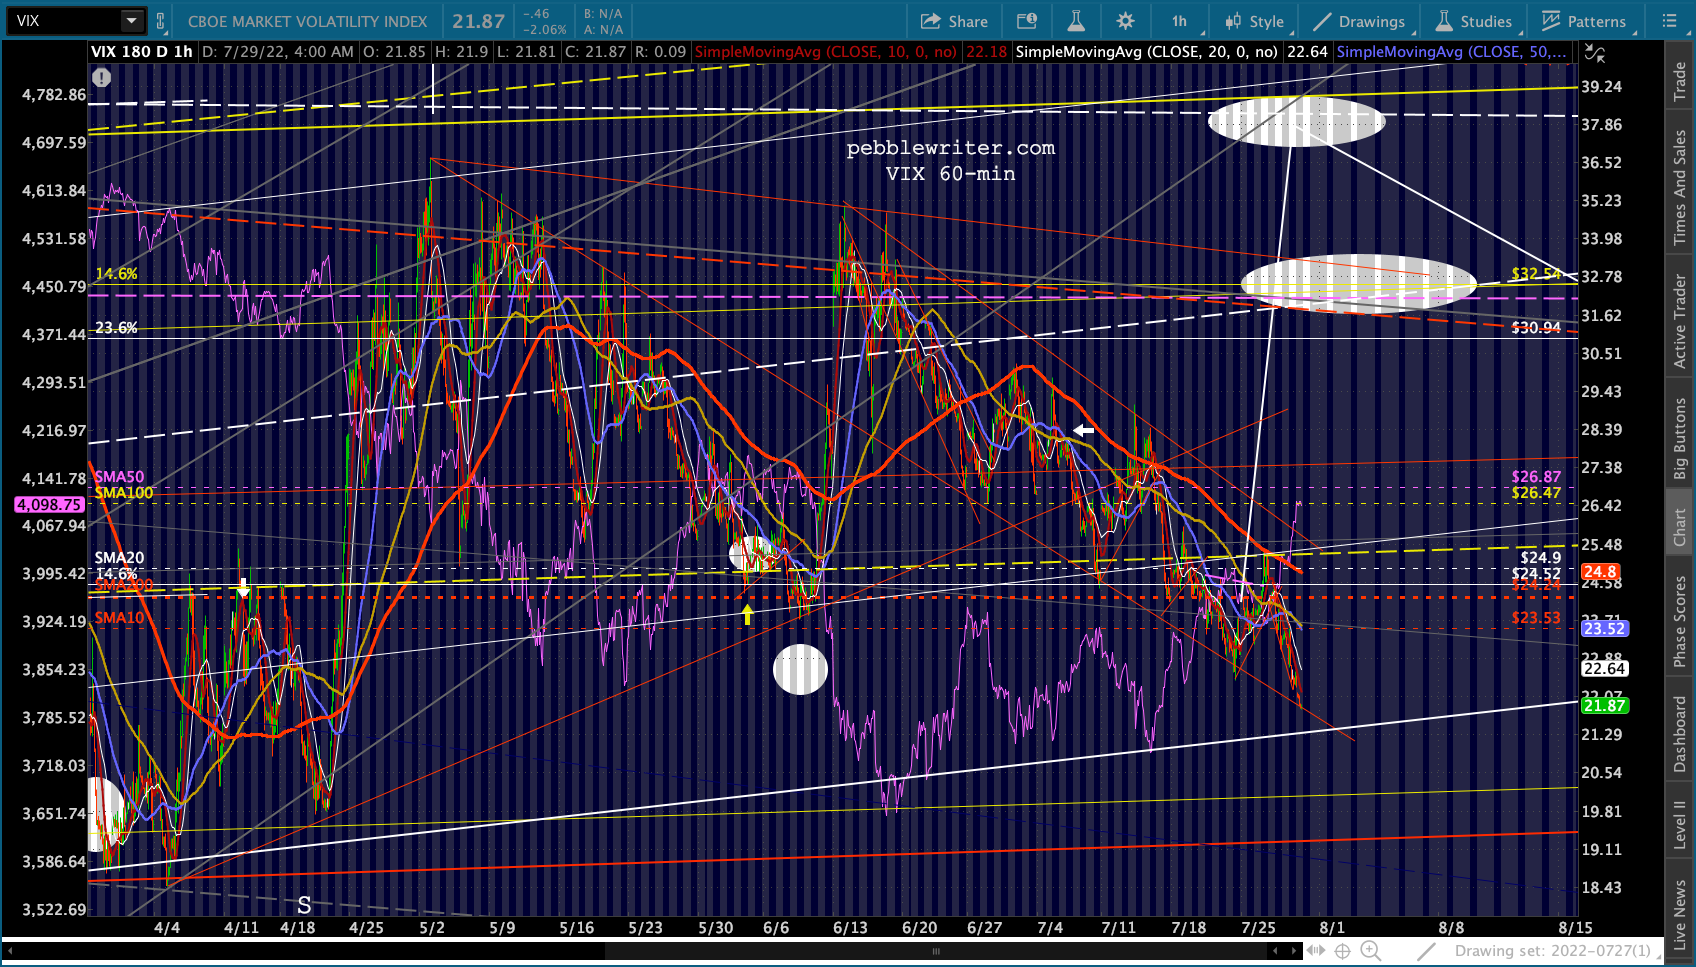
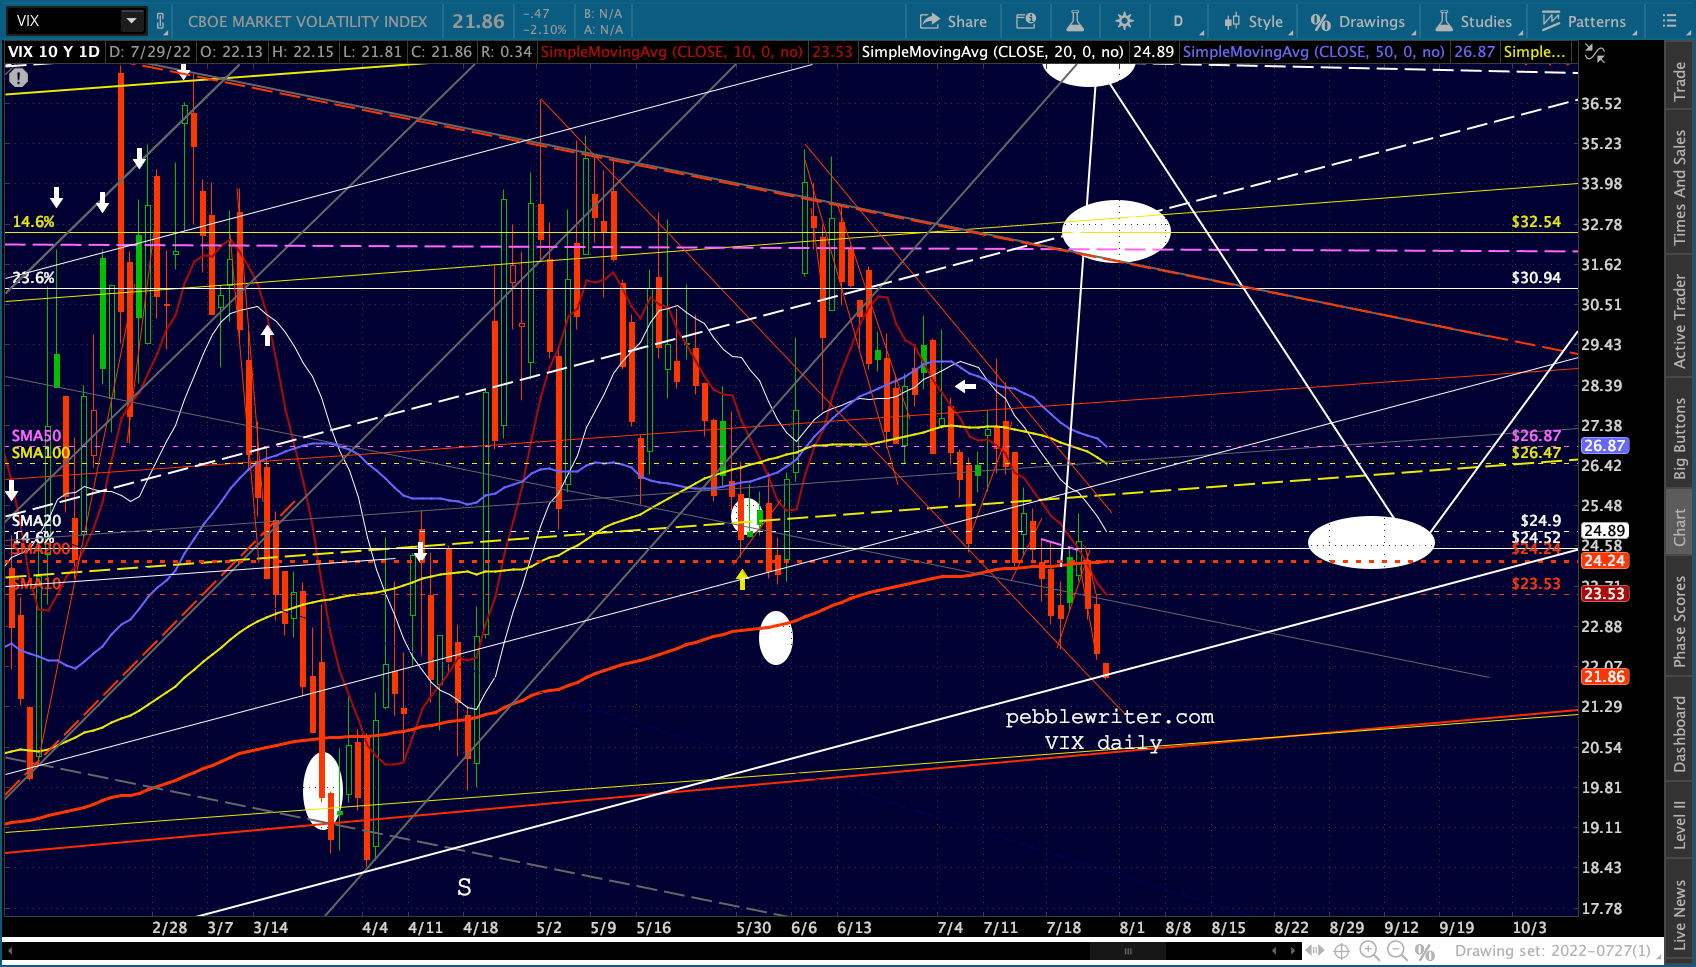 It couldn’t fall much further without guaranteeing a continuation of the equity rally.
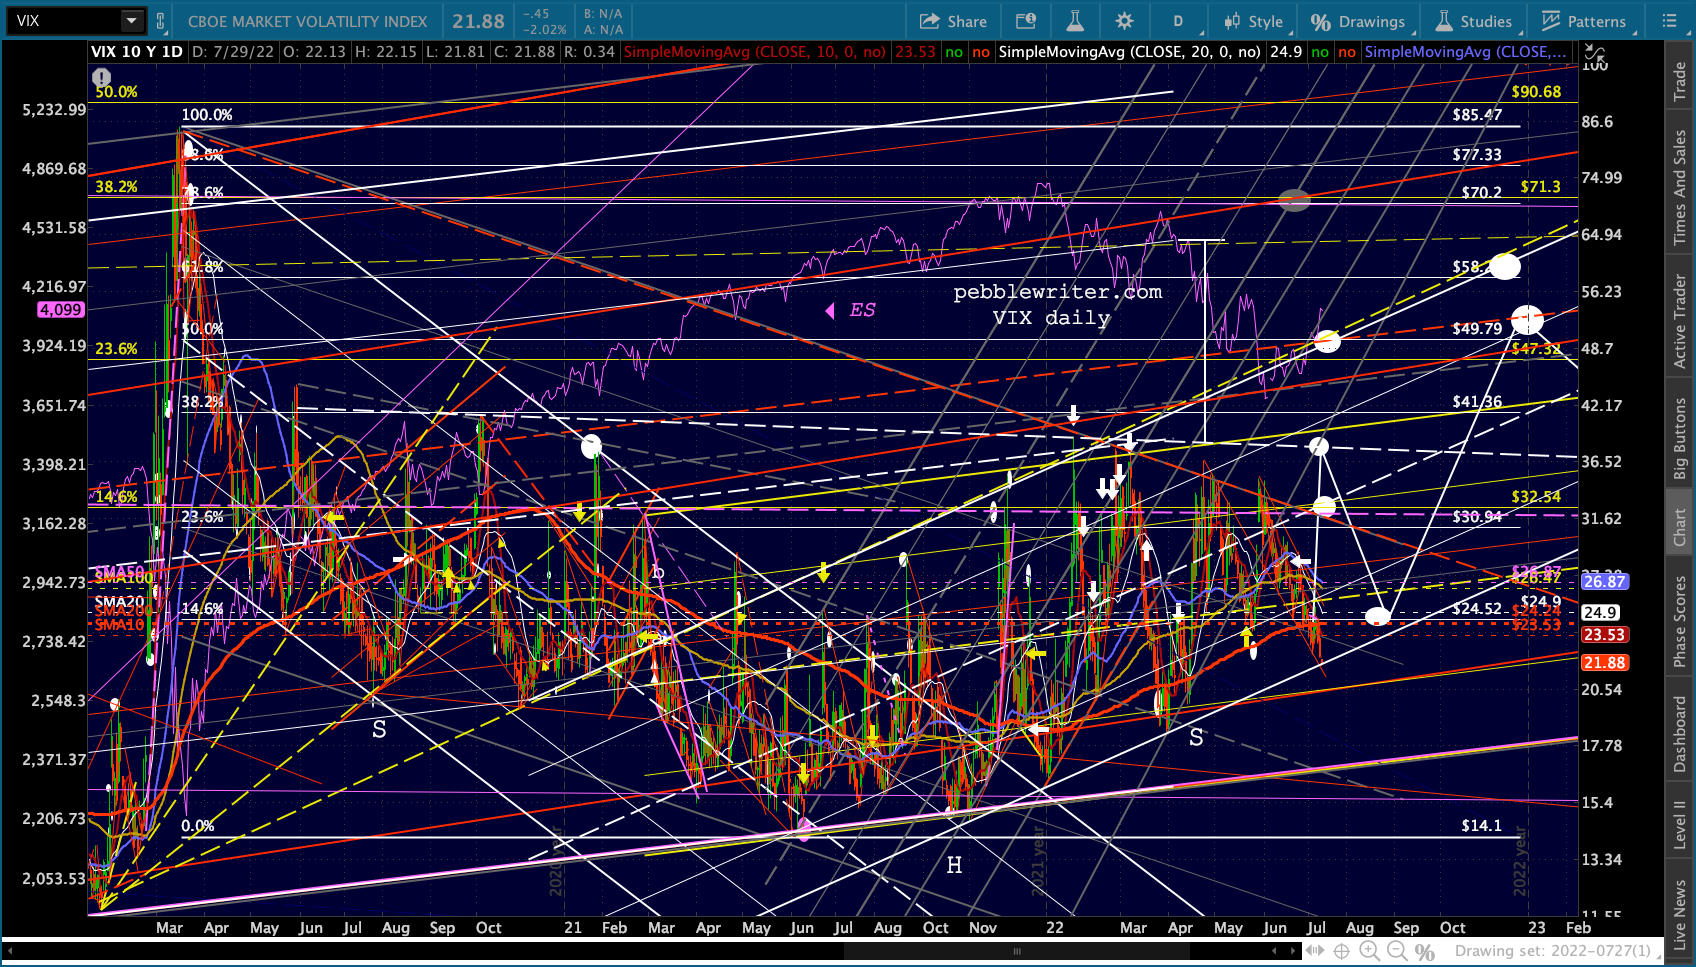 VX looks to have already done so – though there are examples of past dips going further than the channel might have indicated.
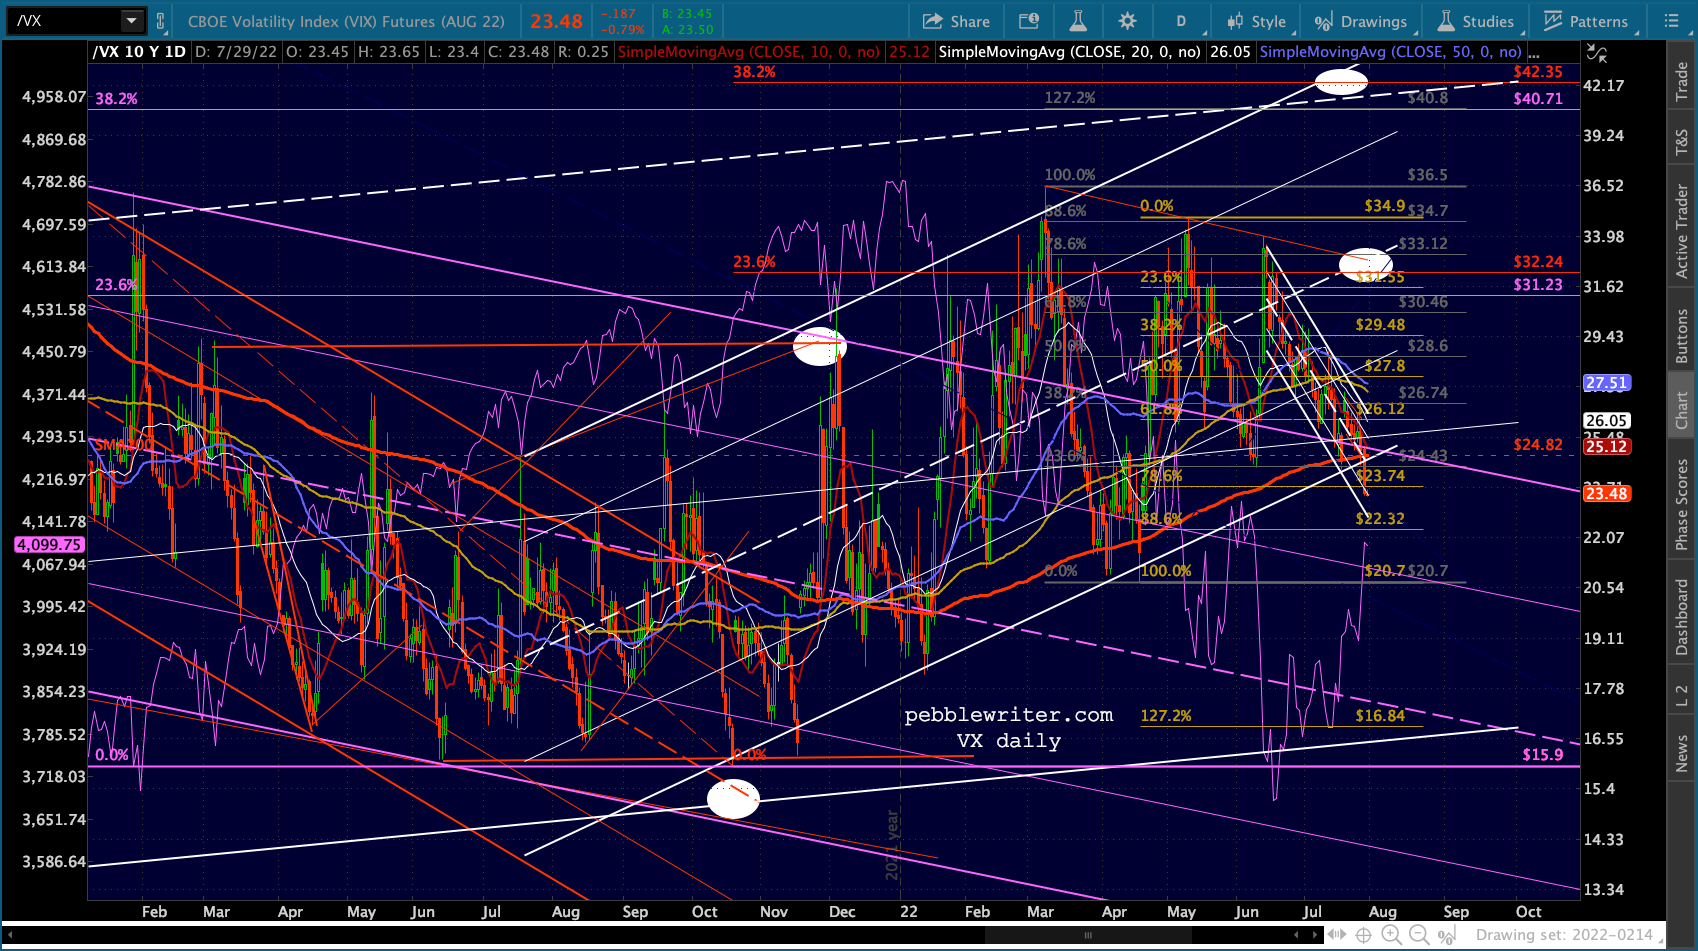
 USDJPY has the potential to at least offset some of the VIX-driven euphoria, but has finished backtesting an important channel midline.
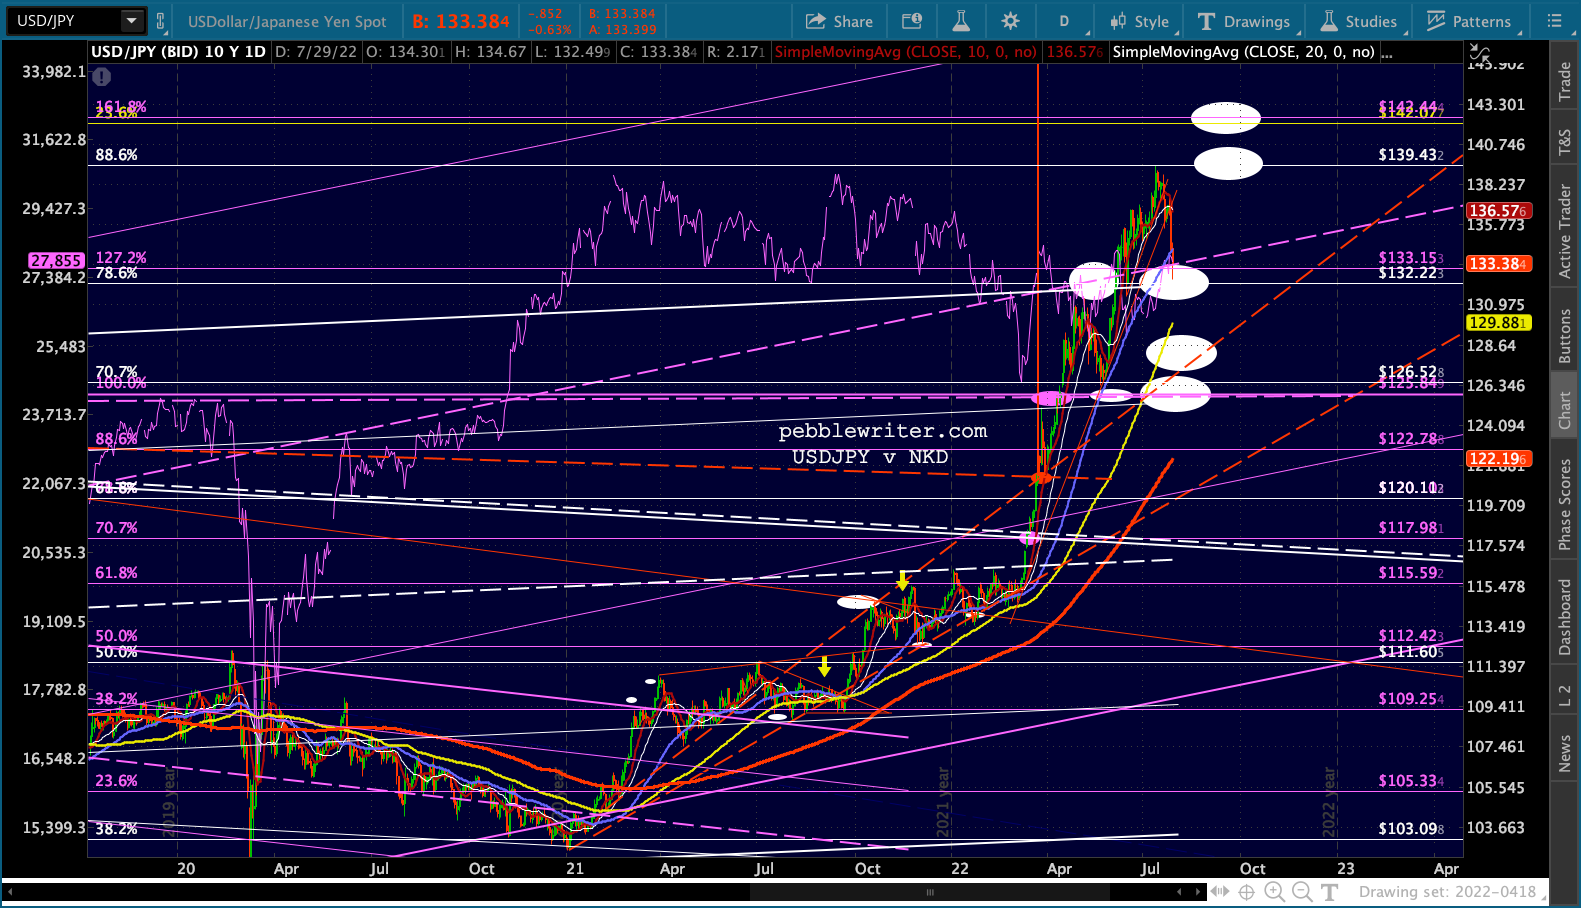 So does EURUSD, which is threatening (falsely, I believe) to continue its bounce.
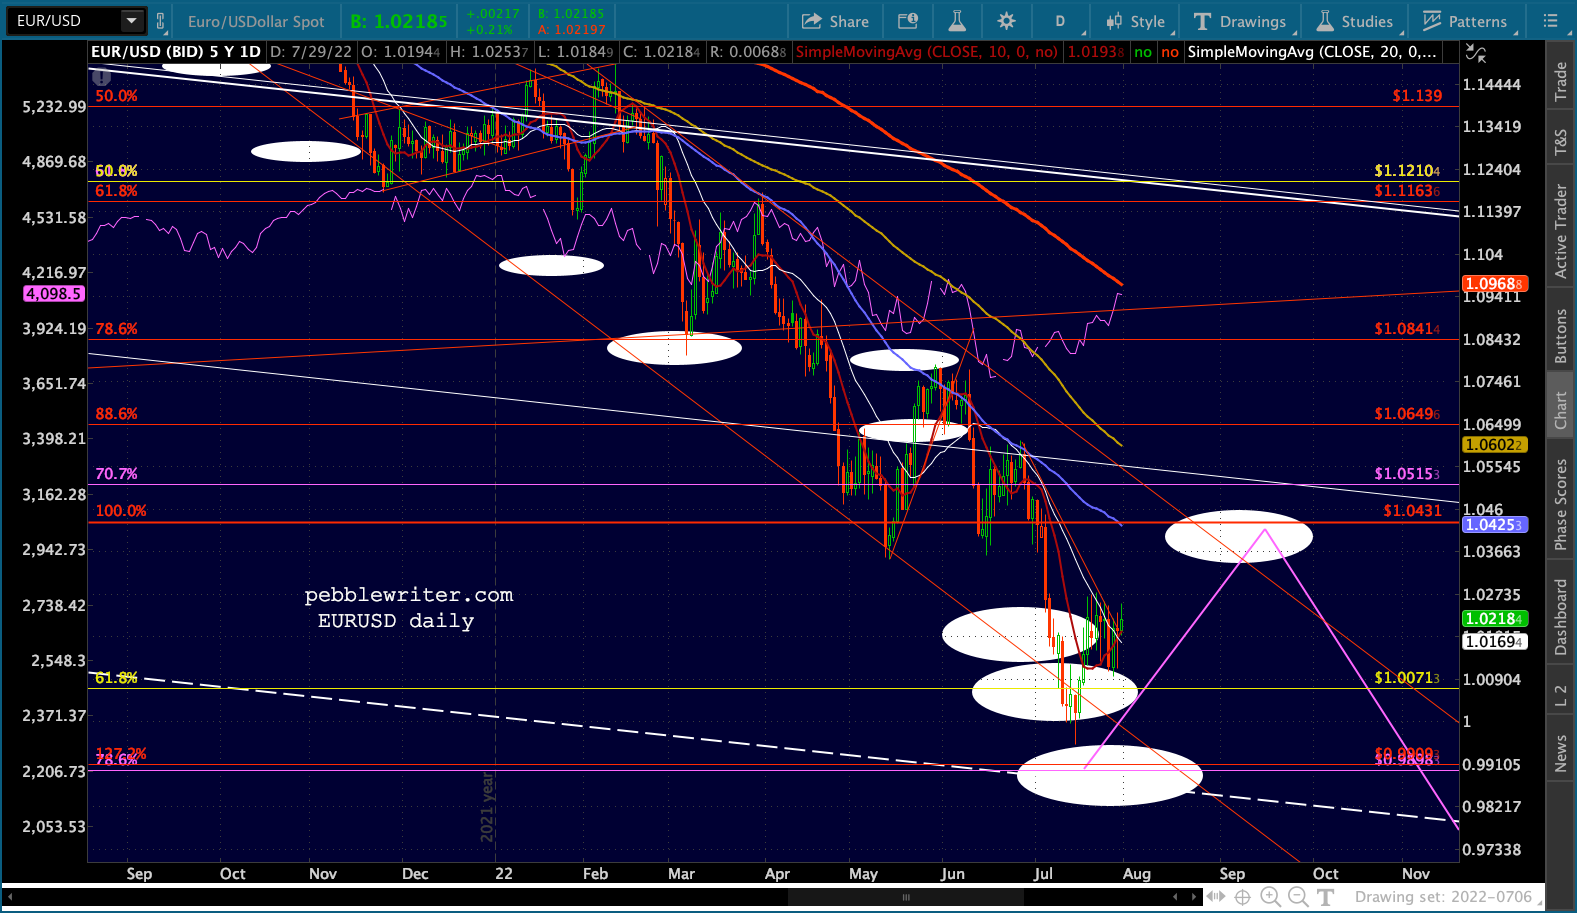
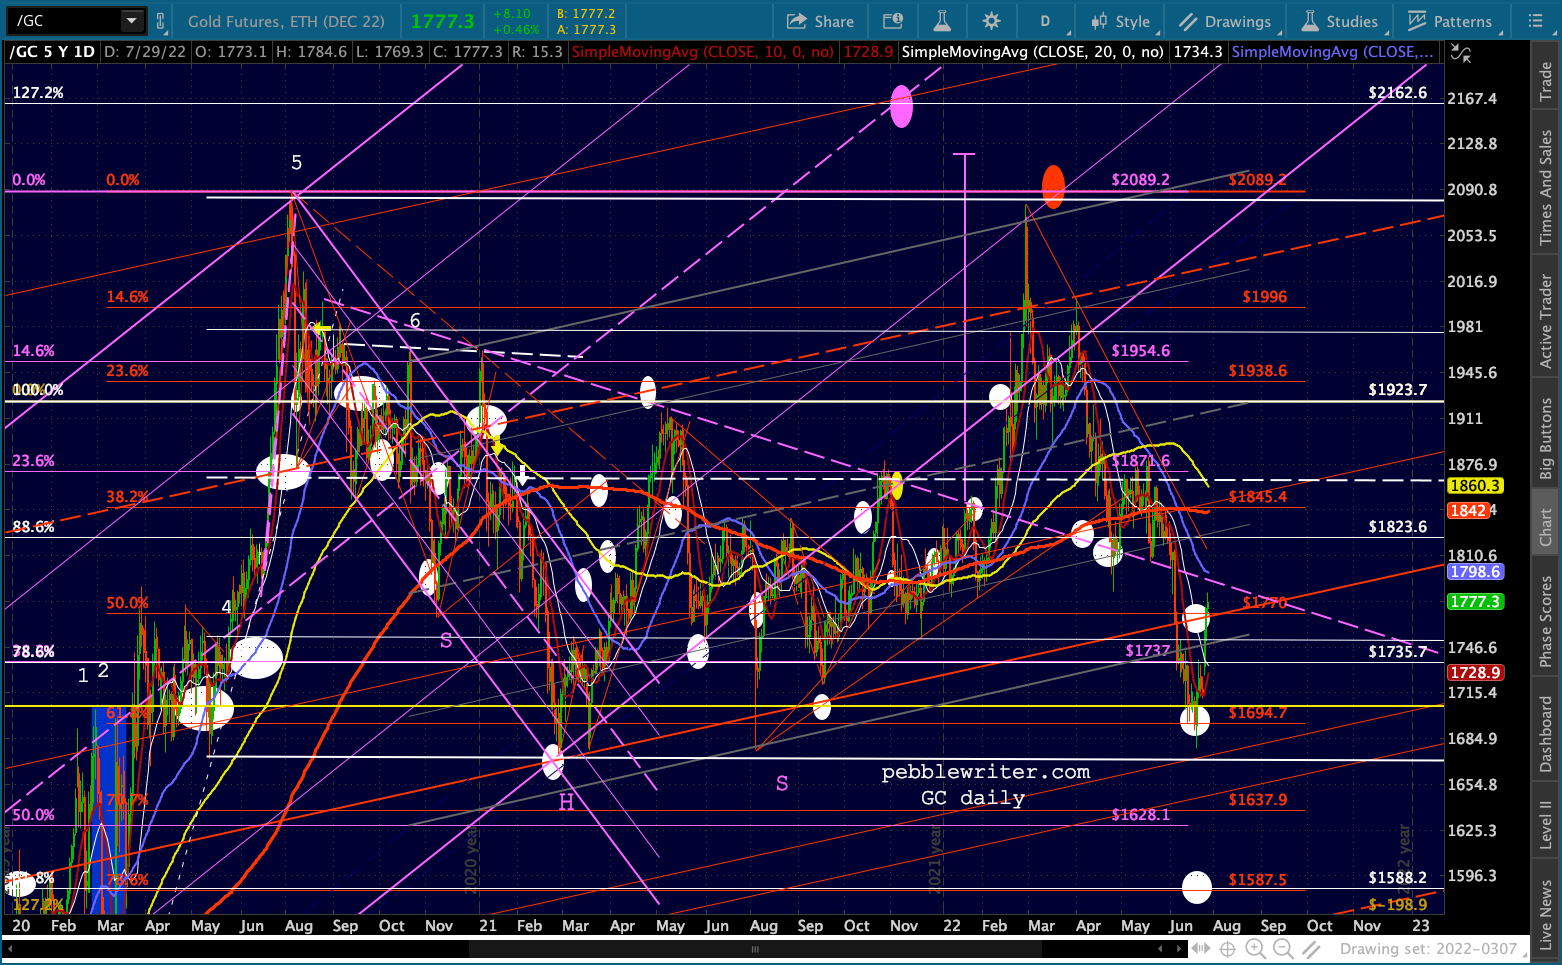
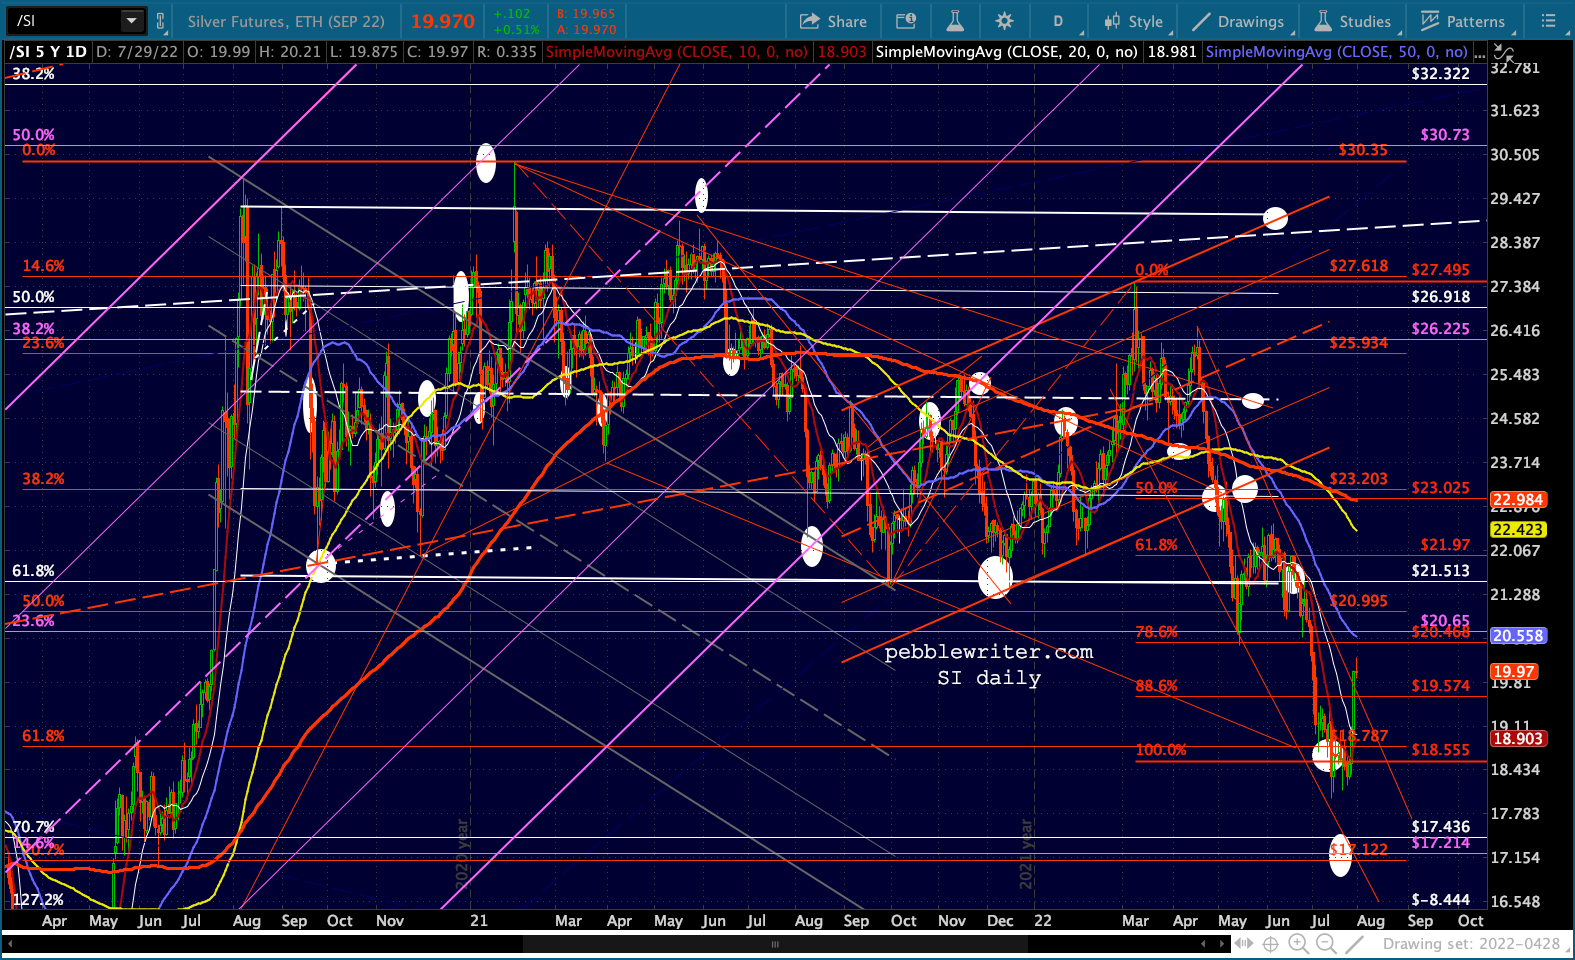
 Gold and silver have seen sharp bounces, backtesting previous support (now resistance.)
 And, BTC is in the same position as SPX – bumping up against the top of a flag pattern, which typically signals a continuation to the downside.
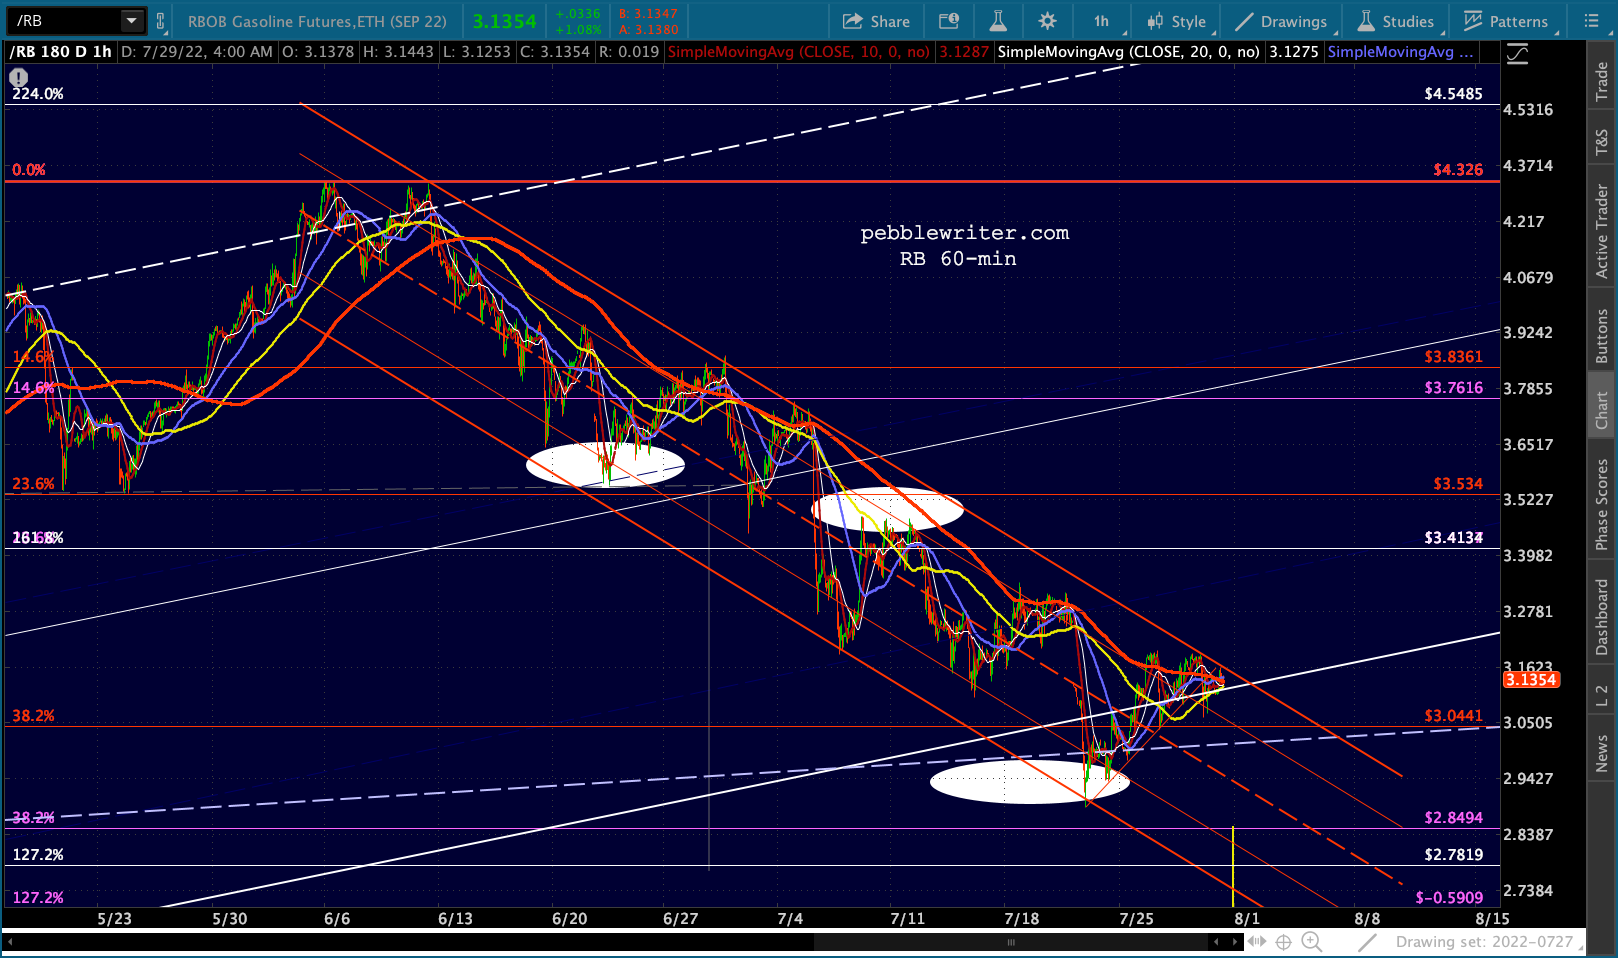
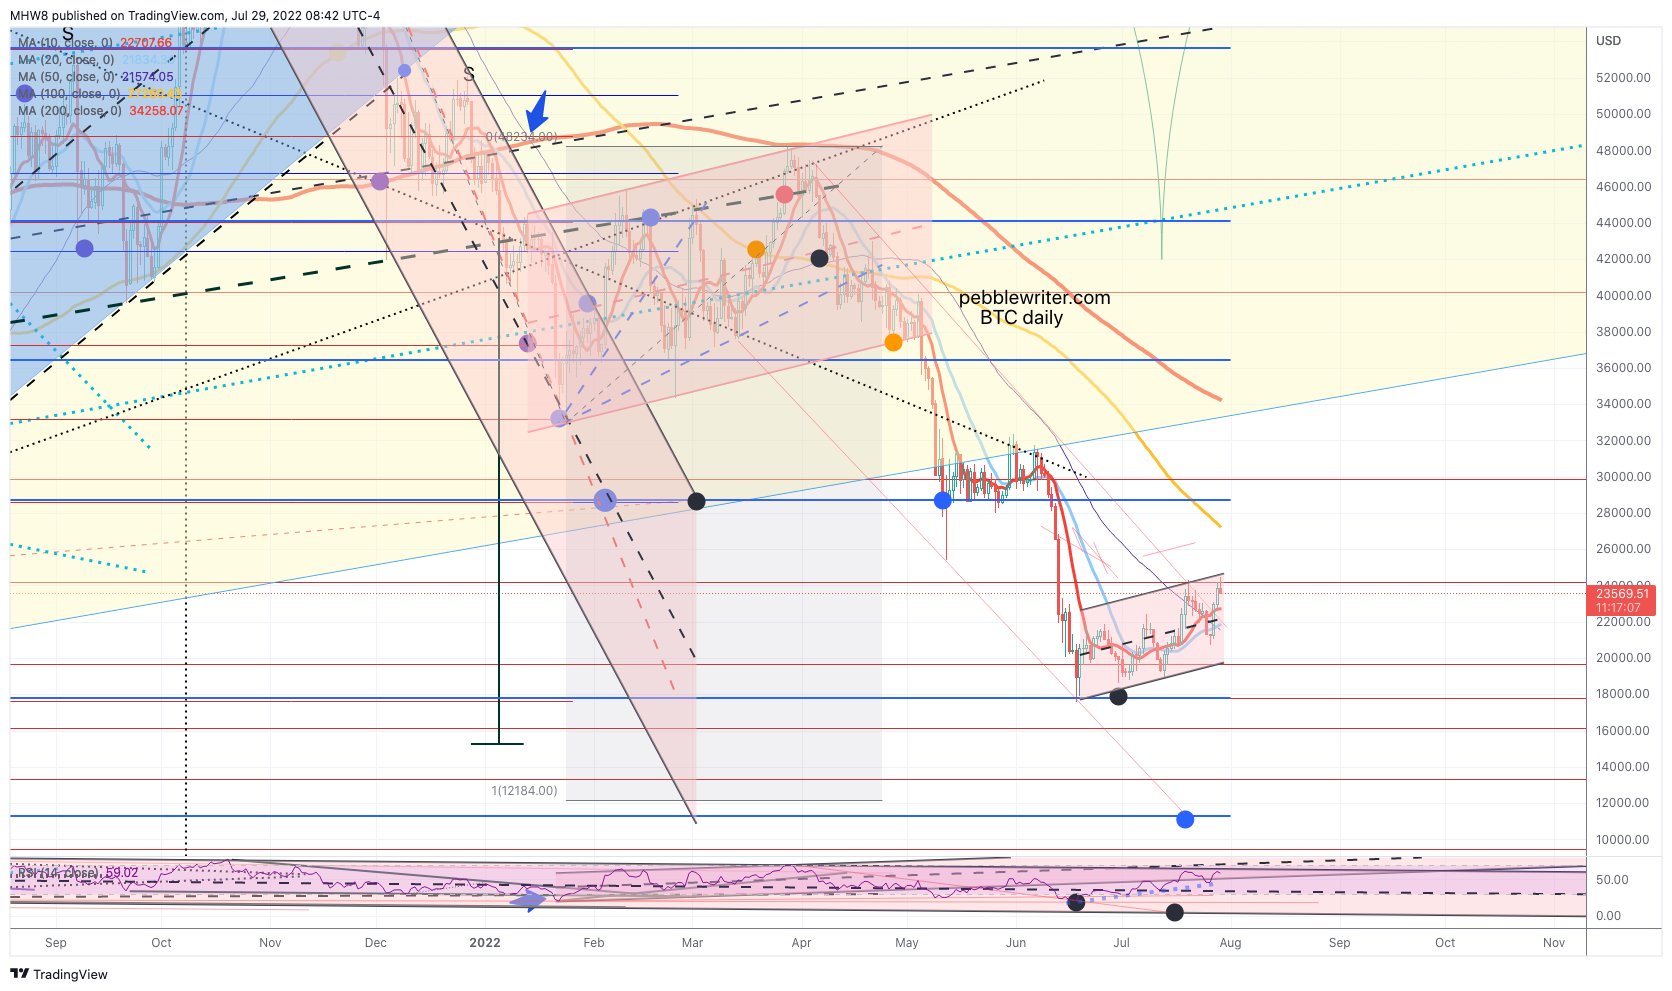 I’m still looking for more downside from CL and RB…
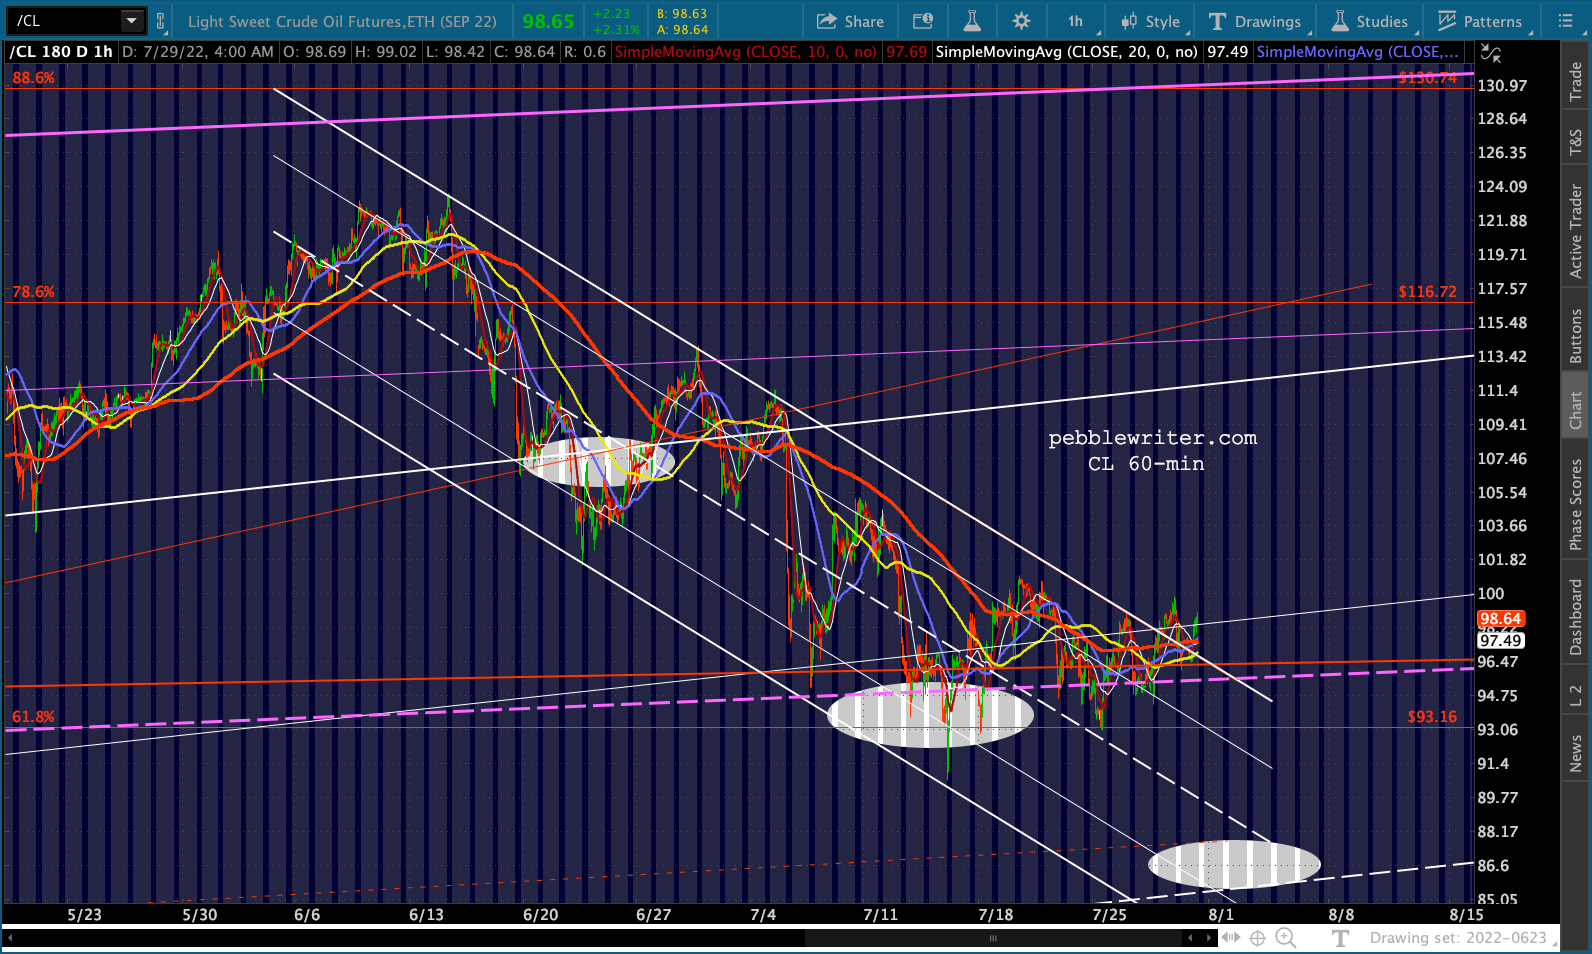
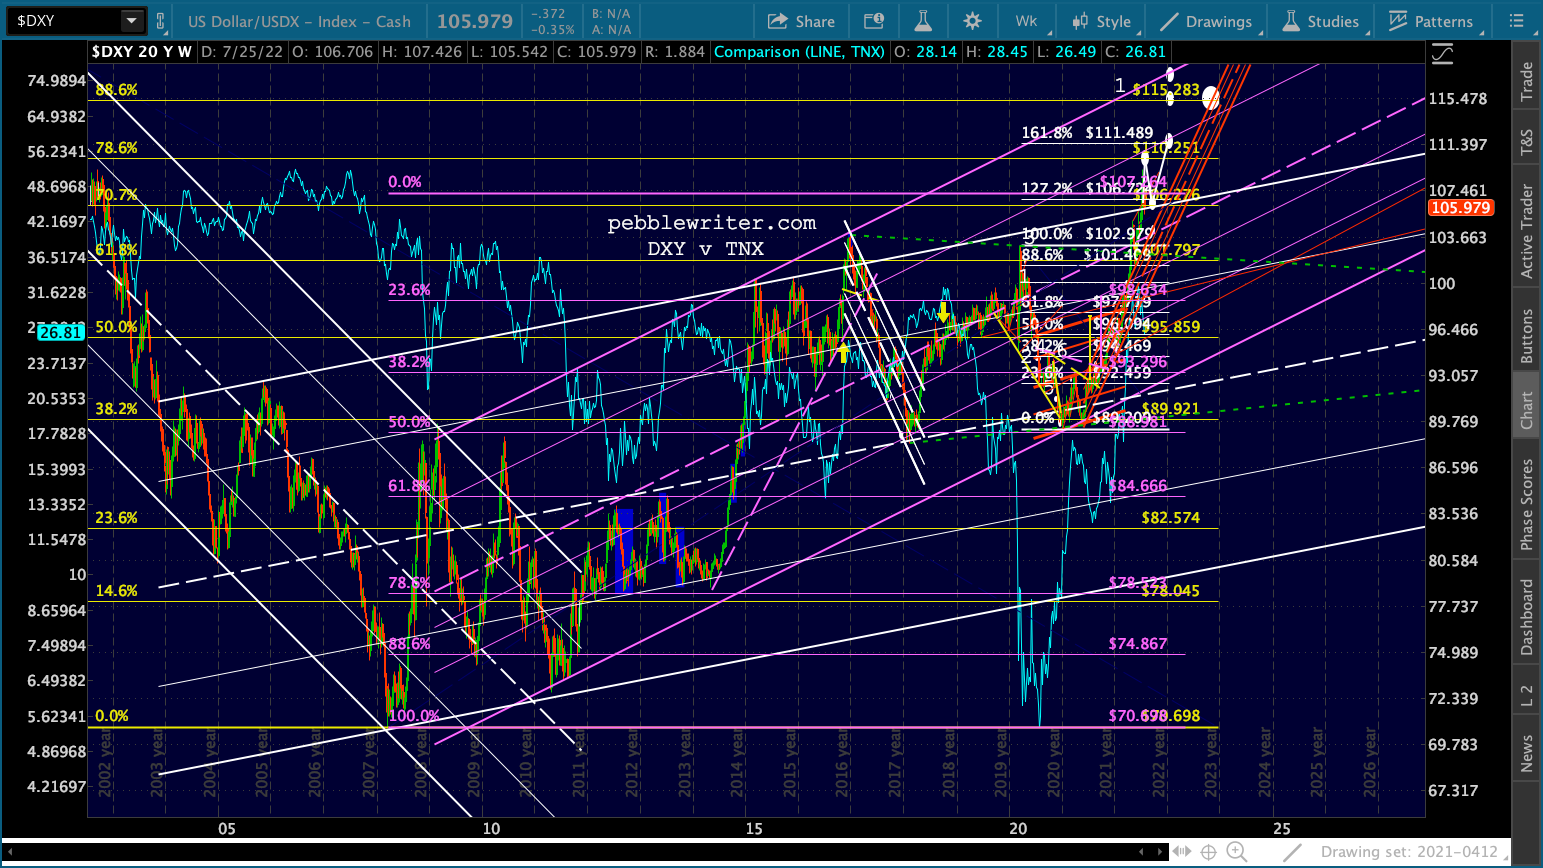
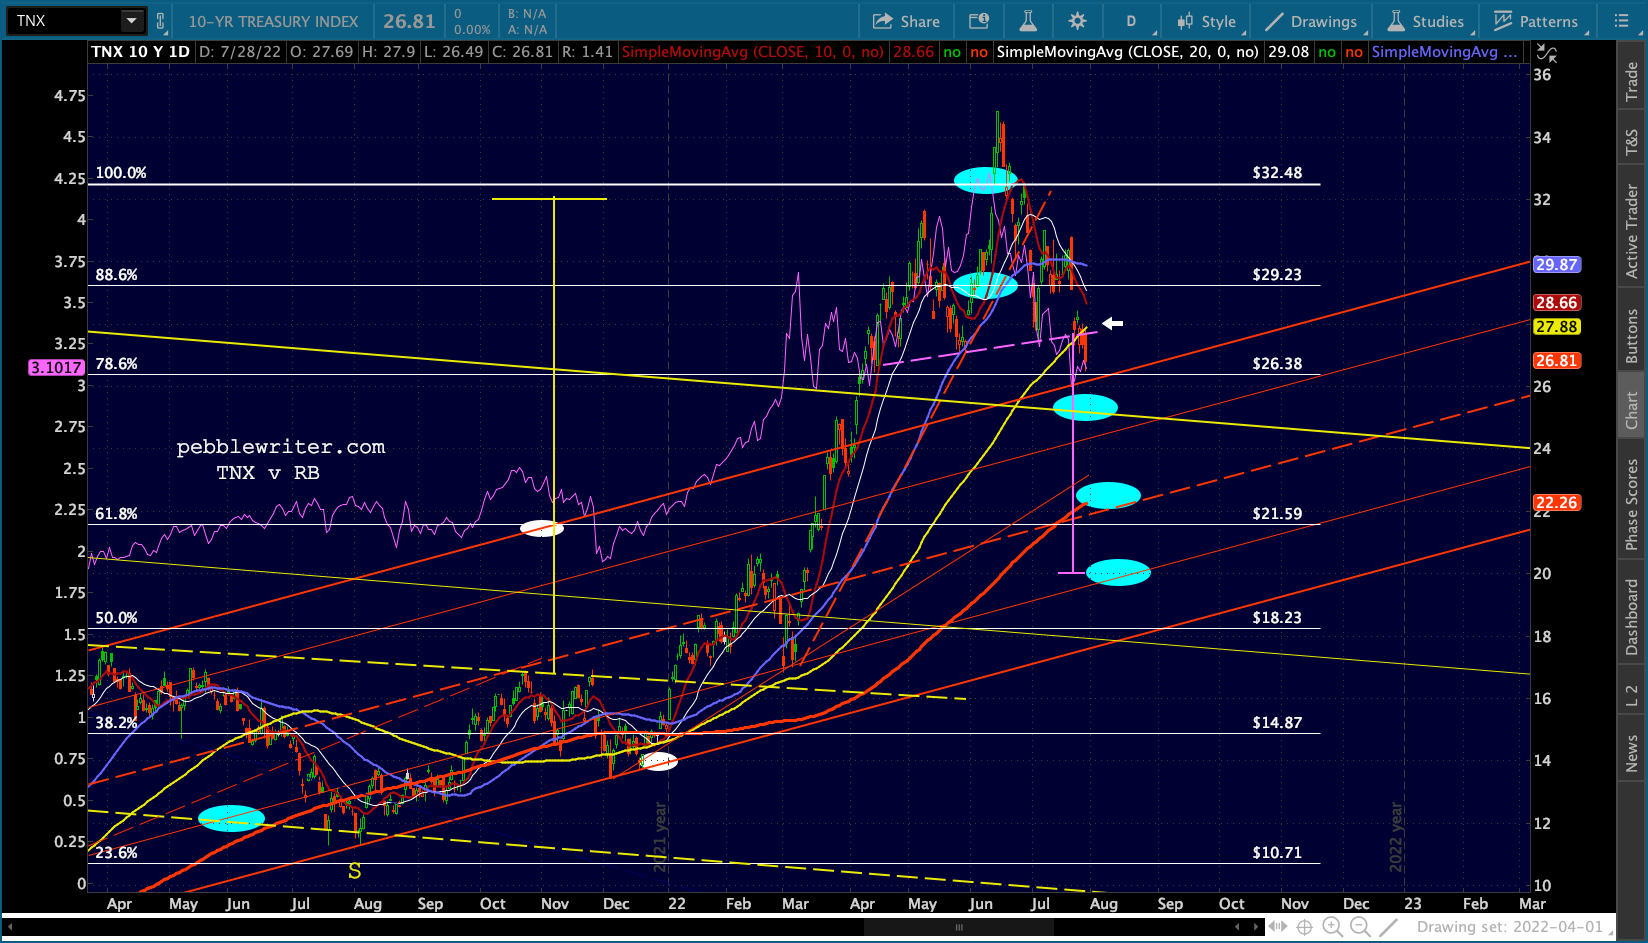
 …which promises even lower yields on the 10Y – at least to the channel backtest target. If that doesn’t hold and the H&S Pattern plays out, then stocks are in real trouble.
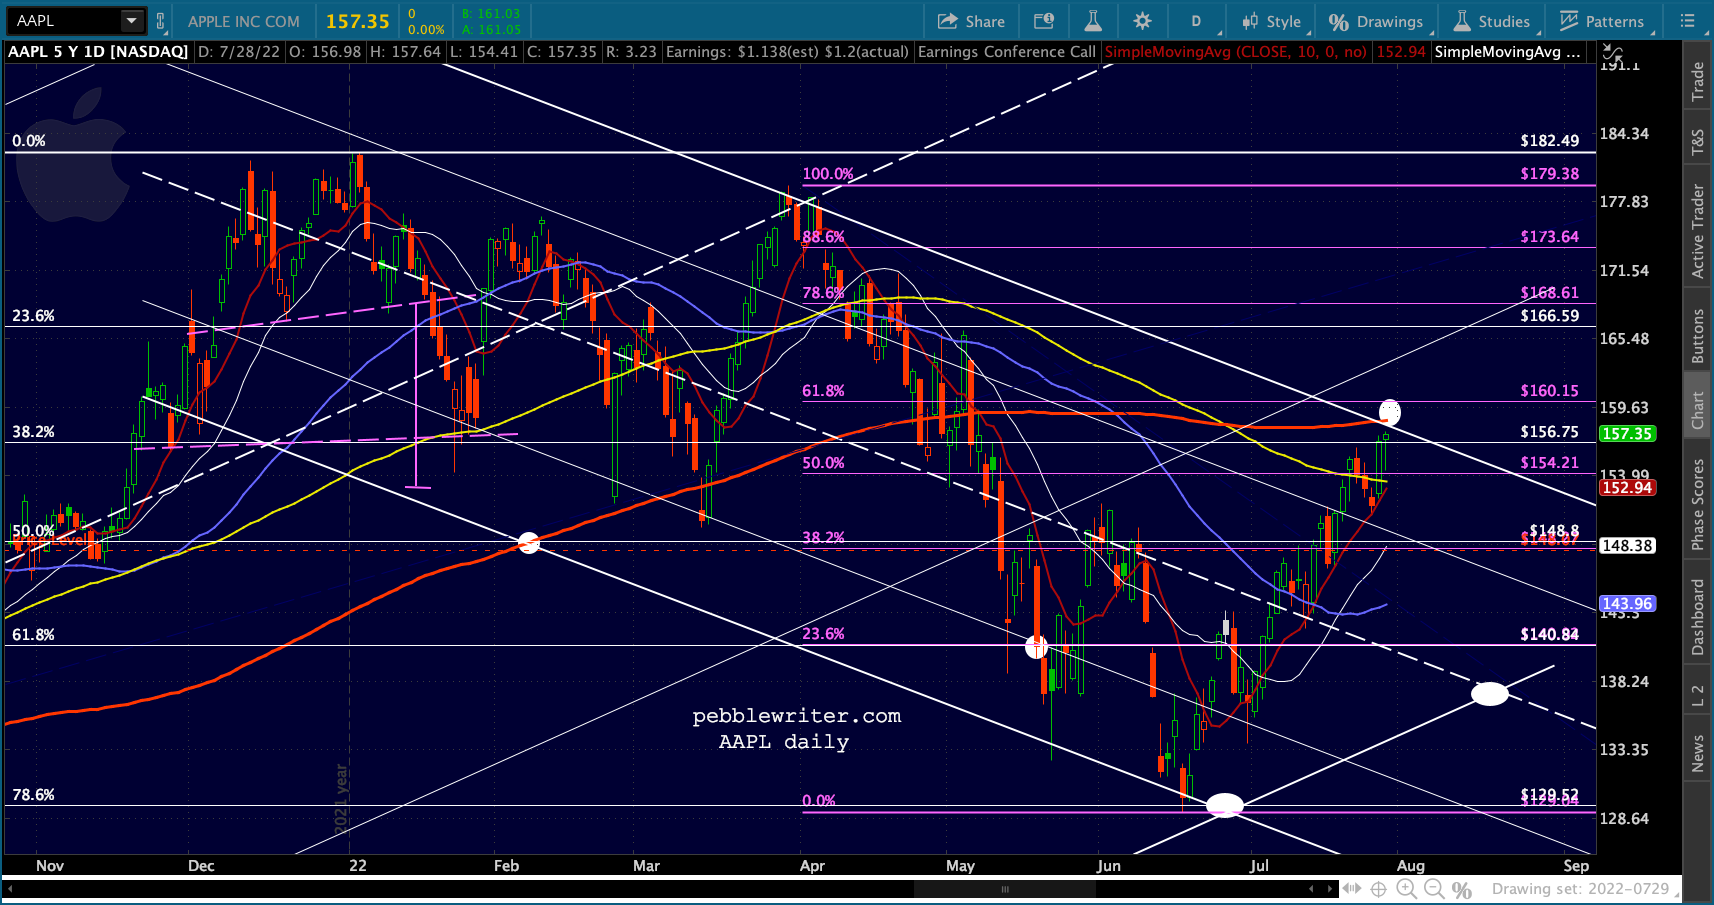
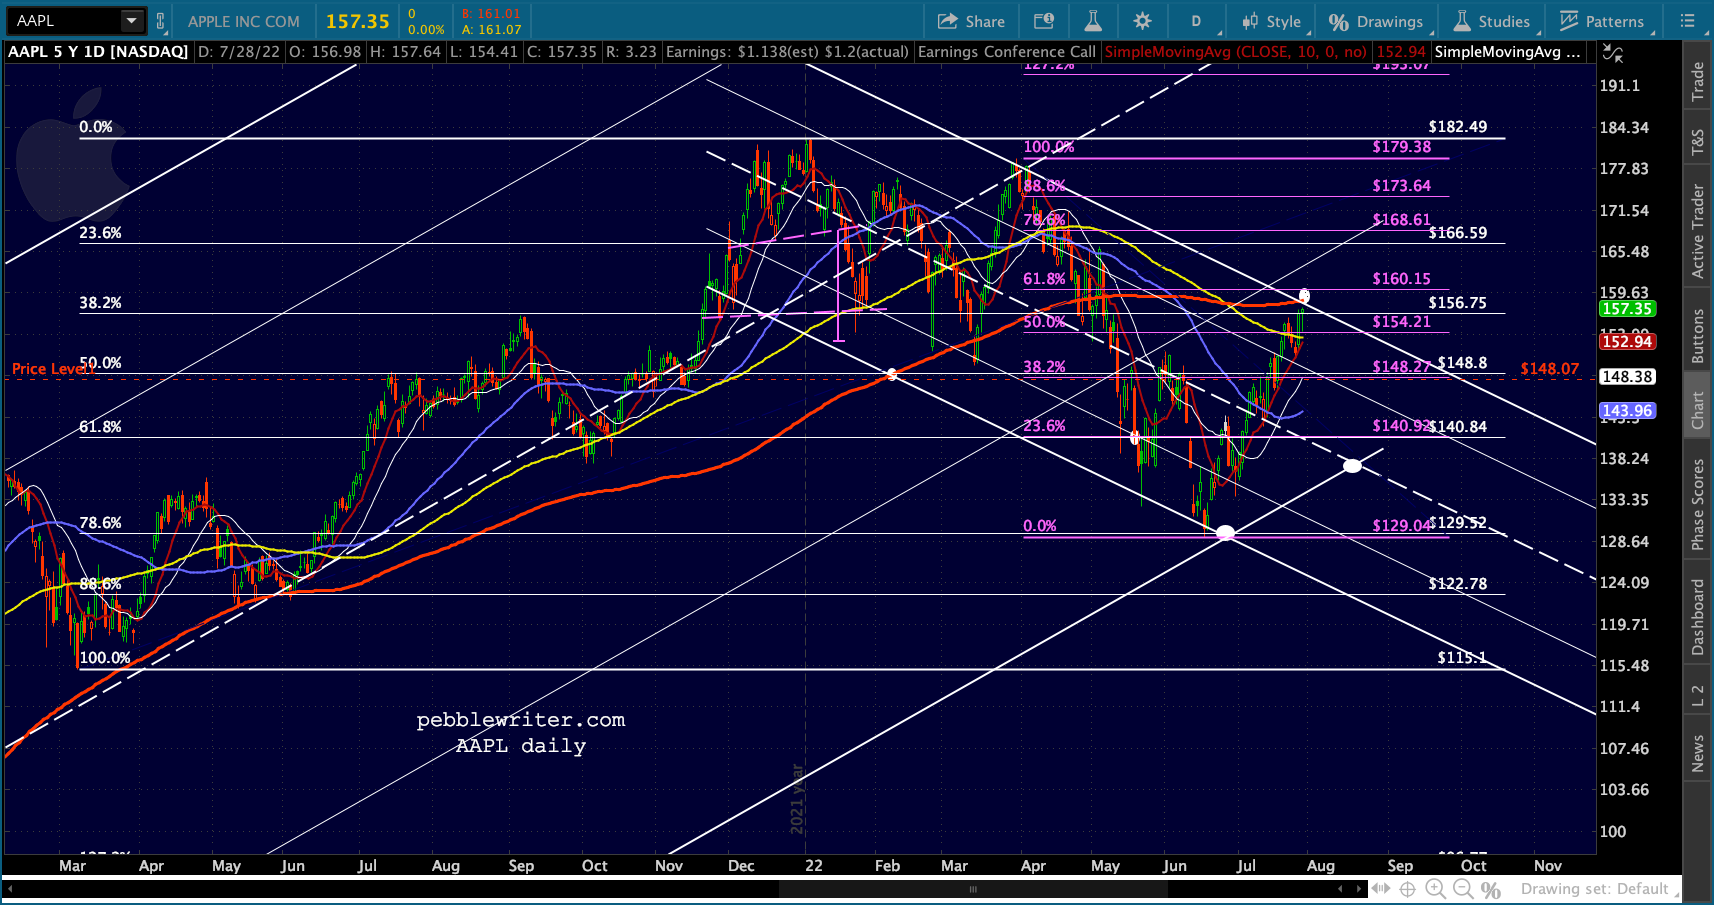
 For those watching AAPL, you know that it faces an important test at its SMA200 and .618. If it reverses strongly at 158.56-160.15, the overall market could really take a hit.
GLTA.