Posts

  • What Gives? Feb 13, 2013

    It was worth watching the SOTU last night just to see Boehner’s contortions, trying to scowl in a dignified, statesman-like way.  Nothing much new in the speech or the response.

    More interesting was Mitch McConnell’s comment on CNBC last night that the sequester will go into effect. I don’t know any reputable economist who believes we can go through sequester without a sizable hit to GDP.

    But, the market is ignoring the tenuous economic situation and continues to edge higher.  What gives?  Aside from the $85 billion mainlining into the banks every month courtesy of the Fed, that is…

    Zerohedge ran a BofAML study last night that pretty much says it all.  The market is currently reflecting bullish sentiment that’s higher than almost any time since 2002.  I imagine it’s even a little higher this morning.

    Most past ventures into this sentiment range have not ended well for the markets – especially when there is a huge divergence between soaring markets and faltering economic backdrops, as the charts below show.

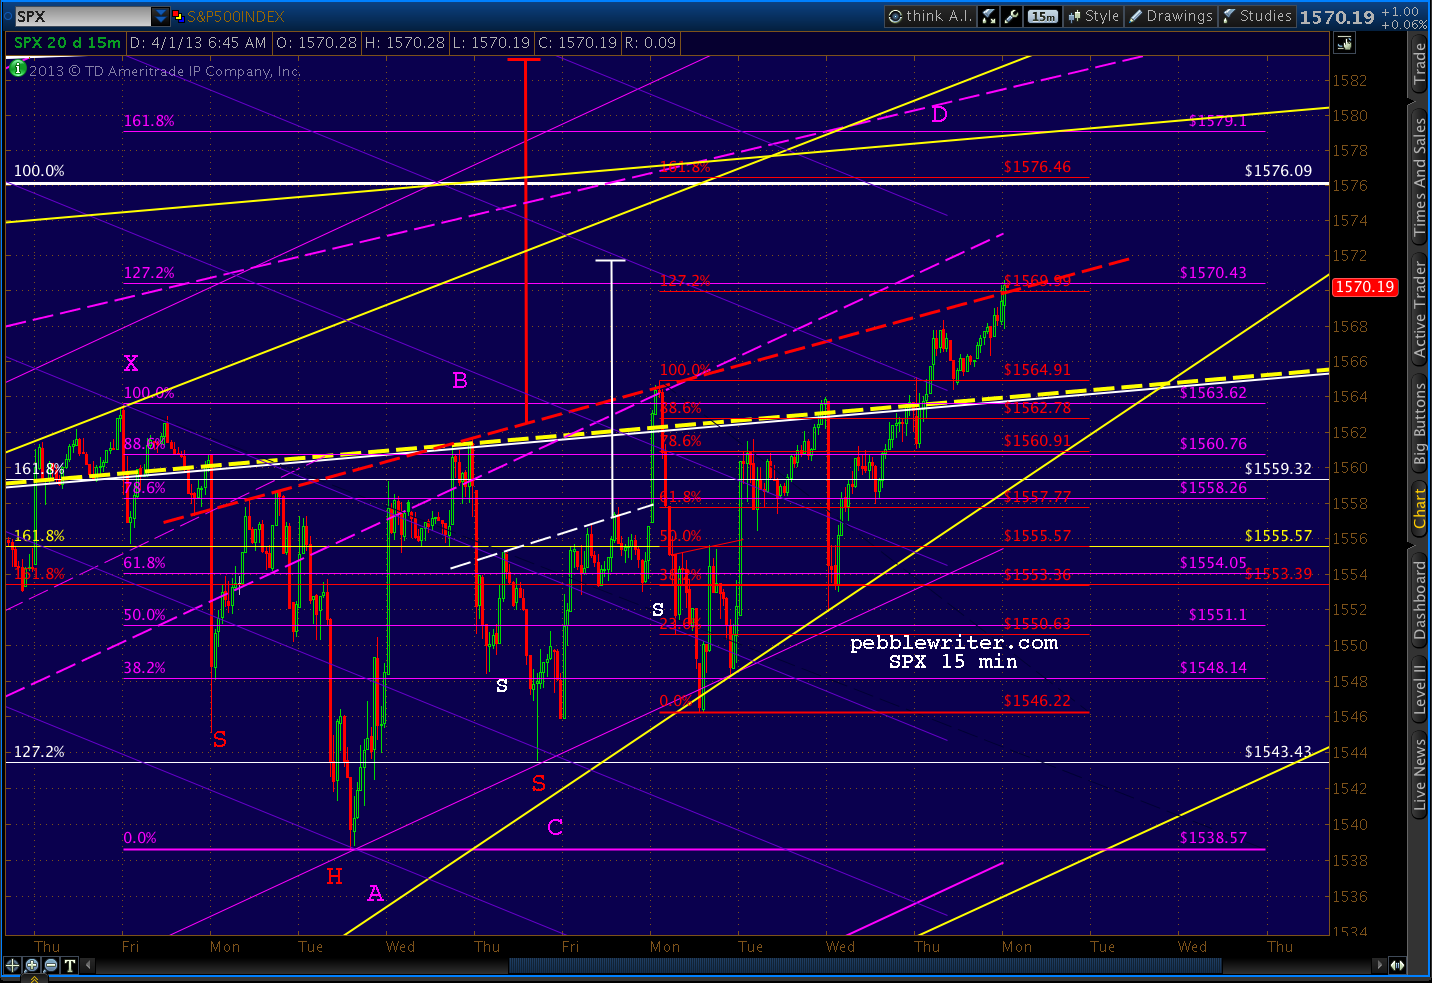
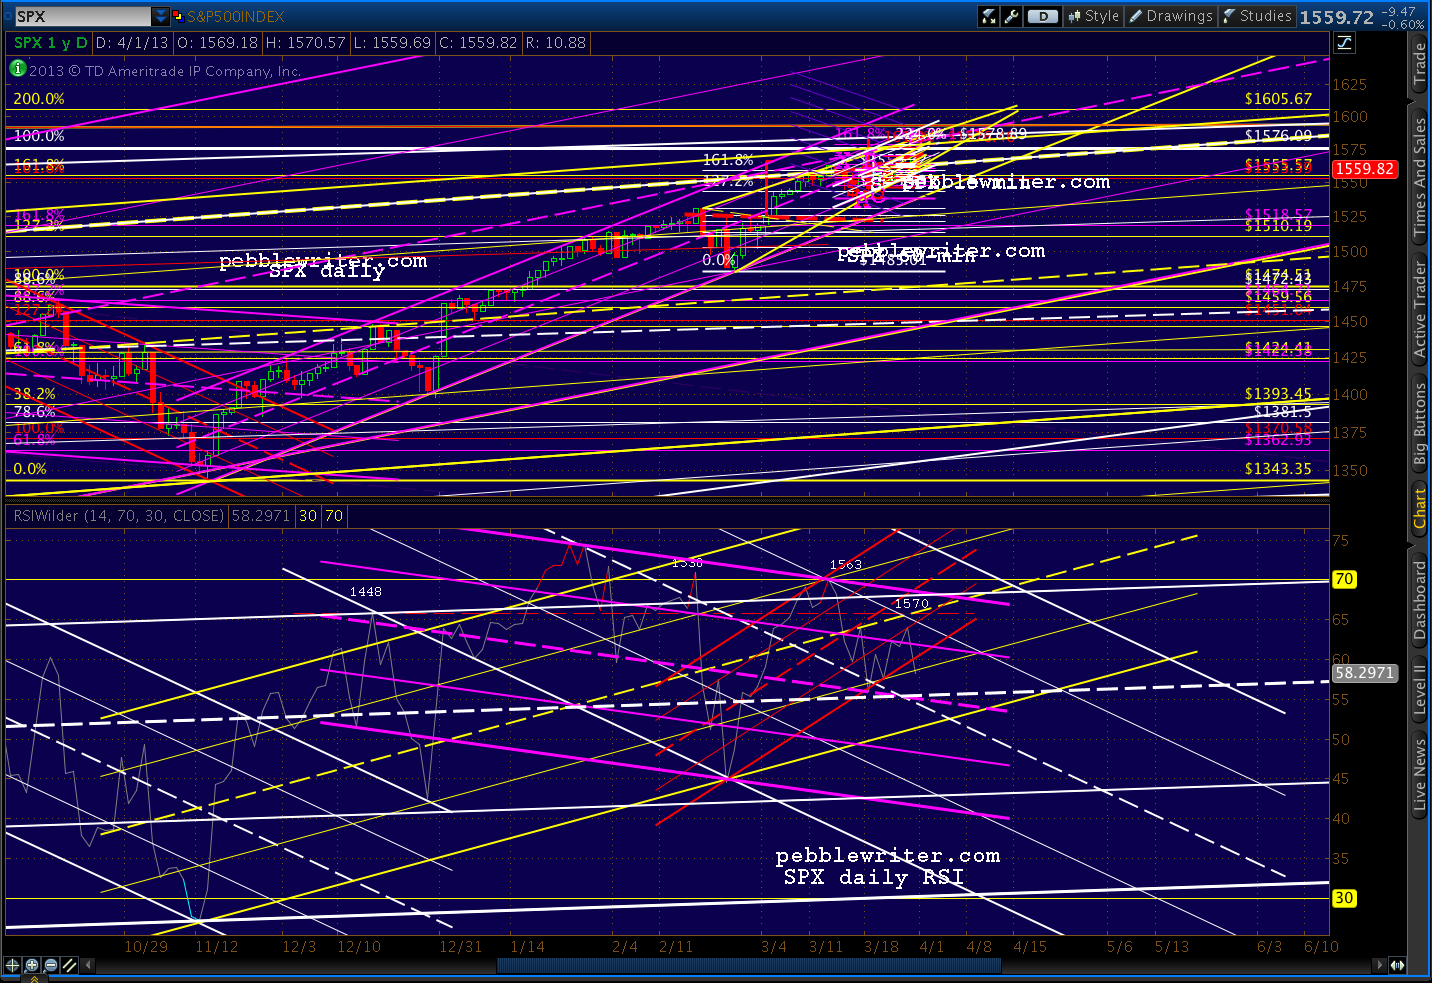
    Notably, the market is ramping these past few days on negative divergence in every single time frame – from weekly on down to 5-minutes.  And, it has completed some very significant harmonic patterns at the very top of a massive ending diagonal/rising wedge that’s precisely aligned with several previous tops (Jul 2011, Apr 2012, Sep 2012.)

    SPX surpassed our IHS target of 1522.60 from yesterday.  I’m closing out longs here at 1524 and will play the downside.

    UPDATE:  3:15 PM

    Getting a nice little push to the downside here — now 7 points off the daily high.  The white channel line that had been providing support is now providing resistance at around 1518.60 (the purple Crab’s 1.618 Fib is 1518.57.)

    SPX just completed a little H&S pattern that targets about 1510.80.

    Stay tuned…


  • Financials: End of the Line, Again?

    Financials have had a great run ever since we called the June 4, 2012 bottom [see: So Crazy, It Just Might Work].  But, all good things must come to an end.  I’d give them another few days/points at most.

    I had jumped on the short side Mar 27, 2012 [see: End of the Line and Lots More], riding GS, MS and JPM down around 30%.

    JPM:       46 – 32 = 31%
    GS:       127 – 92 = 28%
    MS:    20 – 12.50 = 38%

    On June 5, we loaded up on the long side.  Our targets, as posted that day:

    JPM:  today’s close = 31.99, price target = 38.69 (+21%)
    C:       today’s close = 25.75; price target = 34.79 (+35%)
    BAC:    today’s close = 7.10; price target = 11.34 (+60%)

    Obviously, those targets proved to be a little conservative.  JPM reached its target by Aug 21, consolidated for 2 weeks, then zoomed even higher – reaching 49.31 today and finally (after 4 near misses) reaching the .886 retracement of its 53 to 14 plunge.

    C reached its 34.79 target on QE3 day (Sep 14 — lovely being able to dump all those crappy MBS on the Fed) backed off a few points, then proceeded to rally up to today’s high of 44.50.

    It only ever recovered 7.95% of its 2007-2009 plunge from 570 to 9.70 (adjusted for reverse splits) and is struggling to reach the .786 of its swan dive from Jan to Oct 2011: 51.50 to 21.4. If the .786 at 45.06 doesn’t do the trick, the .886 at 48.07 should.

    And, just today BAC came within a nickel of the 50% retracement (12.39) of its post-2009 high.  It reached our 11.34 target in mid-December.

    If it gets past 12.67, it could still take a run at 14.13.  But, it won’t be easy.

    Most of the financials are in a similar situation — at or near major resistance either from Harmonic or Chart Pattern targets.  But, it’s XLF itself that looks shakiest.

    Today, XLF reached an important channel line as it tagged the 1.618 of the Mar-June 2012 decline.

    If it sneaks up past current levels, the .382 retracement of the fall from 38.15 in 2007 is waiting at 18.21.

  • AAPL: Breaking Out?

    AAPL has bounced nearly 50 points since its Jan 25 low, leading many to wonder whether the worst is over.  When I started this post about a week ago, all the talking heads were talking “breakout.”  We’ll give the old crystal ball a polish and see whether that’s likely.

    When I posted that AAPL seemed to finding support back on the 24th, it was because of the long-term channel (in purple, below) that’s guided its upside since the year 2000 [see: That All You Got?] The top of it, by the way, is up around 1775.

    AAPL bottomed the next day at 435 (one point from our Nov 27 forecast), and obviously still hasn’t broken that channel.  The channel top, by the way, is currently up around 1880. [note: these long term charts are as of Feb 6.]

    As we’ve noted before, there are other long-term channels at play, too.  Note the white channel casts a rather bearish pall, while the yellow channel promises at least a bounce here.  So, which to believe?


    GETTING HERE

    We’ve been very fortunate in forecasting AAPL over the past several months, calling several significant tops and bottoms with decent accuracy.

    Nov 8:  Harmonics Are Your Friend:  

    It looked like AAPL was about to bottom out, followed by a sizable bounce.

    “AAPL should get a brief bump higher as SPX does — perhaps to 600 or 620.  Of course, if it stalls there, it will have formed 5/6 of a huge H&S pattern… “

    It bottomed 6 sessions later when the S&P 500 dropped down to tag our 1344 target  [see: Charts I’m Watching Nov 15.]  From there, we were looking for a bounce to 600.

    Nov 27: Update on AAPL:

    As AAPL approached our 600 target, I anticipated a reversal and completion of a Head & Shoulder Pattern that would bounce first at the neckline before plunging below.

    “A reversal here could quite likely spell a return to the channel bottom — which will be around 434…

    …it’s easy to imagine a scenario where prices drop to [the neckline at] 500 into the end of the year, but can’t quite seal the deal on the H&S pattern…

    If, on the other hand, AAPL breaks down below [the neckline], look for a back test followed by a more serious plunge.”

    AAPL topped out two sessions later at 594 and plunged to the neckline at 501 where it failed to “seal the deal,”  bouncing for two weeks before finally falling below the neckline on Jan 15.

    It back-tested the neckline for a week before taking a “more serious plunge” down to 435, one point from our original Nov 27 target.

    GOING FORWARD

    The purple channel has done its job so far.  The big question is whether it can continue to stave off the damage of the completed Head & Shoulder Pattern.  H&S Patterns commonly back test their necklines.  Back tests can even exceed the neckline, as has AAPL’s in several cases.

    As we’ve discussed many times, AAPL has been in a fairly tight price channel all the way down from 705 (below, in white.)

    The upper bound of this channel intersects with the H&S neckline at about 498-500 around Feb 19 (there is some wiggle room, depending on exactly how the channel is drawn.)  This likely represents the extent of any short-term upside.

    As for the downside, the white channel midline intersects with the purple channel at about 450-452 around Feb 20.  The white upper bound intersects with the purple channel bottom  465 on Mar 18.

    But, note the large red falling channel.  It’s dicey to consider it well-established, since the “top” consists of only one tag.  But, it looks to me like it has potential over the medium-term.  Today, AAPL is testing its 25% line; and, a close above 473 or so would be positive — arguing for the more bullish of the two scenarios above.

    The daily RSI recently poked up through the white midline and the yellow 75% line, but appears to be backtesting both.  This would be consistent with a dip to 450, where AAPL could back-test the white price channel midline and the purple channel bottom (the purple circle).

    From there, the top of the yellow RSI channel beckons — which probably corresponds with a return to test the neckline around 500.  As noted above, this could occur as soon as Feb 19 if prices are to remain in the white channel.

    And, what if prices break out of the white channel?  Keep an eye on the RSI.  A break above the neckline would probably require a break out from the yellow RSI channel.  While, remaining in the yellow channel probably means a period of consolidation until early May, when the purple channel and neckline intersect at about 490.

    One other issue often discussed is the expiration of the 30-day wash sale period.  The biggest volume spikes in the past few months were the plunges of Nov 16, Dec 6, Dec 14 and Jan 24-25.  So, the only remaining relevant buyers who might rush back in are those who sold in the 435-465 range on Jan 24-25.

    Since the stock has gained a few points since then, these sellers might be expected to believe the worst is over and that it’s safe to re-enter at these levels — especially since the rest of the market is setting new highs.

    SUMMARY

    My best guess at this point is a test of the purple channel bottom around 450-455.  If it bounces, it has potential to the white channel top around 495.

    But, it’s important to note that AAPL just closed a huge gap.

    60-min RSI shows support coming up from a channel midline (white) as well as a rising channel bottom (purple.)

    If the channel bottom breaks down, the H&S target is way down around 304 — only a short hop from the yellow .618 at 317 and the white .786 at 307.

    GLTA.

  • Because We Said So (wait, what’d we say?)

    Just as we were getting a tad nervous about simmering currency wars, the G-7 announces there are no wars — everything is fine.

    Then, a G-7 official announces that everything is fine except for the Japanese — who are obviously sort of fighting a little war (see Brainard’s endorsement of same…)

    From Reuters about 30 minutes ago:

    But, really, everything is fine…except that by now the markets don’t know which way is up anymore.  Hopefully by the time the pub crawl lands in Moscow, they’ll have their story straight.

    The USDJPY, which had fallen to its channel midline following the Japanese Finance Minister’s comments that the yen’s fall had, perhaps, been a touch more than anticipated, rose on Brainard’s comments, fell on the first G-7 statement, and rose on the second.

    The pair remains in our target area, but I wouldn’t put any money on it staying there – or anywhere for that matter.  With the press releases flying, who knows where it’ll land when the music stops?

    The EURUSD is suffering from it’s own case of vertigo. In a now familiar refrain, the Germans and most northern EZ countries are just fine with the euro’s strength, while the more fragile economies of France, Italy, Spain, Portugal, Greece, etc. are taking it on the chin.

    The equity markets have been all over the map, albeit in a tight range the past week. SPX is testing 1518 for the 6th time in less than three sessions.

    Apparently, the market can’t accept our assertion that it’s time to sell off.  I don’t know why… Goldman did.

    Speaking of Goldman, Apple CEO Tim Cook is speaking this morning at their Tech Conference.  Apple will offer a live audio feed HERE.

    As discussed yesterday, I’ll add an intra-day long to cover any push above 1518.57 — which might be expected after the little IH&S pattern on the 5-min chart.

    continued for members(more…)

  • Charts I’m Watching: Feb 11, 2013

    It was a beautiful weekend here on the central California coast.  Seems like everyone was out surfing, golfing, taking walks on the beach — at least that’s what I heard.  I spent the weekend poring over ECRI’s Weekly Leading Indicators for the past 30 years.

    Okay, in the interest of fair disclosure, Friday night was the annual Father-Daughter dance at my 10-year-old’s elementary, and I needed a couple quiet days off my feet.  If you’ve ever been in a room full of screaming prepubescent girls for two hours of JB and 1D, you know what I mean.

    Bottom line, the WLI research bolstered my confidence that our current position is the right one — whether or not the US economy is still in a recession, about to double dip, or is on the mend.  The key takeaway is this chart, showing the QE-fueled market continuing to pull away from the underlying economy (as measured by the WLI.)  Check out the article HERE.

    This morning, I’m hearing more and more talk about the market being frothy.  This is somewhat reassuring, as shorting at tops based on Harmonics often leaves one feeling very lonely.  I mentioned that SPX 1518 was at least an interim top to several other dads at the dance (guys who are in the biz) and they looked at me like I’d had too much fruit punch.

    I could have talked for hours about how applying derivations of a golden ratio based on 2,400-year-old mathematics enables effective market timing, but for some reason they had a sudden urge to go find their daughters and dance.  Funny how that always happens, and just when I’m getting to the good part…

    Of course, frothiness is what leads to overbought conditions — which, of course, is what you want when you short the S&P 500.  So far, the market is behaving itself — selling off a little while trying to sort out economic data, quantitative easing, currency wars and the upcoming sequester battle.

    continued for members(more…)

  • Is It or Isn’t It a Recession?

    ECRI’s Weekly Leading Indicator (WLI) came out Friday at 130.2 — up from 129.6 the week before.  Further, they reported that the index’s annualized growth rate increased from 8.2 the previous week to 8.9% — the highest since May 2010.  I wondered: are they retracting their Sep 2011 recession forecast?  Are things really getting better?


    CAN’T WE ALL JUST GET ALONG?

    There’s currently an argument raging between various economists and analysts as to whether the US is still in/dipping back into a recession or is on the mend. ECRI is pretty sure we’re in one, while folks like Doug Short and, of course, the mainstream media think not.

    There’s no question that we’ve seen an uptick in several economic measures. My own thesis is that most of these have been not secular, but cyclical swings.  In other words, I don’t yet see evidence of a sustainable trend change, only natural swings from one side of a channel or wedge to the other.

    Here’s an example I posted last week. Total Confidence has traced out a pretty solid-looking channel, while the Present and Expectations indices have formed expanding wedges (and are nowhere near their upper bounds, especially given the recent downturns.)

    underlying chart from briefing.com


    Hardly a day goes by when I don’t second guess myself.  Is all the “good news” just one big, well-coordinated head fake or am I missing something?  I spent much of the weekend studying ECRI’s historical WLI (who says technical analysts don’t live exciting lives!?) and found a lot to think about.  First, a brief primer on Harmonics.


    HARMONICS

    Regular readers of pebblewriter.com (heck, even the irregular ones) know all about Harmonics and that the corrections experienced in April 2010, May 2011 and Sep 2012 correspond to the important Fib levels of 61.8%, 78.6% and 88.6%.

    For the uninitiated, measure the drop from SPX 1576 (Oct 2007) to 666 (Mar 2009) and multiply it by a Fibonacci 61.8% and you get 1228.74.  SPX reached 1219.80 in April 2010 (within 10 points) and promptly sold off by 17% over the next three months.

    In May 2011, SPX peaked about 10 points away from the 78.6% Fib level (completing a Gartley Pattern) and plunged 21.6%.  And, in September 2012, SPX reached the 88.6% Fib level (completing a Bat Pattern) and corrected by almost 9%.

    Those of us who follow Harmonics were well aware of each of these downturns well in advance [see: HERE, HERE and HERE] and profited nicely from the market’s plunges.  Those who rely solely on fundamentals or [involuntary shudder] the mainstream media…not so much.


    THINGS THAT MAKE YOU GO “COOL!”

    While I had noticed the WLI’s channel-like general decline before, I never noticed that it also complied with the rules of Harmonics.  From its all-time high of 143.73 in Jun 2007, the WLI plunged to a low of 105.40 in Mar 2009.

    Like SPX, it found its footing (thanks to QE1) and started higher.  Its first big pause was in Oct 2009 at the 61.8% Fib level.  It paused again in Jan 2010 near the 70.7% Fib, and eventually reached the 78.6% level in April — completing a Gartley Pattern as SPX had finally retraced 61.8% of its drop.

    One could infer from the mismatched Fib levels that the economy — as measured by ECRI’s leading indicators — was ahead of the market at this point. The WLI had retraced 78.6% of its drop, while SPX had only retraced 61.8%.  In any case, they both suffered from the removal of the QE drip – SPX shedding 17% and WLI 11%.

    When the Fed realized their patient would flatline without more QE, they were back with QE2.  The market took off, reaching the 78.6% Fib in May 2011.  This also completed a Crab Pattern, a 161.8% extension of the amount of the Apr-Jul 2010 slide.

    The WLI, however, retraced only 78.6% of its slide since its 2010 high.  In other words, the market was now officially ahead of the economy.

    Following the expiration of QE2, SPX plunged 21.6% to 1074 through October 2011, while WLI gave up 8.9%.  From there, SPX climbed to 1474 primarily on Fed jawboning and promise of more QE — which it finally delivered the day before the 1474 high.

    The timing was no doubt an effort to send the SPX soaring right through the 88.6% Fib retracement of the 1576 – 666 crash.  I seriously doubt that “two points over” was what they had in mind (the market sold off anyway, correcting a respectable 8.8% to 1343.)

    The WLI, in the meantime, topped out at 127.77 — only an 88.6% retracement of its decline from its previous high in 2011.  Again, the market was outpacing the economy.


    IS IT OR ISN’T IT?

    The world of market prognosticators is, as always, divided.  There are those who believe the economy is improving, and the market – as a leading indicator itself – is all the proof we need.  Then, there are those who believe the market is priced well in excess of levels justified by the underlying economy — which remains in or is dipping back into a recession.

    Whether QE has “saved” the economy or not, I don’t know of any respected economist or technician who doubts that it has significantly goosed (i.e. “manipulated”) the markets. And, we should pay attention to the disconnect between the markets and the economy as evidenced by the SPX/WLI comparison.

    The WLI just hit an important Fib level (88.6%) after demonstrating that it does, indeed, pay attention to such things.  This occurred at the same time that the S&P 500 hit several important Fib levels and is thus, by my reckoning at least, poised to correct [see: Satisfaction.]

    We all know the old truism “the market isn’t the economy.” However, another quarter of negative GDP following the tax hikes recently enacted and spending cuts in the works would certainly remind investors that the market and economy are, indeed, joined at the hip.

    I care about the economy because I have children.  The Fed’s unprecedented experiment in QE will quite possibly end very badly for the country, for my children and for yours.  But, there ain’t much We the People can do to influence Fed policy.  They don’t answer to us or our political “leaders.” So, we play the cards we’re dealt.

    As an investor, my goal is to capitalize on whatever the market throws at us — regardless of how manipulated it might be, and regardless of what economists call the current business cycle. If depression or hyper-inflation come along, we’ll hopefully see it coming and be well-positioned.

    Are we still in or dipping back into a recession? Will the current QE4-ever result in another 2009-2011 run, or does the market’s yawn last September signal the end of QE’s effectiveness?  We’ll find out in time.  In the meantime, we have some very good tools at our disposal that have provided excellent returns in a very difficult market.  I’ll continue to call it as I see it, and appreciate having you all along for the journey.

     *   *   *   *   *   *   *   *

  • Satisfaction

    Will the sixth try be the charm?  SPX has futzed around in our target area for six sessions in a row.  Today, we should finally get some satisfaction.

    The dollar has broken out of and is back-testing the yellow triangle. Lots of juicy Fib levels ahead, starting with the cluster at 80.758-80.883.

    RSI appears poised to break out of the red channel and explore the upper half of the white.

    While the EURUSD looks like it’s ready to tumble.  The test I’ll be watching closest is the intersection of channels around 1.3253.  But, merely popping back down below those falling white channel lines would be a great start.

    If I’m right, the falling white and/or yellow channels will take it from here.  Note the negative divergence represented by the last two spikes up to the top of the yellow channel.  The flatish red channel dates back to the fall of 2008, and every sustained push below its midline — currently around 50.51 — has been accompanied by a nice sell-off in EURUSD.

    Japanese finance minister Taro Aso is frantically searching for the “off switch” on the yen-cinerator.  In a chat with a legislative budget committee, he admitted: “it seems that the government’s policies have fueled expectations and the yen weakened more than we intended in the move to around 90 from 78.”

    The 7 sessions in (and slightly above) our target area are looking tenuous.  A dip to the bottom of the white channel could take the pair back to 90.82.

    And a fall from the white channel could easily see a back-test of the midline from the purple channel dating back to 2000.

    continued for members(more…)

  • Charts I’m Watching: Feb 7, 2013

    Nice little intra-day sell-off again yesterday, culminating in a last minute positive close — another shake-and-bake by your friendly neighborhood market makers to separate you from your hard-earned money. Look for more of the same today.

    Today’s news is all about currencies.  Draghi’s comments are successfully taking some of the bloom off euro’s today.  The euro is up 11% since Draghi’s “whatever it takes” speech last July 26.  What has it gained them?

    Oil got a little cheaper — at least through the end of the year.  Germany might not care, but  Spain, Italy and France exporters are feeling the pinch at a time when they can ill afford it.

    IMHO, this will set up a battle of political wills between the haves and have nots in the EZ.  Bucking the global trend and trying to achieve nominal growth without more accommodative monetary policy is doomed from the get-go.

    The EURUSD chart shows how the market feels this will ultimately be resolved.

    Though the pair will likely find support right about here — an important Fib line (red .618) and the intersection of two prominent channel lines.

    The top of the big falling white channel is still out there as an upside target.  Timing would determine price, of course, since the channel features a fairly steep slope.  But, the range currently includes the red .886 at 1.3995 (the top of the purple channel), the white .500 at 1.3956 and the purple .618 at 1.3832 (the purple midline.)


    SPX isn’t enjoying the plunge in the EURUSD.  I’m taking an intra-day short position with the channel line cross at 1508 with a target of 1497.29 – 1499.29 — the .886/.786 of the latest run up.  Charts in a few.

    60-min RSI shows likely downside to at least the red midline and white channel bottom.  This likely translates into the .886 at 1497.29, but the purple midline is way down at 1492, so I’ll give it some rope (and reconsider our upside target) if SPX dips below 1495.


    continued for members(more…)

  • Is it Soup Yet?

    The market’s selling off a bit this morning as the EURUSD tests its channel’s lower bound.

    And, the dollar takes a breather after a nice three day gain.

    The S&P has officially hit only one of the three Fib levels we targeted weeks ago, but came within .28 of the second yesterday after inching up past the previous 1514.41 high to 1514.96.

    While the whole steaming pile could go splat any second, there’s still a good chance of first bagging the 1518.57 Fib.  But, to get there, we’ll need several more ingredients:

    (1) one last bounce from EURUSD…

    (2) a meaningful reaction for DX off the white channel top and .382 Fib…

    (3) these gentlemen to find some work…

    (4) or these bums to get to work.

                                                                               Crisis averted / Lisa Benson, Washington Post Writers Group

    continuing

  • Charts I’m Watching: Feb 5, 2013

    The dollar is taking a breather after a strong reversal off the latest .886 and channel bottom, but appears ready to break out.

    The EURUSD back-tested the broken channel line and rising wedge lower bound, and is likely about done.

    SPX fell 19-pts after we shorted last Friday.  We positioned for an intra-day bounce, but SPX added only 4 points before falling back to complete a little H&S pattern at the close.

    continued for members(more…)