Posts

  • Charts I’m Watching: Apr 9, 2014

    USDJPY plunged to 101.54 yesterday — very close to our 101.50 target.  It bounced at the red .886 retracement, a legitimate spot.  So, we could be in for a bounce, or we could see another small wave down first.

    2014-04-09-USDJPY daily CU 0605Such a drop to the white target would, IMO, better flesh out the rising red channel — but, it’s already close enough that investors might consider the move done.  Interestingly, though, the bounce we’ve seen so far is having trouble rising back above the white channel midline.

    So, we’re left with a fight between rising channel bottoms (red, gray and white) and the falling white channel midline.

    2014-04-09-USDJPY daily 0605I’m keeping an eye on the Nikkei, as it’s back below channel support and appears likely to continue dropping to at least the H&S neckline.

    2014-04-09-NKD daily CU 0605ES is up 5 pts after bouncing, as expected, at the SMA50.  Ordinarily, I’d say the bounce should reach at least the broken white channel midline.  But, the USDJPY might keep a lid on things.  We’ll find out shortly.

    2014-04-09-ESM4 60 0605UPDATE:  9:50 AM

    The white midline held so far.  So, we’ll set our sights on a deeper retrace or a last wave lower for a more meaningful bounce.

    One caveat:  as we’ve discussed for months, the yen carry trade is huge.  If enough players rush the exits all at once, forget about all those channels holding.  It’s a long way down — for USDJPY and for equities.

    This is our medium-term thesis, and I suspect it to play out sooner rather than later.  In other words, a bounce is by no means assured.  It all boils down to how well TPTB can keep things under control.

    2014-04-09-USDJPY 5 min 0650ES is building a nice little flag pattern — and sputtering near the backtest of the rising white midline.

    2014-04-09-ESM4 60 0702UPDATE:  12:40 PM

    USDJPY just backtested the latest fib fan line at the .382.

    2014-04-09-USDJPY 5 min 0941The Fed minutes aren’t due out until 2pm EDT, so the pair has some time to kill.  ES is stuck right at the midline — about .382 of the drop from 1892.5 to 1830.75.

    My best guess is the market will react negatively — based on the fact that the initial reaction to the Fed statement [READ IT] back on Mar 19 was a 25-pt drop.  But, that drop was erased by a massive Plunge Protection Team effort, and a ramp job that carried into the following morning when the press trumpeted a bevy of mixed (at best) economic news.

    Here’s an updated forecast. (continued for members) (more…)

  • Charts I’m Watching: Apr 8, 2014

    Screen Shot 2014-04-08 at 6.16.05 AM Seemingly everyone has assumed that the BOJ would step back in and ramp up their QQE and asset purchases.  The consensus was for a doubling of ETF purchases.  Yet, as we’ve discussed many times [see: Sayonara Abenomics], the BOJ is between an inflationary rock and and debt hard place.  Last night’s decision to hold the course — music to bears’ ears — has disappointed a great many investors who were counting on the music never stopping.

    Our major thesis since late December [see: Update on NKD & JPY] has been that a stronger yen would do some real damage to equities.  Now that it’s happening, the question becomes “how far?”

    2014-04-08-USDJPY 4hr 0600I have been unable to quantify the size of the yen carry trade, but my sense is it’s much greater in size than existed in the previous unwindings of 1998, 2002 and 2007.  Margin debt is as great as it’s ever been; and, stocks are priced at the same high multiples.

    2014-04-08-USDJPY v SPX 0600

    One thing for sure: the bulls won’t just roll over.  If this sell-off gets serious enough, we can expect a lot of jaw-boning from the usual suspects.  And, if that doesn’t work, the Fed can always taper the taper (to, you know, “reduce unemployment.”)

    But, we’ll likely see more downside first.  Keep an eye on the targets we discussed yesterday.  The first — the SMA50 at SPX 1840/ES 1831 — should arrive shortly after this morning’s open.  continued for members… (more…)

  • Charts I’m Watching: Apr 7, 2014

    The panic felt on Friday over a 1.3% drop was surprising, given that the markets were still up on the week.  What will investors do when they face a real plunge of 5-10% or more?  On Apr 14, 2000, SPX dropped 100 points in a day — a drop to get excited about!

    While things started out pretty well, by the end of the Friday’s session the drop felt tired and back in control — if it was ever out of control.  USDJPY fell to the .382 retrace of its last rise, fleshing out a rising channel bottom.

    2014-04-07-USDJPY 4hr 0609

    ES busted the crazy-steep purple channel, but never broke the rising white channel midline until last night — only to bounce back.

    2014-04-07-ESM4 daily 0623SPX found support at the latest .618 — near the purple midline and a channel bottom — but will probably benefit from a slightly lower bounce.

    2014-04-07-SPX 15 0615Bottom line — I’m certainly not turning bullish, but the potential for a bounce here shouldn’t be ignored.  Keep an eye on the yen — the driver of the whole mess.  If it can hold 102.98, we should be off to the races.

    UPDATE:  1:55 PM

    102.98 has held so far, even as SPX/ES managed to put in another lower leg as expected.  Aside from the highly leveraged go-go names that are over-represented in the hedge fund world, this decline still feels rather “managed.”

    I’ll take a stab at some downside targets.     continued for members… (more…)

  • Charts I’m Watching: Apr 4, 2014

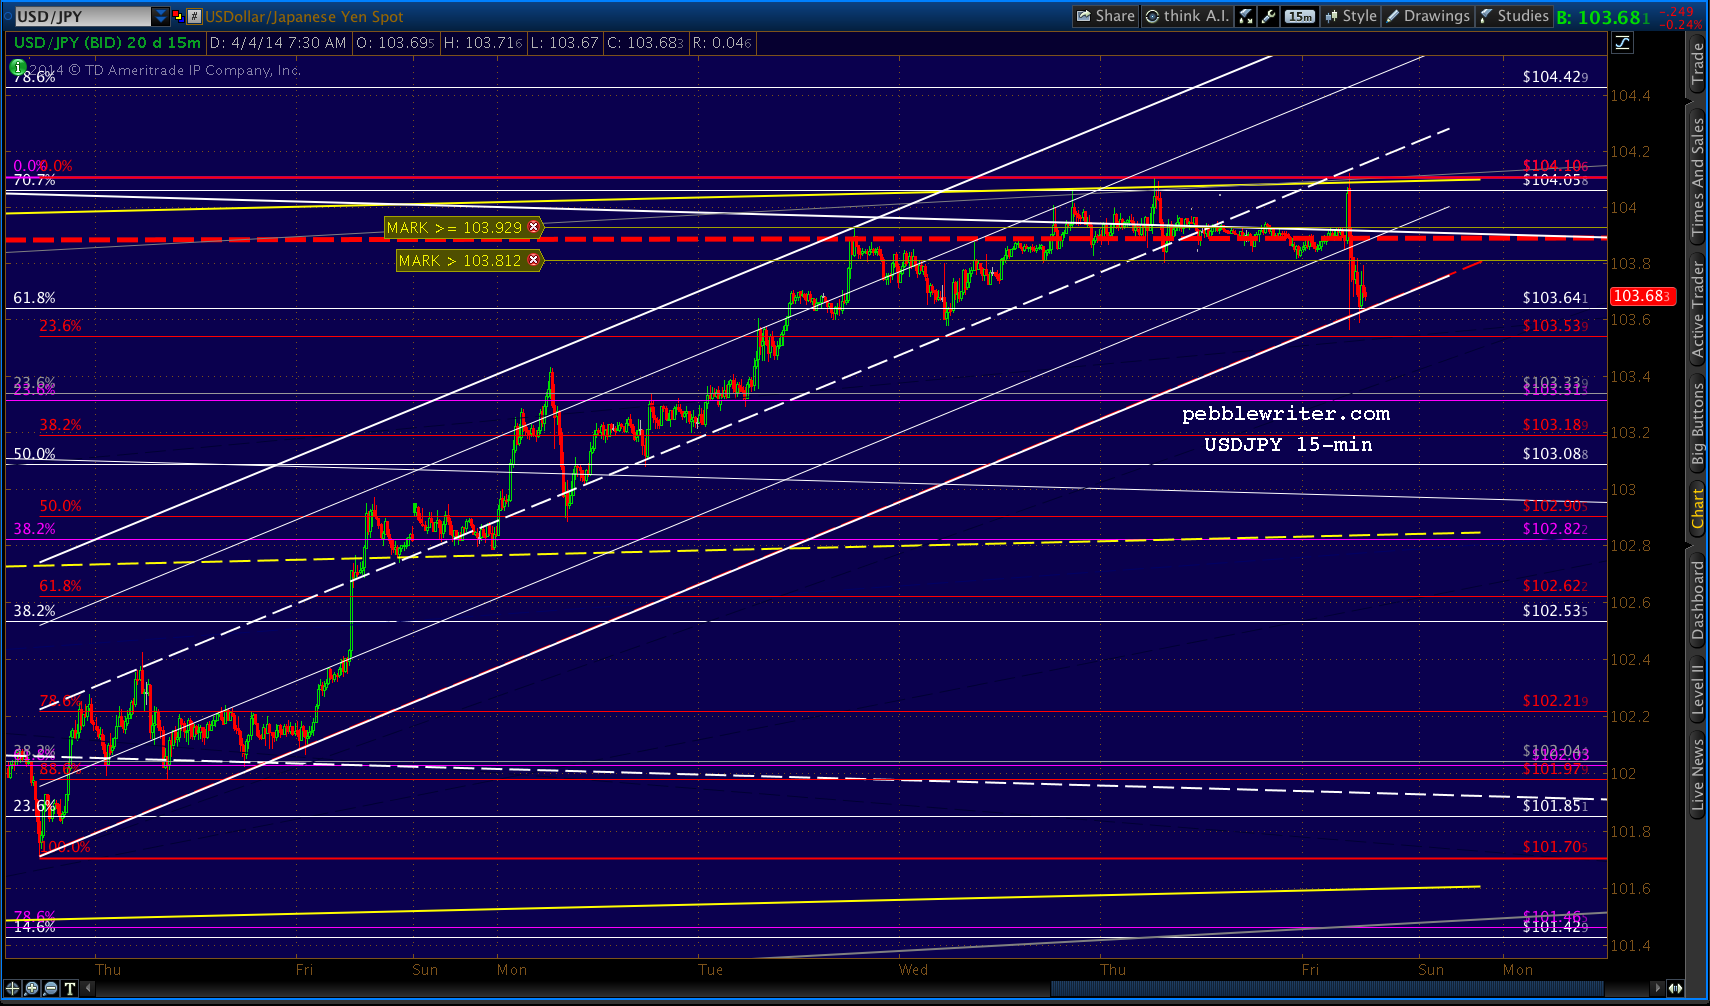
    Lots of action in the USDJPY in response to the employment report.  This is a 1-minute chart:

    2014-04-02-USDJPY 1min 0541DX initially dropped from 80.73 to 80.55, only to be bid aggressively (thanks, Haruhiko!)

    2014-04-02-DX 1-min

    I continue to expect it to benefit from a falling euro but get dinged by a rising yen — in other words, more see-sawing between 80-84.

    2014-04-02-DX weekly 0624 I expect the BOJ won’t take any additional easing measures in the their first April meeting next week, even though the damage from the increased sales tax will have already begun.  This should rattle a few carry-traders.

    The daily chart shows the five day spurt sputtering yesterday, having difficulty topping the TL from 1999 that it first backtested on Mar 7 [but, popped above following Yellen’s testimony on Dec 18; like the 10-yr, it’s looking like a ramp job that lost its footing.]

    2014-04-02-USDJPY daily 0550The BOJ has their hands full.  Unlike the Fed, which bristles at the suggestion that it’s propping up equity markets, buying equities outright is part of the BOJ’s master plan.  They arm-wrestled the Nikkei back into the broken channel from 2011, but just ran into the falling purple channel top and the .886 Fib (white.)

    No help from the Fed today, as it’s one of only 4 days without POMO (also April 17, 18, 30) left in the month.  But, the ramp is already in.   SPX will be looking to bag 1900 today.

    Lest anyone look at this as a “healthy” market, the trend of all the market’s gains coming in the after hours continues [see: Are Bears Doomed?]  In the past week, 62 points of the e-minis 48-pt net gain have come overnight.

    2014-04-02-ES 30 min rampsUPDATE:  10:34 AM

    If this channel breaks on USDJPY…

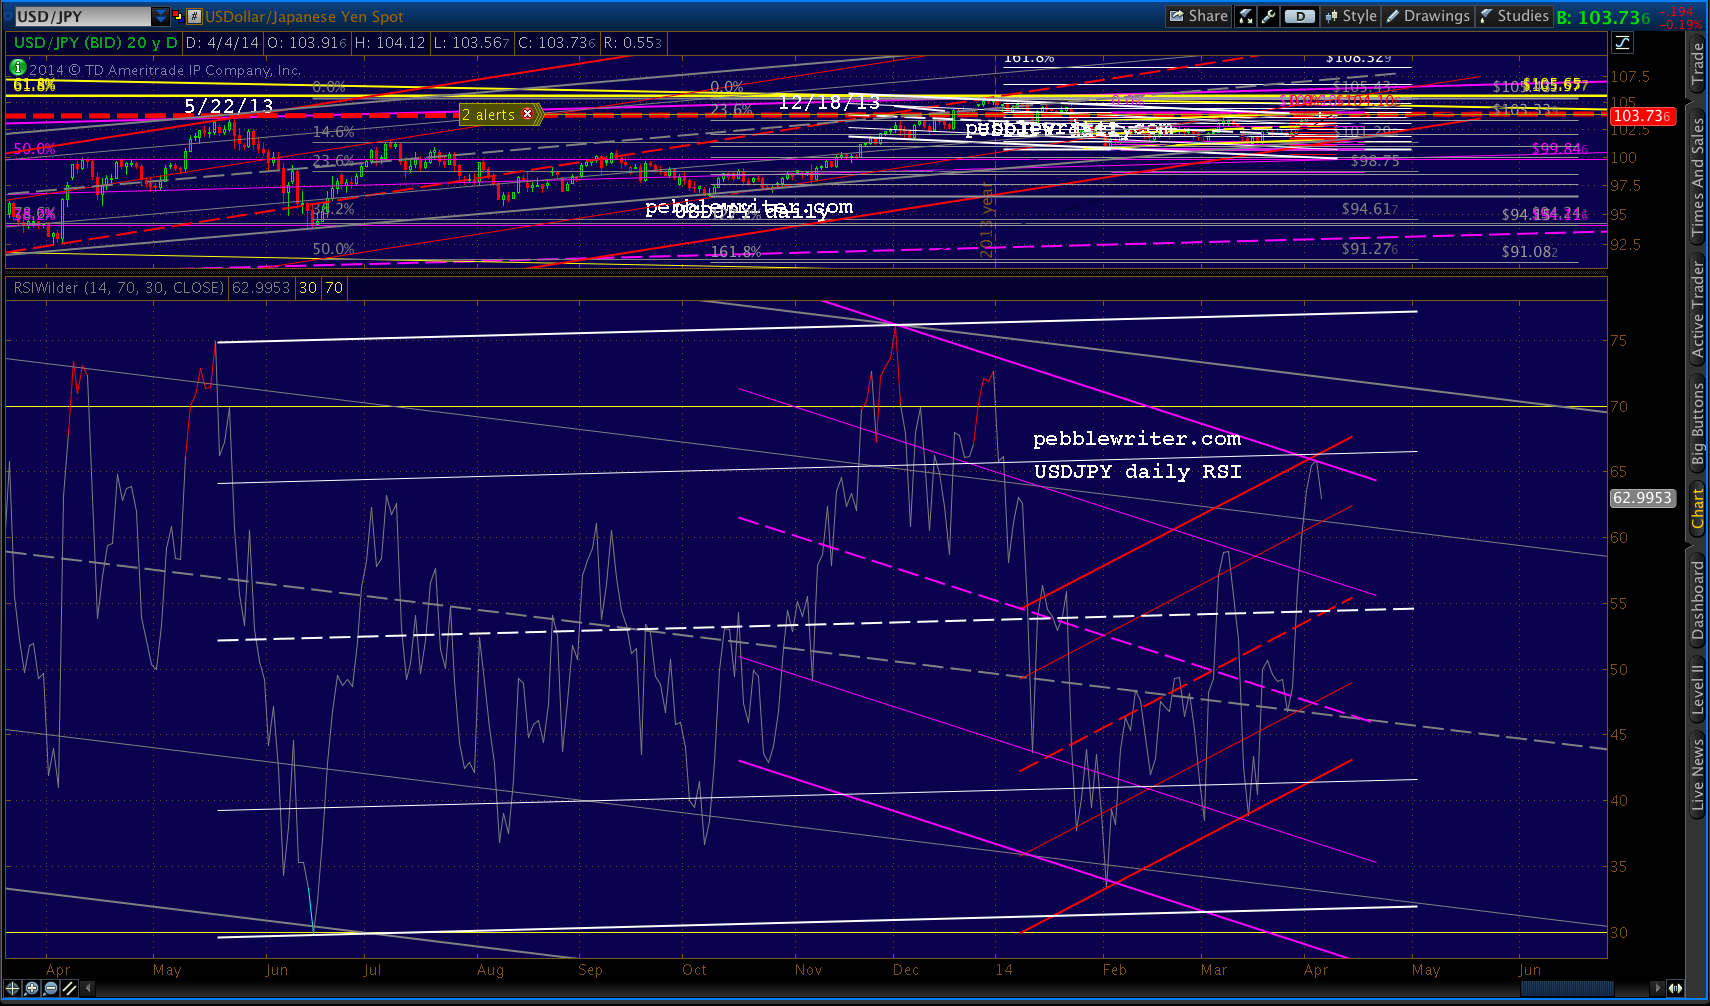
    2014-04-02-USDJPY 15 0730…the daily RSI suggests at least another leg down.

    2014-04-02-USDJPY daily RSIBut, as we discussed yesterday, a lot of damage has already been done to the bears’ case.  Remember that well-formed H&S Pattern?  Toast.

    2014-04-02-SPX 60 min 0741UPDATE:  2:35 PM

    Getting close to a good bounce spot here at 1856-1858.

    2014-04-02-ES 5 min 1135UPDATE:  2:50 PM

    Logical place for a bounce here at the purple .618…

    2014-04-02-ES 5 min 1150…especially since USDJPY just tagged a .382.  It’ll be interesting to see whether or not USDJPY tries to retake that channel.

    2014-04-02-USJPY 15 1155If the Fib levels don’t hold, the white channel midline on ES is around 1850ish.

  • Charts I’m Watching: Apr 3, 2014

    Crummy initial claims, crummy trade data and no stimulus from the ECB — so naturally the futures are up.

    2014-04-02-ESM4 daily 0620The USDJPY has pushed above the TL from ’99, though it remains to be seen whether it can remain above beyond intraday.  The .786 at 104.42 has come into the rising white channel, and thus is a possible intraday target.

    2014-04-02-USDJPY 60-min 0635UPDATE:  10:25 AM

    Despite the lack of stimulus, EURUSD just made a lower low and appears to be closing in on the 1.36 level.

    2014-04-02-EURUSD 60-min 0727USDJPY reversed off the white .707 and yellow channel top and is back below the red TL.  ES should follow suit.2014-04-02-USDJPY 60-min 0727UPDATE:  12:40 PM

    Channel and Fib support here at ES 1877.50.

    2014-04-02-SPX 15min 0943The midline of the rising purple channel is around 1900 at the end of the session — a tempting target for the bulls.

    But, watch out around USDJPY 104 — the .618 of this morning’s drop and the midline of the rising white channel (already broken, this is a back-test.)  Should USDJPY run out of steam here, it opens up the C wave to 103.57-63 to test the bottom of the white channel.  ES wouldn’t react well.

    2014-04-02-USDJPY 60 1014


  • Charts I’m Watching: Apr 2, 2014

    ES seems intent on reaching the higher Fib levels around 1903-1909, with yesterday’s Fed induced ramp largely responsible for the push above the yellow 1.272.

    2014-04-02-ES daily 0625But, keep an eye on the analog we discussed yesterday.

    USDJPY had a correspondingly strong move which topped the Mar 7 high, but failed to clear the TL from 1999 (red, dashed.)

    2014-04-02-USDJPY daily 0648This TL has been very important in the past, providing support in 1999 and 2004, and resistance in May 2013.

    2014-04-02-USDJPY v SPX daily 0648It was busted on Dec 18 when Janet Yellen confirmed tapering was, indeed, going forward  — and TPTB threw everything they had at the markets to demonstrate how this was a “good” thing.

    We had a month or so of prices above the line, but they fell back below in late January and — despite back-testing it twice — have, as yet, failed to retake it.

    2014-04-02-USDJPY v SPX daily 0700This is the exact same phenomenon we saw in TNX.

    2014-04-02-TNX v SPX daily 0700

    Yields popped up above the yellow dashed TL on Dec 18, fell back below on Jan 10, and have remained below it ever since — despite three attempts at retaking it.

    2014-04-02-TNX v SPX daily CU 0700

  • Charts I’m Watching: Apr 1, 2014

    USDJPY looks like it will complete the Bat Pattern (red) with an .886 retrace of its post Mar 7 drop.

    2014-03-31-USDJPY daily 0640A pullback here (at 103.46) would coincide nicely with the Nikkei 225, which (yesterday) reached the .618 retrace of its drop from channel support.  It has been back-testing the channel for over two weeks.

    2014-03-31-NKD daily 06342014-03-31-NKD big daily 0640So, either ES will carry on without the yen carry trade support, or we’ll put in a 1-2, 1-2 Bat Pattern reversal at 1876.75ish.

    2014-03-31-ES 60-min 0654The 10-yr continues to cast doubt on the idea of new highs in equities.

    2014-03-31-TNX daily 0750The close-up:

    2014-03-31-TNX 60-min 0750We could be setting up for nominal new highs to trip stops and break the bearish technical patterns — similar to what happened on Mar 21 when SPX beat the previous Mar 7 high by 0.40 pts.

    From a technical standpoint, this won’t necessarily trash the harmonic or the yellow H&S Pattern.  A double-top is a legitimate retracement in harmonics.  And, the height of the right shoulder above the neckline relative to the head is technically more important than whether it tops the head in nominal price.

    updated: 11:30 EDT
    updated: 11:30 AM ET

    Yet, psychologically, the bulls will have made their point and busted the smaller, red H&S.  Whether prices break out or this is a muppet trap, much damage will have been done.

    UPDATE:  11:10 AM

    So, SPX made a new high, topping the Mar 21 level by 0.64 points.  While three new highs in the span of one month is impressive, I think it’s wise to remain cautious.  SPX had three new highs in the span of 11 sessions in Mar-Apr 2012.  It even featured a big-time overnight ramp job to push past the .786 at 1381.50.

    2014-03-31-SPX Mar-Apr 2012continued for members… (more…)

  • Charts I’m Watching: Mar 31, 2014

    It seems TPTB are determined to close in the green for Q1.  The futures got most of their ramp job at yesterday’s open, and have edged up slightly more in the early hours this morning.

    2014-03-31-ES 60 0615ES still shows a H&S Pattern (red) within the right shoulder of a larger H&S Pattern (yellow) and the channels we’ve been assuming for the past couple of weeks haven’t yet broken down — though each daily ramp job does its best.

    USDJPY pushed through the red .618, doing its part in the carry trade, and is closing in on the .886.  A push above 103.75 would bring the white .786 or .886 into focus.

    2014-03-31-USDJPY 4hr 0615As we’ve discussed extensively, the pair is moving higher on yen weakness due to: 1) open market manipulation (selling yen, buying USD) by the BOJ; and, 2) market participants’ assumption that continued weakness in the Japanese economy will necessitate additional easing.

    But, as we’ve also discussed, this isn’t a foregone conclusion.  The increased sales tax begins tomorrow, and the Japanese consumer is already being clobbered by much higher fuel and food prices — both imported.   Additional QQE will make imports more expensive, and spending (and, therefore, tax receipts) will be further impaired.  A cheaper yen will not solve Japan’s problems.

    UPDATE:  2:00 PM

    Thanks to the overnight ramp jobs and stick saves, SPX’s downturn has been delayed — meaning the correction can potentially be contained to a higher low.  The purple channel bottom is now up to 1780, indicating either a .707 retrace or (more likely) an initial drop to the white .618 (1793), followed by the .786 (1769.)

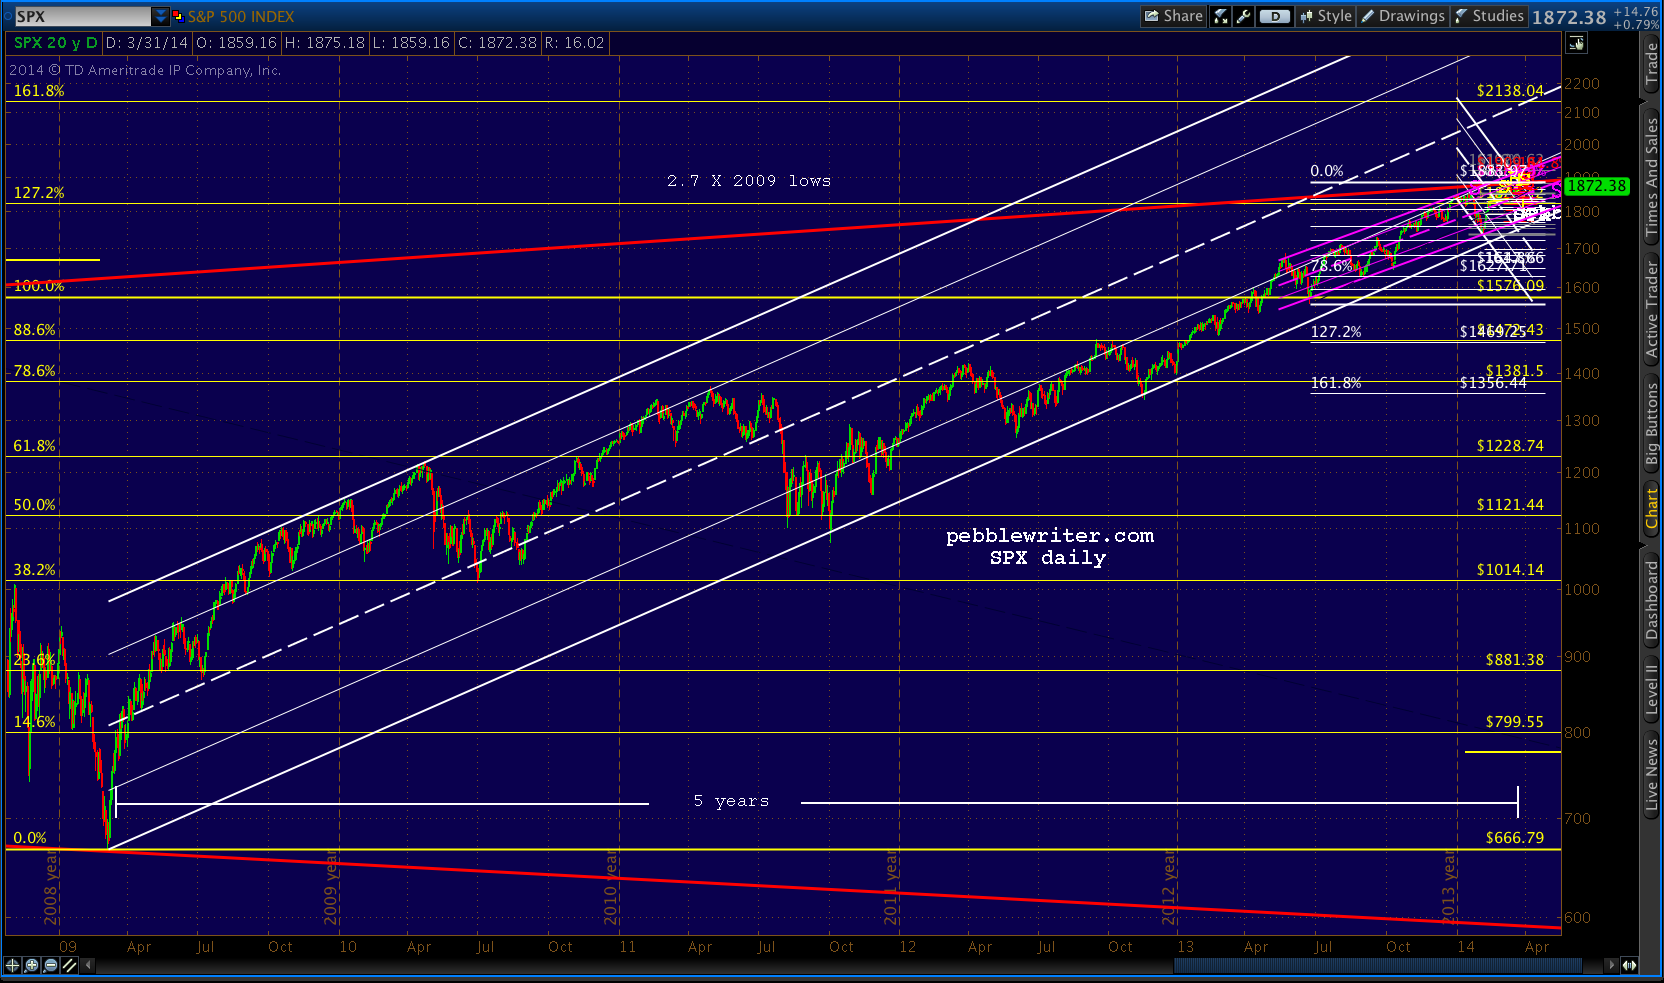
    2014-03-31-SPX daily 1111Also, thanks to the delay, the white channel bottom is converging with the purple’s.  The white channel bottom intersects with the white .786 Fib level around Apr 9.  By tagging the white channel bottom, bulls can hope to extend the rally long enough to reach the yellow 1.618 at 2138.  Interestingly, had the markets not consolidated for the past 3 months, that target would have been tagged right about now — as the white midline (dashed) intersects with the yellow 1.618 at 2138 on Apr 2.

    2014-03-31-SPX daily since 2009 1111Of course, that would have required a push up through some long, strong channel lines and manipulation of currencies and bonds as well.  Note the 10-yr chart patterns are still very much intact, with a series of lower highs held down by the falling channel top.

    2014-03-31-TNX daily 1144Though, a more modest decline in equities would probably translate into TNX hitting an intermediate target such as 2.20%ish (white channel midline) rather than the more aggresive white .786 and red channel bottom intersection at 1.91%.

  • Charts I’m Watching: Mar 28, 2014

    ES appears to be back-testing the broken purple channel midline.  But, the channel’s exact placement isn’t set in stone.

    2014-03-27-ES 60 min 0615

    I show it bumping up against falling channel bounds, but we’re likely to see an intraday push above.

    USDJPY should reverse at 102.78 — the red .618 as well as a channel top and another channel midline.  When it does, ES should run out of gas as well.

    2014-03-27-USDJPY 4hr 0646 2014-03-27-USDJPY 60 0630UPDATE:  9:50 AM

    That should be it for both, unless consumer sentiment surprises big on the upside.

    2014-03-27-ES 60 0652UPDATE:  10:55 AM

    Looks like it’ll be the red .618 at 1860.42 or the white .786 at 1861.31 instead for ES.  USDJPY came up just a penny or two shy of the .618, and is hanging around.  The ES algos aren’t done until it actually reverses.

    2014-03-27-USDJPY 60 07532014-03-27-USDJPY 5 0753I’m seeing more and more of this lately — where the push goes to a tick or two shy of a reversal point, but doesn’t quite touch it.  It leaves the door open for the next BREAKING NEWS! rubbish from the MSM to launch another step higher rather than reversing as it normally would.

  • Charts I’m Watching: Mar 27, 2014

    There’s much more potential downside ahead — if it’s allowed to play out [see: Are Bears Doomed?]

    The e-minis have completed a H&S Pattern that targets 1806 if it’s allowed to play out.  Remember, this is the right shoulder of the larger H&S that completes at 1823 or so.  The Flag Pattern indicates 1821-1823.

    2014-03-26-ES 60 min 0553USDJPY has recovered yesterday’s dip to the purple .618, but is running into channel resistance.

    2014-03-26-USDJPY 60 min 0553The 10-yr bond, another of our three signals of a major top, continues to rally.  Though, it’s approaching yet again that channel midline that has proven so formidable in the past.

    2014-03-26-TNX 4hr 0538SPX would benefit from a tag on the .886 (1844), after which we should get a bounce.  But, with all the H&S Patterns in play, it’s do or die time for the bulls.

    2014-03-26-SPX 15min 0620A reminder, I’m traveling today and tomorrow, so additional posts will be spotty at best.

    GLTA.