Still on the road today. Here are the key charts to watch.
The yen carry trade continues to drive the equity “markets”, as investors are zeroing in on the BOJ’s next meeting at the end of the month — certain that more QQE is on the way. We’ll see…
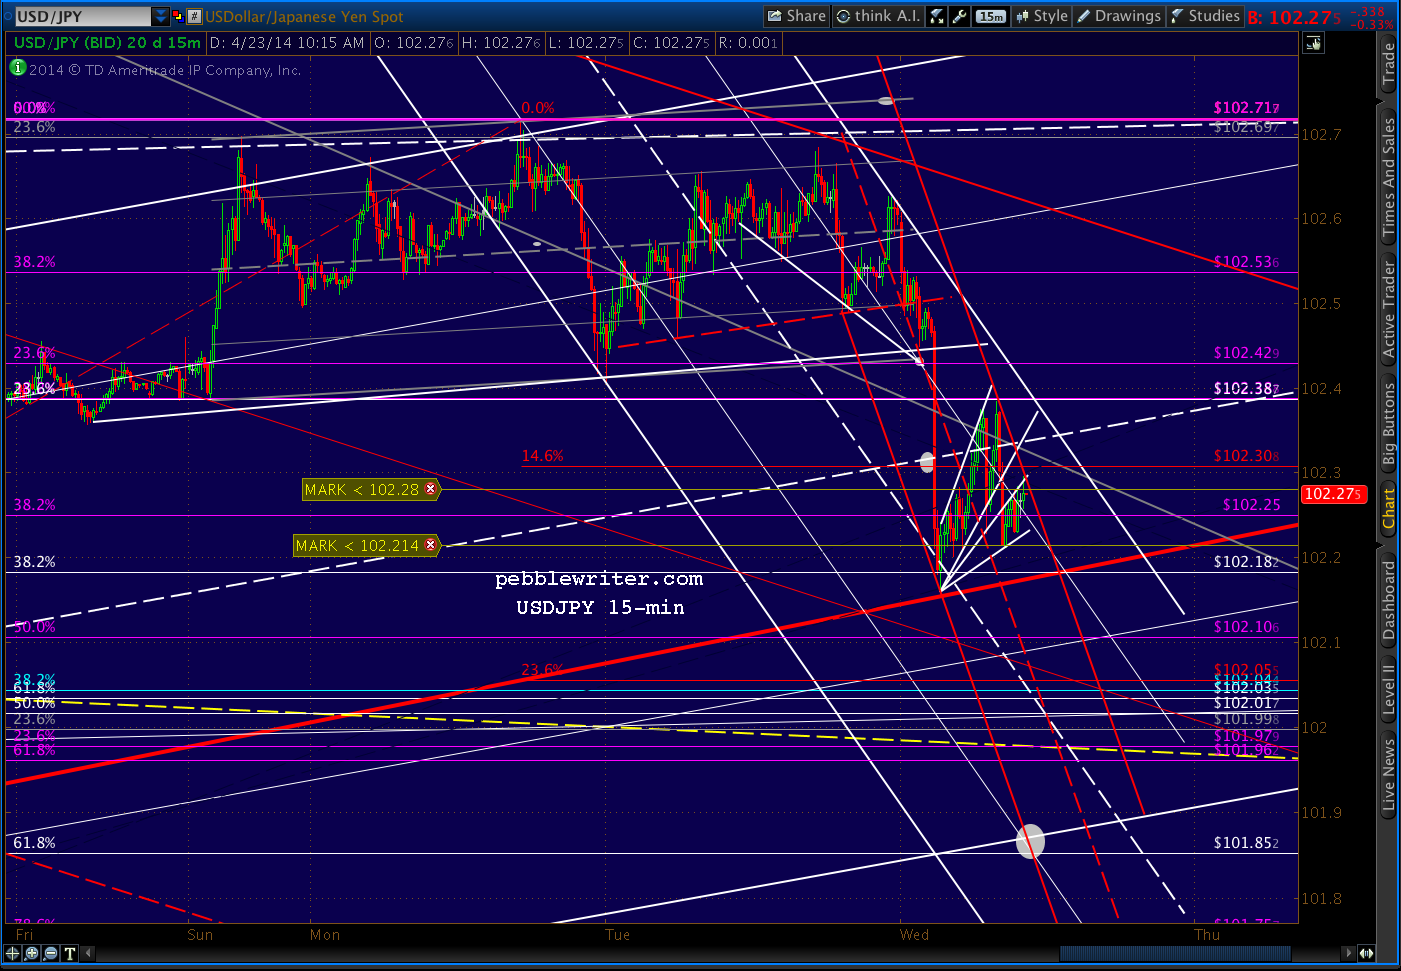
The USDJPY had a late session ramp, erasing the earlier losses and taking the pair back above the red channel bottom yet again.
 We should see some follow-through today if the rising white channel below is correct. It’s a flag pattern, of course, so the implication is a continuation of the downward trend — perhaps at the red .618?
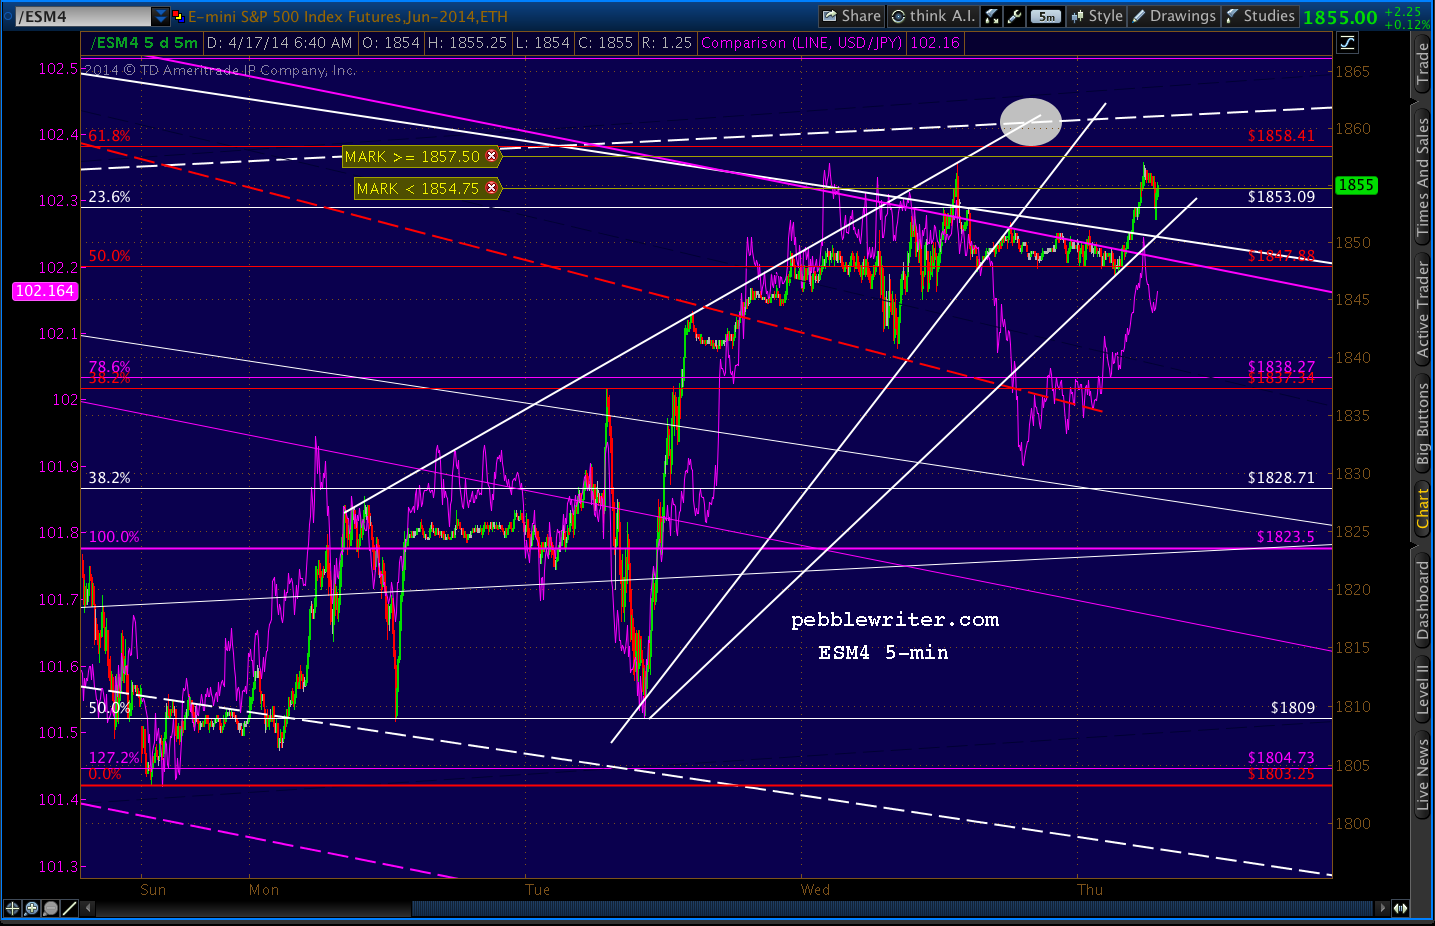
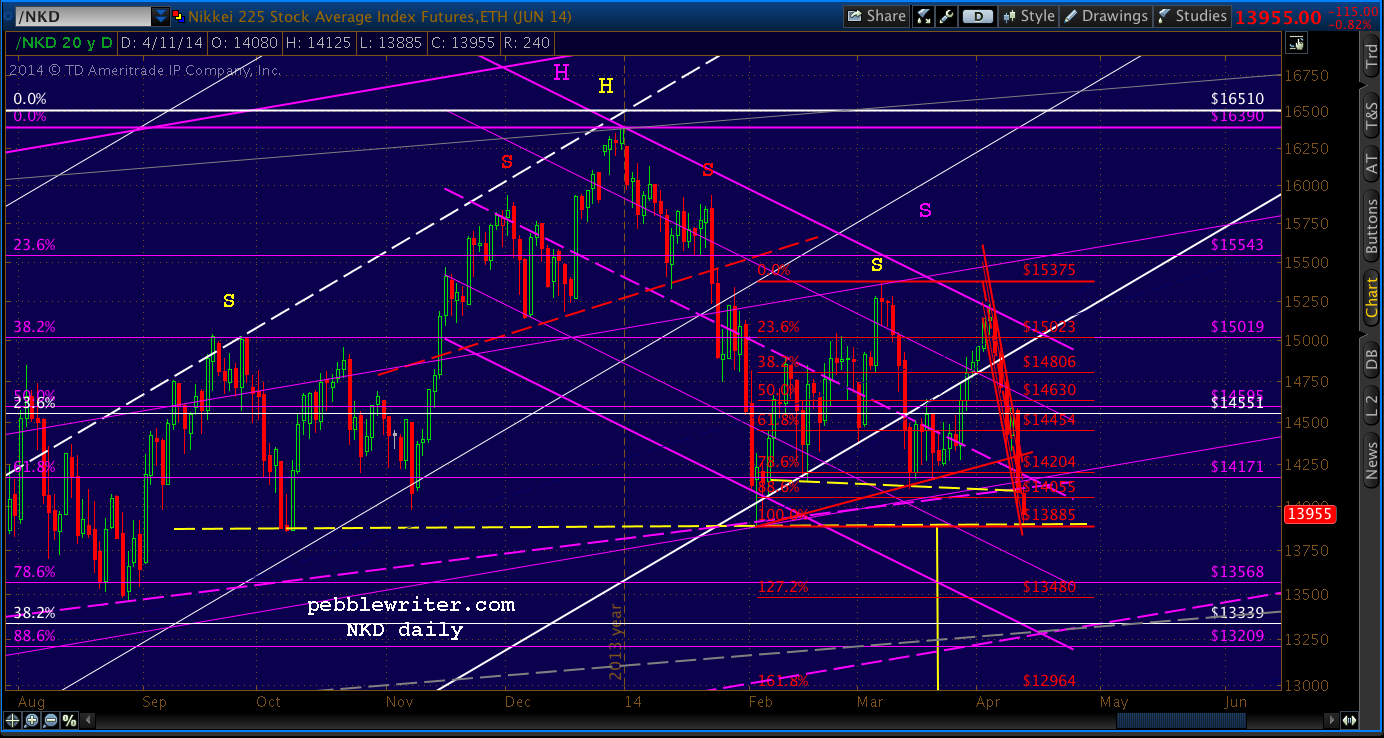
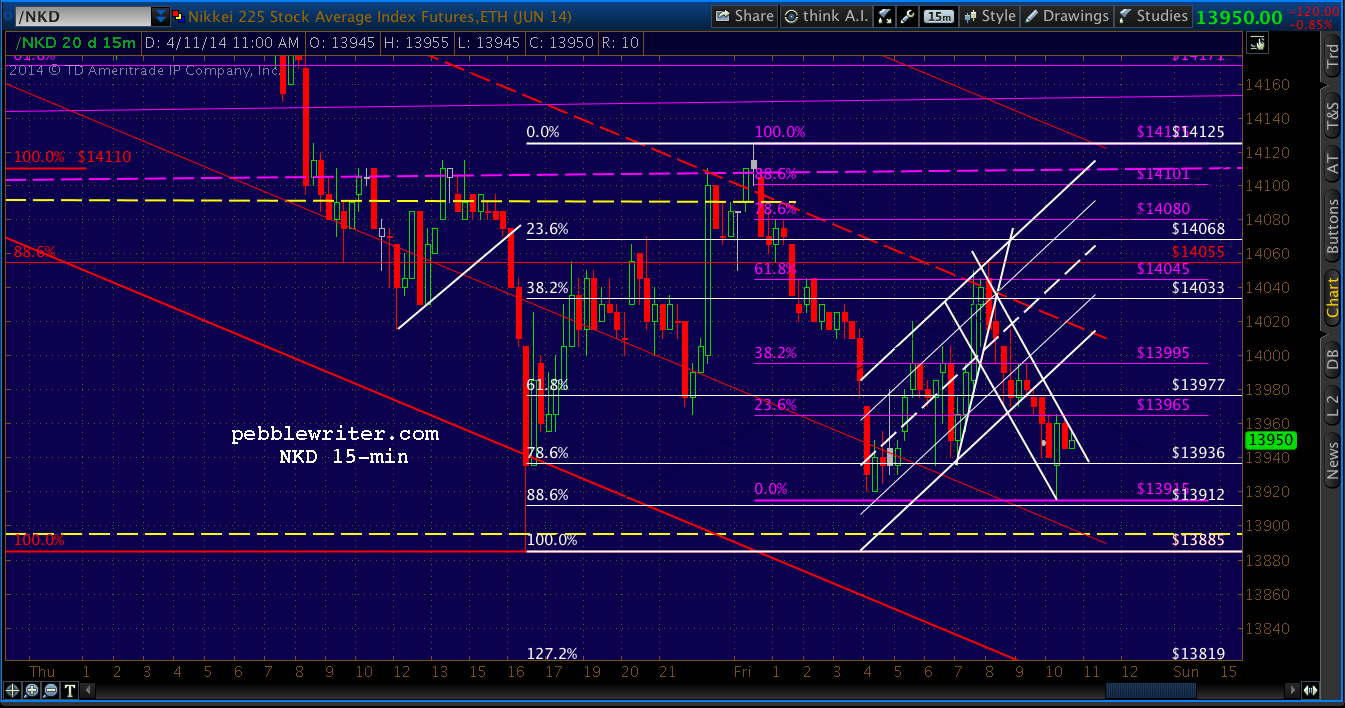
 Like many days, lately, the overnight ramp took a very logical channel that didn’t happen to agree with the bullish scenario and, basically, trashed it. Note the action on the Nikkei — which is a major determinant of USDJPY.
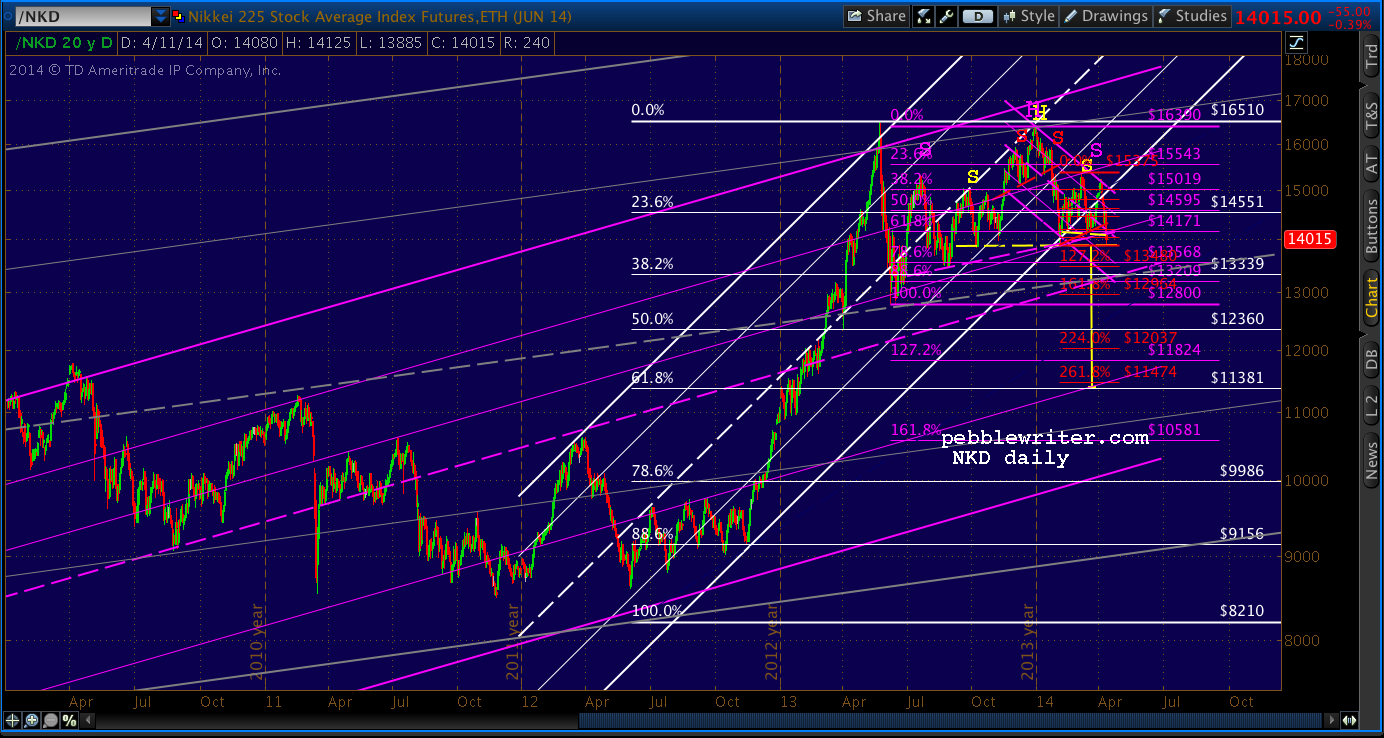
 The falling purple channel, having backtested the midline, should have returned to the .236 and eventually the bottom of the purple channel. But, that would have meant the multiple H&S Patterns playing out — and another 100+ points to the downside.
Solution? Trash the falling red channel by ramping up the NKD overnight, bust the purple midline, and throw everything into disarray. The NKD is now in no man’s land, and completely undecided about what happens next. It’s not unusual when bulls are defending a neckline.
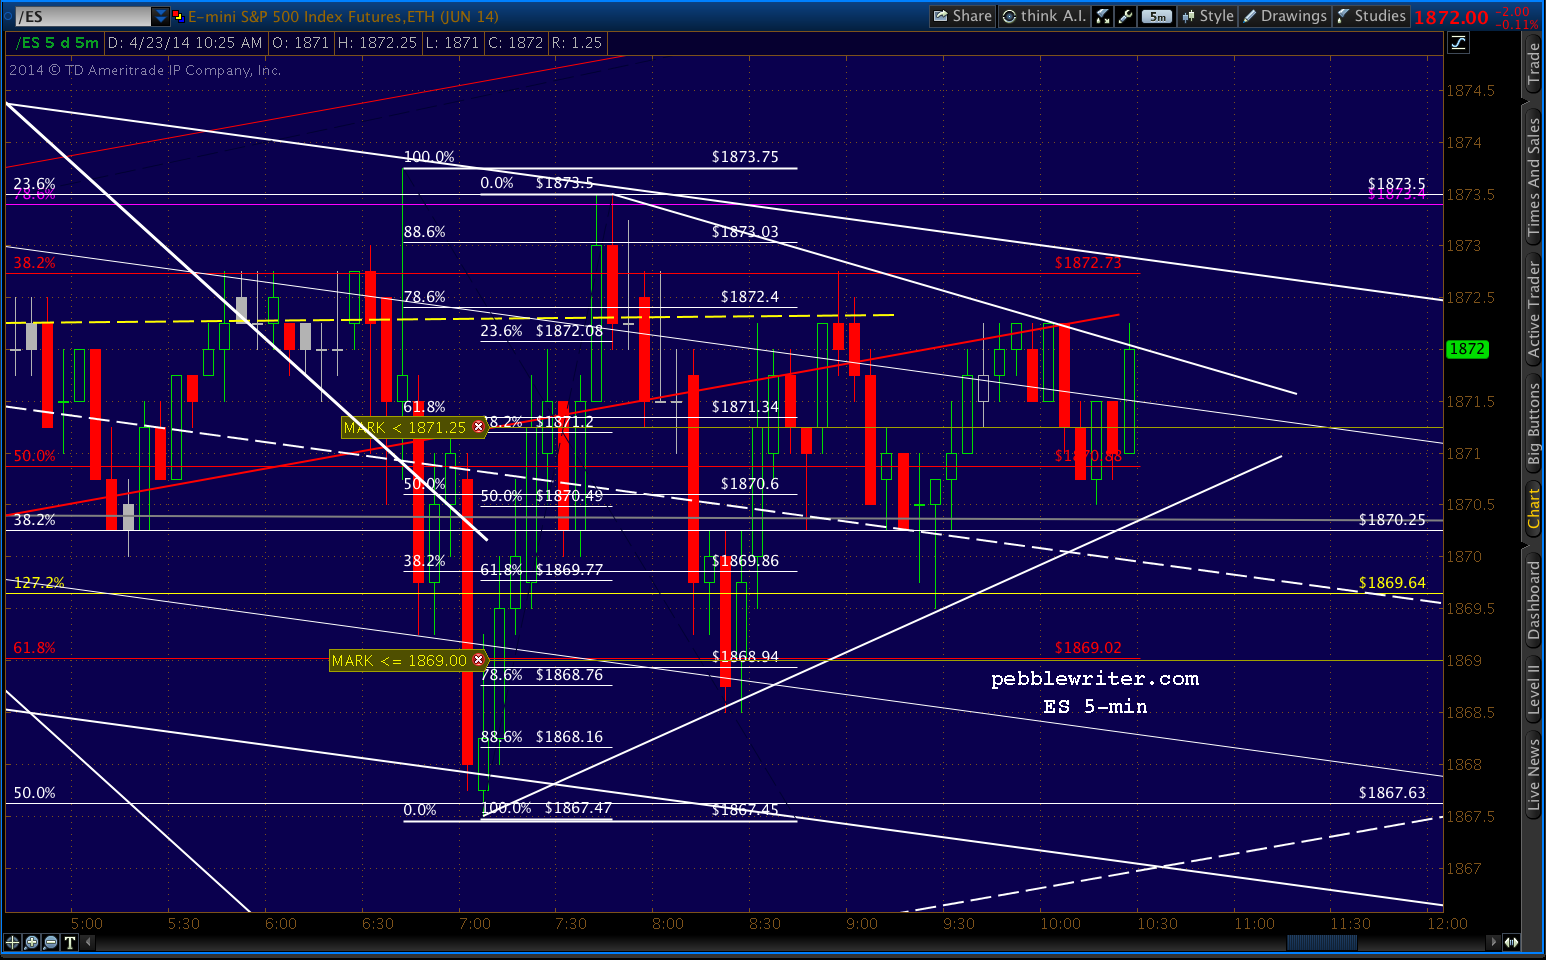
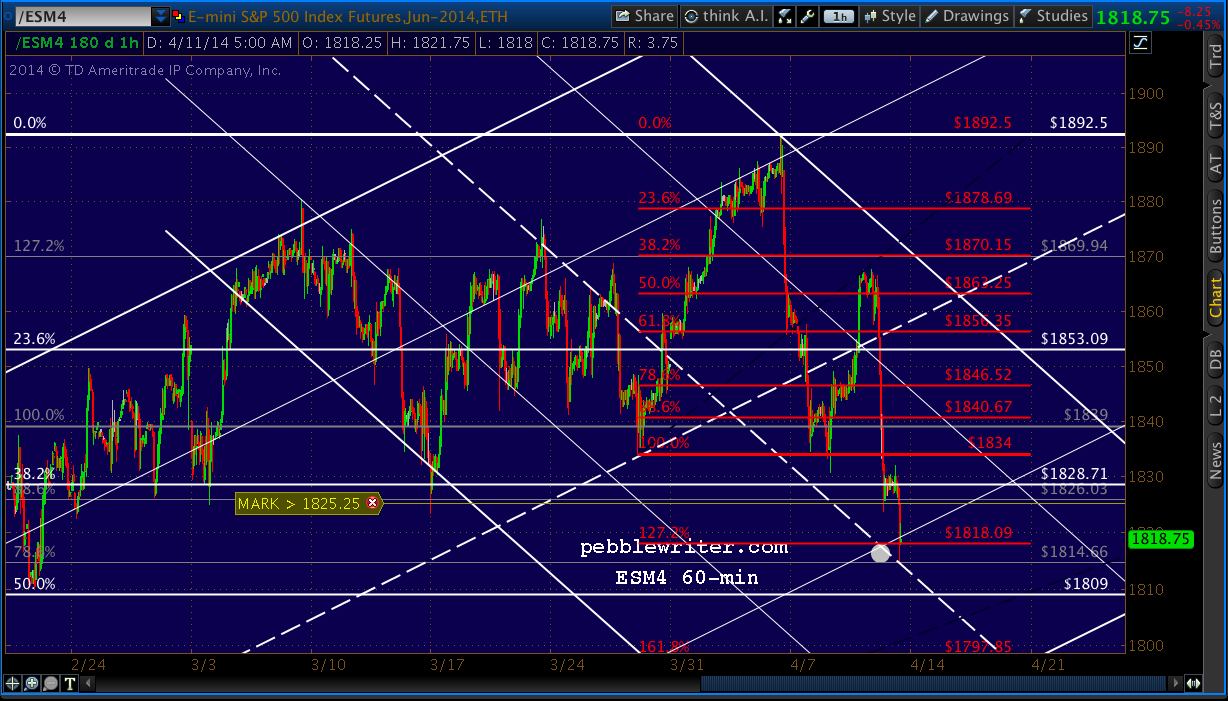
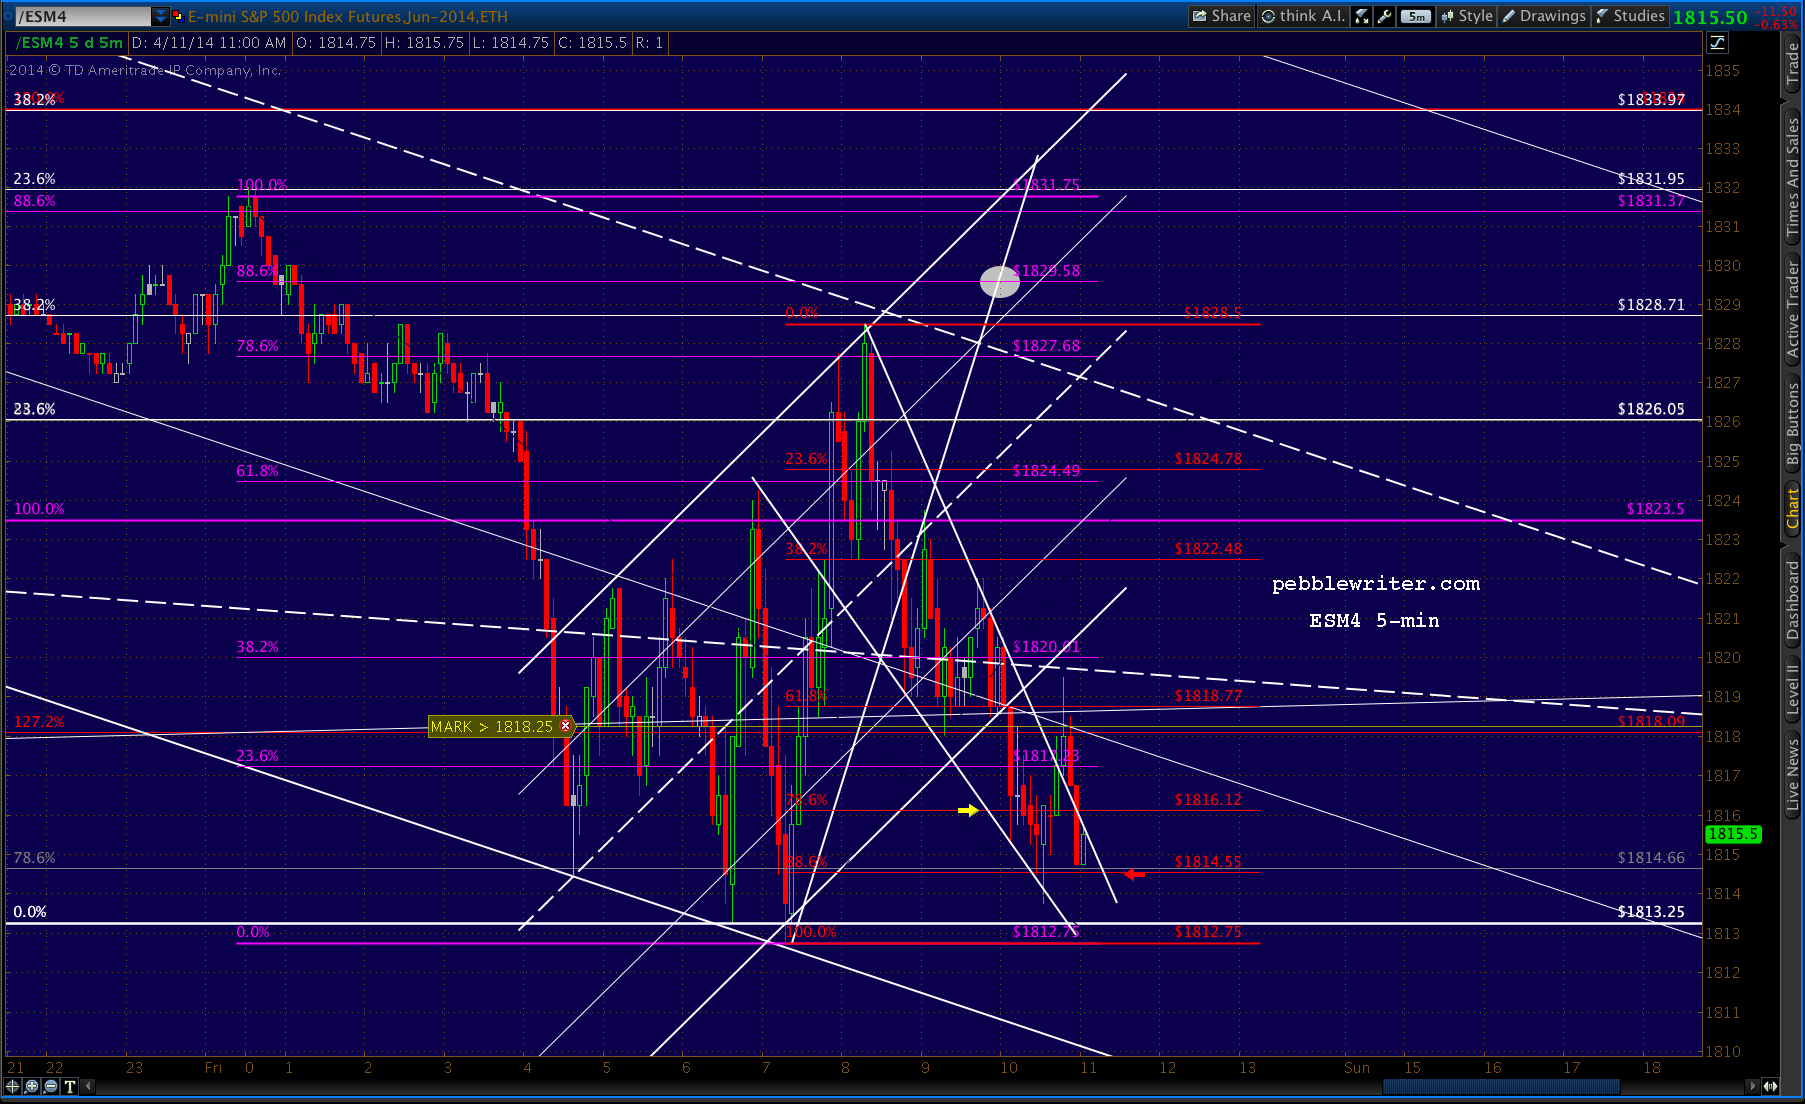
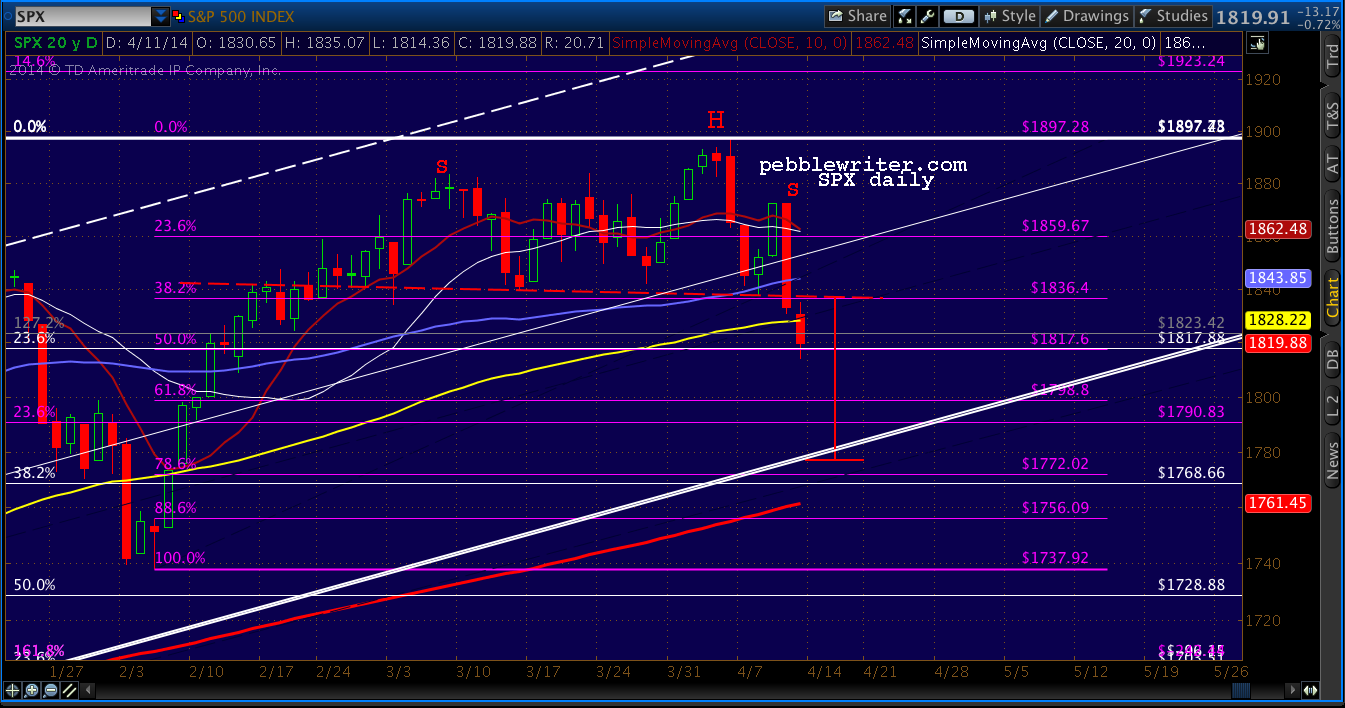
The same thing happened to ES, of course, with similar results. In a normal market, prices would have already declined to the white .618 at 1789.
 Of course, in this case “the bulls” are led by the BOJ, which buys equity ETFs along with the billions in debt. Other investors are willing to go along for the ride; but, it’s very hot money that will flee the scene if the yen should continue to strengthen.
Just a reminder: on April 8, BOJ’s Kuroda dismissed the need for additional stimulus — and, the market promptly tanked. Numerous Fed governors are speaking today, and their comments will no doubt determine the market’s direction.
And, that’s essentially what the market has become lately: a tug of war between the carry trade-oriented banks funded by the Fed with no-cost billions and those who don’t, for one minute, believe the MSM hype and see deep-rooted problems in the fundamental picture.
The Fed, the ECB and the BOJ are doing their best — through both direct and indirect intervention — to prop up the markets for their banking overlords, even though it has created more bubbles to replace the ones that burst so spectacularly in 2007-2008.
They will allow occasional small declines in the markets in order to let the air out and deflect criticism that the markets are rigged (they are.) Notice how managed this “correction” has felt? But, otherwise, nothing bad will ever happen…right?
The problem is that they simply can’t control everything. As the BOJ has learned, the costs of QQE are beginning to grossly outweigh the benefits. Sure, Toyota is selling more Camrys. But, fresh food is soaring in price (as in most corners of the world) and fuel has become so expensive that they’re turning their nukes back on.
And, what happens if the markets really stumble, and all that hot money comes flooding back into the yen? There are enough hot spots around the world that sooner or later, something will spiral out of control. And, overnight ramp jobs and cheerleading from the Fed won’t be enough to stop the bleeding.
UPDATE: 12:30 PM
The market hasn’t exactly spiked after Yellen’s speech was released. ES tagged the SMA20 and retreated a little, but I assume it will make a run for the red .618 at 1858.
 GLTA.
GLTA.


 The close-up shows the 4:01 rally that screwed cash market traders who shorted the red channel breakdown. The overnight ramp job on up to the .886 was the salt in the wound. Just to be clear, this is not a market.
 After tagging the red channel bottom for the second time in a week, USDJPY has put in a strong A-B-C move to a TL (red, dashed) off the Apr 21 and Apr 22 highs.
 Note that each day’s push beyond the falling grey channel boundary has failed. This one represents the first higher high in the past week, so it’s a more strenuous effort to break the trend.
 UPDATE: 10:29 AM
 There’s another TL here that might offer support at a .500 Fib level, but 101.96 would be stronger support at the .618 and yellow channel midline.
 The bulls need a push back above the red channel bottom muy pronto, but a bounce at 101.96 would make for a stronger move.