The New York Fed reported one of the clearest signs yet that not everything is hunky dory in econ land. In a move that matches the early stages of the 2008 plunge, the Empire Fed Economic Activity Index just plunged to -14.92 (expectations +4.50.) It’s the biggest miss in over 5 years.
Look for USDJPY to sell off just enough to matter — but, not so much that it reflects badly on the Japanese economy, which had its own embarrassing print last night. GDP declined at an annualized rate of -1.6%, another signal that Abenomics hasn’t worked, isn’t working, and never, ever can work. To Abe worshipers, of course, this is yet another justification for the coming expansion of QQE.
ES is currently off around 9 points. Perhaps SPX will get some follow-through to last week’s elusive target: the SMA200, currently at 2076.54.
UPDATE: 9:40 AM
Gotta hand it to the PPT. What they lack in integrity, they make up in single-minded determination. There’s another point or two of downside in ES if that little trend line is to hold. It currently shows two higher highs and two higher lows. That’s a trend they usually care about protecting.
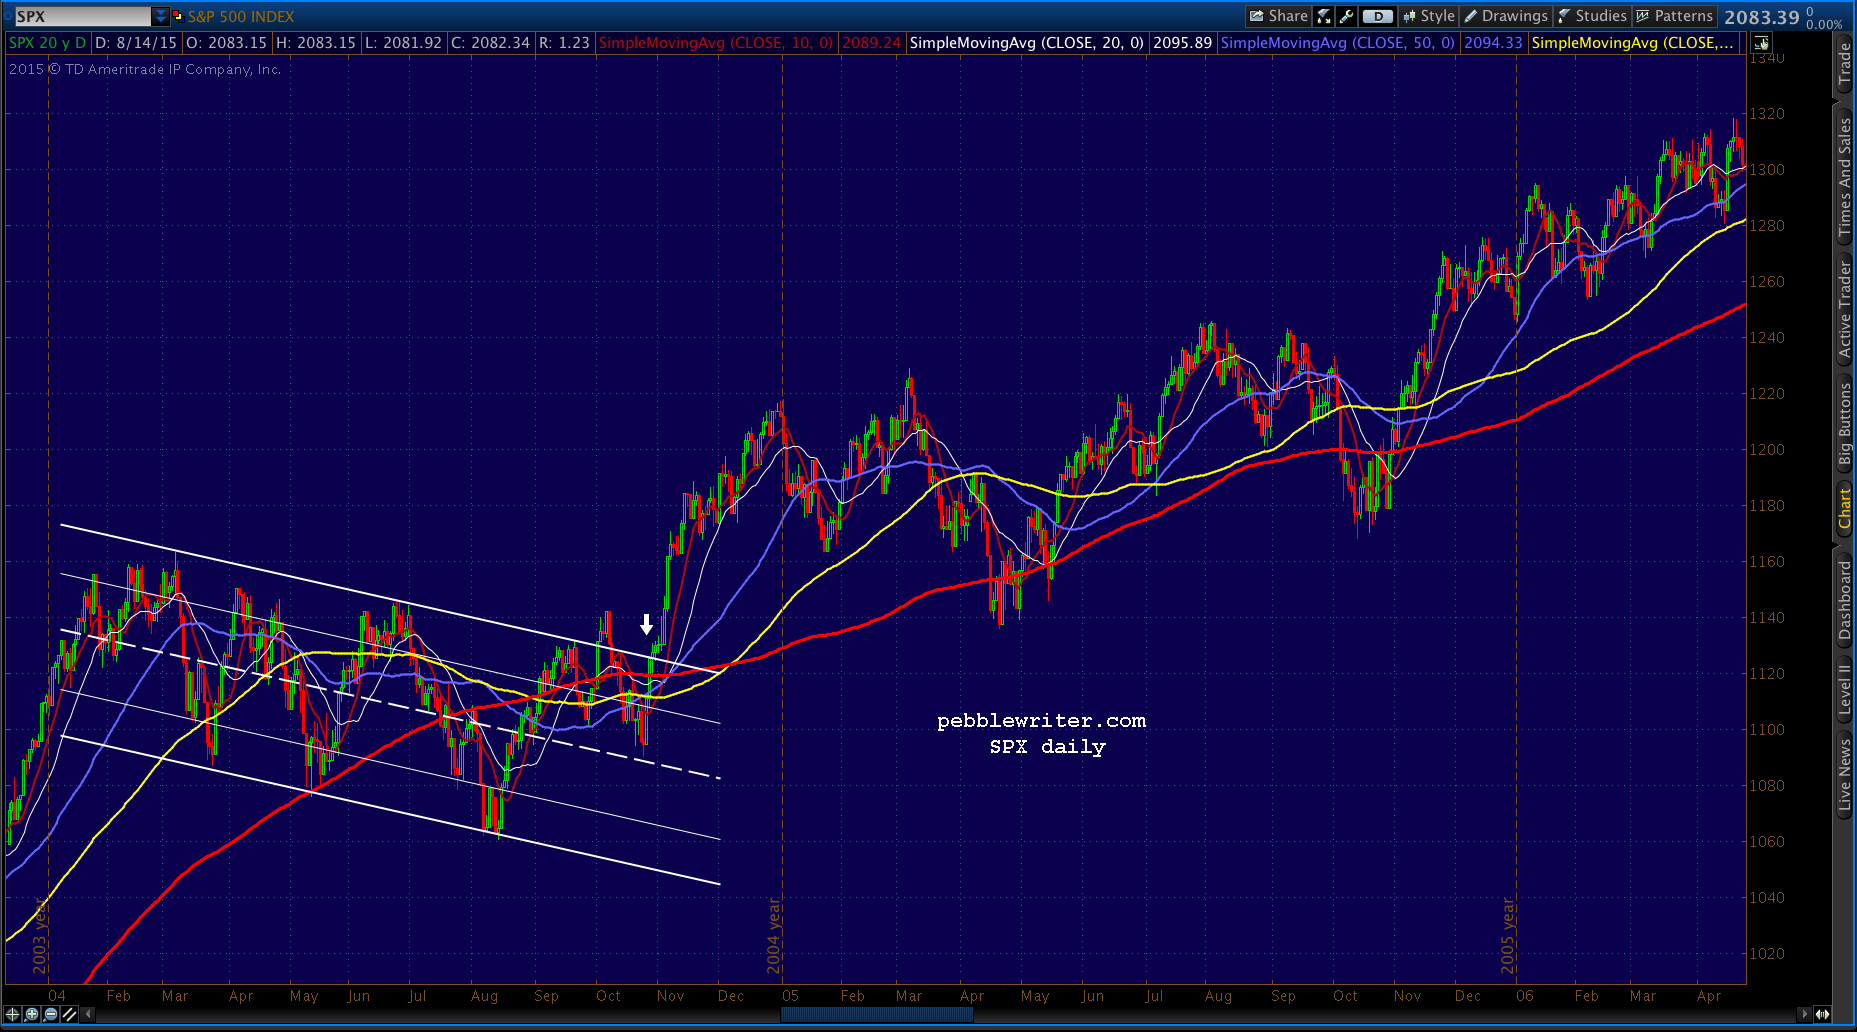
The last time the spread between the 10, 20, 50, 100 and 200-day moving averages was this small (22 points) was on January 3, 2008. It’s the sort of consolidation that almost always precedes a significant move — whether higher or lower.
Back in 2008, it obviously occurred in the early days of the crash. But, the previous instance in 2004 came at the tail end of an 11-month consolidation that eventually broke out, yielding three more years of the bull market.Coiling doesn’t tell us which way the market will go when it breaks out/down, just that the consolidation’s days are numbered.
Of course, HFT and algorithms have become so effective at manipulating prices these days that we hardly need an excuse for a breakout. I’m looking at you, CL.
“How dare China devalue its currency!” the ECB and BOJ cried…as they prepared to do more of the same. Yesterday’s intraday crush were hardly enough to prompt the BOJ — the world’s foremost currency debaser — to expand QQE. But, the PBOC’s actions sure have them warming up the old printing press, and with a nifty excuse to boot. We’ve been expecting it.
The ECB, on the other hand? Well it’s pathetic, really. First, they threatened QE for years before actually doing it — giving everybody and their mother an opportunity to front-run it. When they finally announced PSPP on March 9, the EURUSD had been plunging nonstop for a full 10 months.
Left alone, the euro would have reached parity with the USD within 60 days, tops. After PSPP, it fell for exactly 4 sessions before the ECB pushed the panic button — bailing on the whole exercise. The reason, of course, was the impact it was having on stocks (the thin purple line below.)
Unfortunately for the ECB, it seems there are still a few investors out there who insist on viewing the markets as rational and fundamentally driven. They haven’t (yet) been trained in Pavlovian knee-jerk currency debasement buying panics. They view a weaker euro as tantamount to a weaker European economy that argues for lower stock prices. Fools.
This is no doubt a severe disappointment to TPTB, who rather hoped that the EURUSD would pick up where the USDJPY left off: the driver of the carry trade that has kept stocks on the rise for the past 4 years.
Instead, the EURUSD has evolved into a third-string bench warmer by which to lever stocks higher when the CL and USDJPY can’t be bothered. EURUSD is so whipped that it can’t even complete a simple Gartley Pattern; every time it dips below the .618 Fib (1.0845,) stocks go apeshit.
So, the next time Draghi threatens to devalue the euro in response to China’s massive 4% currency move, remind him that he slashed the euro’s buying power by 25% between May 2014 and Mar 2015. It drove interest rates below zero and inflated PE’s to historic highs, but did nothing to revitalize a failing economy.
* * * * *
With multiple downside targets to choose from, SPX nailed the deepest natural Fib target (the .886) yesterday, then spent an hour flirting with another leg down to actually complete the H&S Pattern before the algos took over and sent it spiking higher.
The main drivers were the EURUSD and CL, which constructed another flag pattern just like the one on Aug 3-5, the last time it was called upon to prop up stocks.
We remain short from yesterday’s close. Today’s targets coming up.
As we anticipated on July 8 [see: Update on Nikkei] the sharp drop in NKD panicked the BOJ. The nifty megaphone pattern was spoiled by a “coincidental” sharp rally in USDJPY.
Before USDJPY had even reached its 100-day moving average, the BOJ sent it soaring. It had rallied by over 4% as of this morning — enough to push the Nikkei 9.3% higher.
As it melts down again, we’re left to wonder if the next meltdown will be the charm? Time to ladle a little QQE on top of the currency manipulation?
When we first noticed the similarities between recurring instances of USDJPY levitation over the past 4 years, we set about discovering the pattern that would ultimately signal the next breakout.
Sure, it could signal a breakdown, but central bankers have essentially outlawed those — in both words and in deeds.
Every instance involved USDJPY being either supported (by a trendline, a channel, a key Fibonacci level) or breaking out of a seemingly bearish predicament. In either case, a strong rally in USDJPY always drove stocks higher — without exception.
In fact, it’s fair to say (which we do, quite often) that the yen carry trade has been the single most powerful force behind stocks’ unending rally since 2011 [see: The Yen Carry Trade Explained.] This chart from May depicts the cozy relationship, alongside several key technical milestones.
Yet, the trashing of the yen isn’t without consequences. Every time the BOJ bashes the yen (boosting USDJPY), it increases the cost of just about everything Japan must import. The budgets of beleaguered Japanese consumers and importers alike are nudged that much closer to the breaking point.
Fortunately, The Powers That Be aren’t entirely heartless. It remains our thesis that they engineered the oil crash chiefly to enable the Japanese to afford to keep depreciating the yen in the face of soaring oil prices [see: Those Wacky Central Bankers.] Naturally, this kept the carry trade alive (a coincidence, no doubt.)
One might even regard the latest leg down in oil prices as paving the way for a cheaper yen — an bribe enticement, so to speak, to the Bank of Japan. If that wasn’t enticement enough, China — Japan’s biggest trading partner — just devalued the yuan by about 2% today. [see: China Joins the Party.]
But, as much as the BOJ enjoys helping the Fed, the ECB, the BOE and the SNB with their Keynesian ambitions, they have a market of their own to prop up. As we correctly anticipated on July 8 [see: Update on Nikkei] the sharp drop in NKD panicked the BOJ.
Before the USDJPY had even reached its 100-day moving average, they sent it soaring. It had rallied by over 4% as of this morning. It was enough to push the Nikkei 9.3% higher (and SPX +4.3%) over the same period. It was quite an accomplishment — which is now in danger of coming undone. Or is it?
Note that the 6% drop back on July 8 stopped precisely on a trend line that also connects the April 1 and May 7 lows. It’s hard to know the exact timing, but a further decline to about 19,240 (-5%) would complete a huge Head & Shoulders Pattern that targets 17,275 — nearly 15% below current prices. Think that might prompt a little panicking?
Our March 27 analog predicted a denouement of some sort on Aug 13. Certainly a meltdown in NKD of that caliber would do the trick. It’s safe to say that US stocks would also be affected.
The S&P 500 has been the beneficiary of one after another central bank gimmick over the last 10 months since Fed President Jim Bullard halted the mid-October 2014 meltdown with a comment on Bloomberg that QE4 might be warranted.
But, this unstoppable force has run into an immoveable object: SPX 2138, which is the 1.618 extension of the 2007-2009 market crash [explained HERE.] Bullard, the BOJ, and the ECB got SPX up to 2134 all right, but it’s gone nowhere since then. Worse yet, it’s about to drop below the trend line (below, in purple) that connects the recent lows to that key October 15 low.And, if that weren’t enough, there are several potential H&S Patterns licking their chops, promising sizable downside in the event they’re triggered (marked with the red and white ovals.)
Bearish, right? It is… if the BOJ sits on their hands and looks away, pretending not to notice. But, with their own market in danger of a 15% correction, what are the chances of that happening?
* * * * *
SPX came within about 2 points of our second downside target yesterday. From China Joins the Party:
Today’s targets for SPX include the white TL from the Jul 7 bottom and the red channel midline at the SMA200 (2074.13.)
In a move that surprised practically no one, China decided to join the currency debasement party in order to stimulate its slumping economy. E-minis are currently off 18 points, but the interesting action, of course, is in the currencies.
The Yuan made a big move, to be sure, but it affected different pairs to different extents. Whereas the move versus the dollar was huge…
…it barely registered on the yen. The reason, of course, is that the Japanese cannot afford to let anyone – especially China – beat them in the race to the bottom. This actually tracks from a fundamental standpoint, as China is Japan’s biggest import partner.
Friday saw SPX tag first one, and then the other, of our downside targets — completing one of our most successful weeks this year.We’re back to sizable pre-opening ramp jobs, with the eminis currently showing a 13-pt gain with about 10 minutes to go. The culprit is USJPY, which broke channel support on Friday, but magically levitated overnight and is safely back in the non-sensical red channel.
Wednesday’s short call at 2112.60 really paid off yesterday, as SPX dipped as low as 2075.53 before the algos came and rescued it. The futures have bounced around a bit this morning; but, the rather predictable low that was posted after the employment data hasn’t solved one basic problem that kept us short yesterday.
SPX shot up to our initial upside target yesterday, reaching 2112.66 before turning around and tagging the second of our downside targets. While it made for a strong performance (we called a short at 2112.60, rode it back down to 2098 where we played the bounce), it did little to reassure traders. From yesterday’s members section:
That caveat includes a potential consolidating move just short of the Jul 31 peak at 2114.24 that would mirror yesterday’s stick save just shy of the previous low.
The algos are firmly in control at this point, so there is little to do except watch the signals from CL and USDJPY. The most telling move this past week has been CL — which needs to continue melting down if USDJPY is to score big gains.
Isn’t it great!? The worst ADP jobs data in months.
Under the premise that bad news decreases the odds of a rate hike (or, dare we hope, spurs more QE?) the eminis are up 15 points (off from a high of +20) before the opening. But, it’s not the kind of pattern you’d want to bet the house on.


 Look for USDJPY to sell off just enough to matter — but, not so much that it reflects badly on the Japanese economy, which had its own embarrassing print last night.
 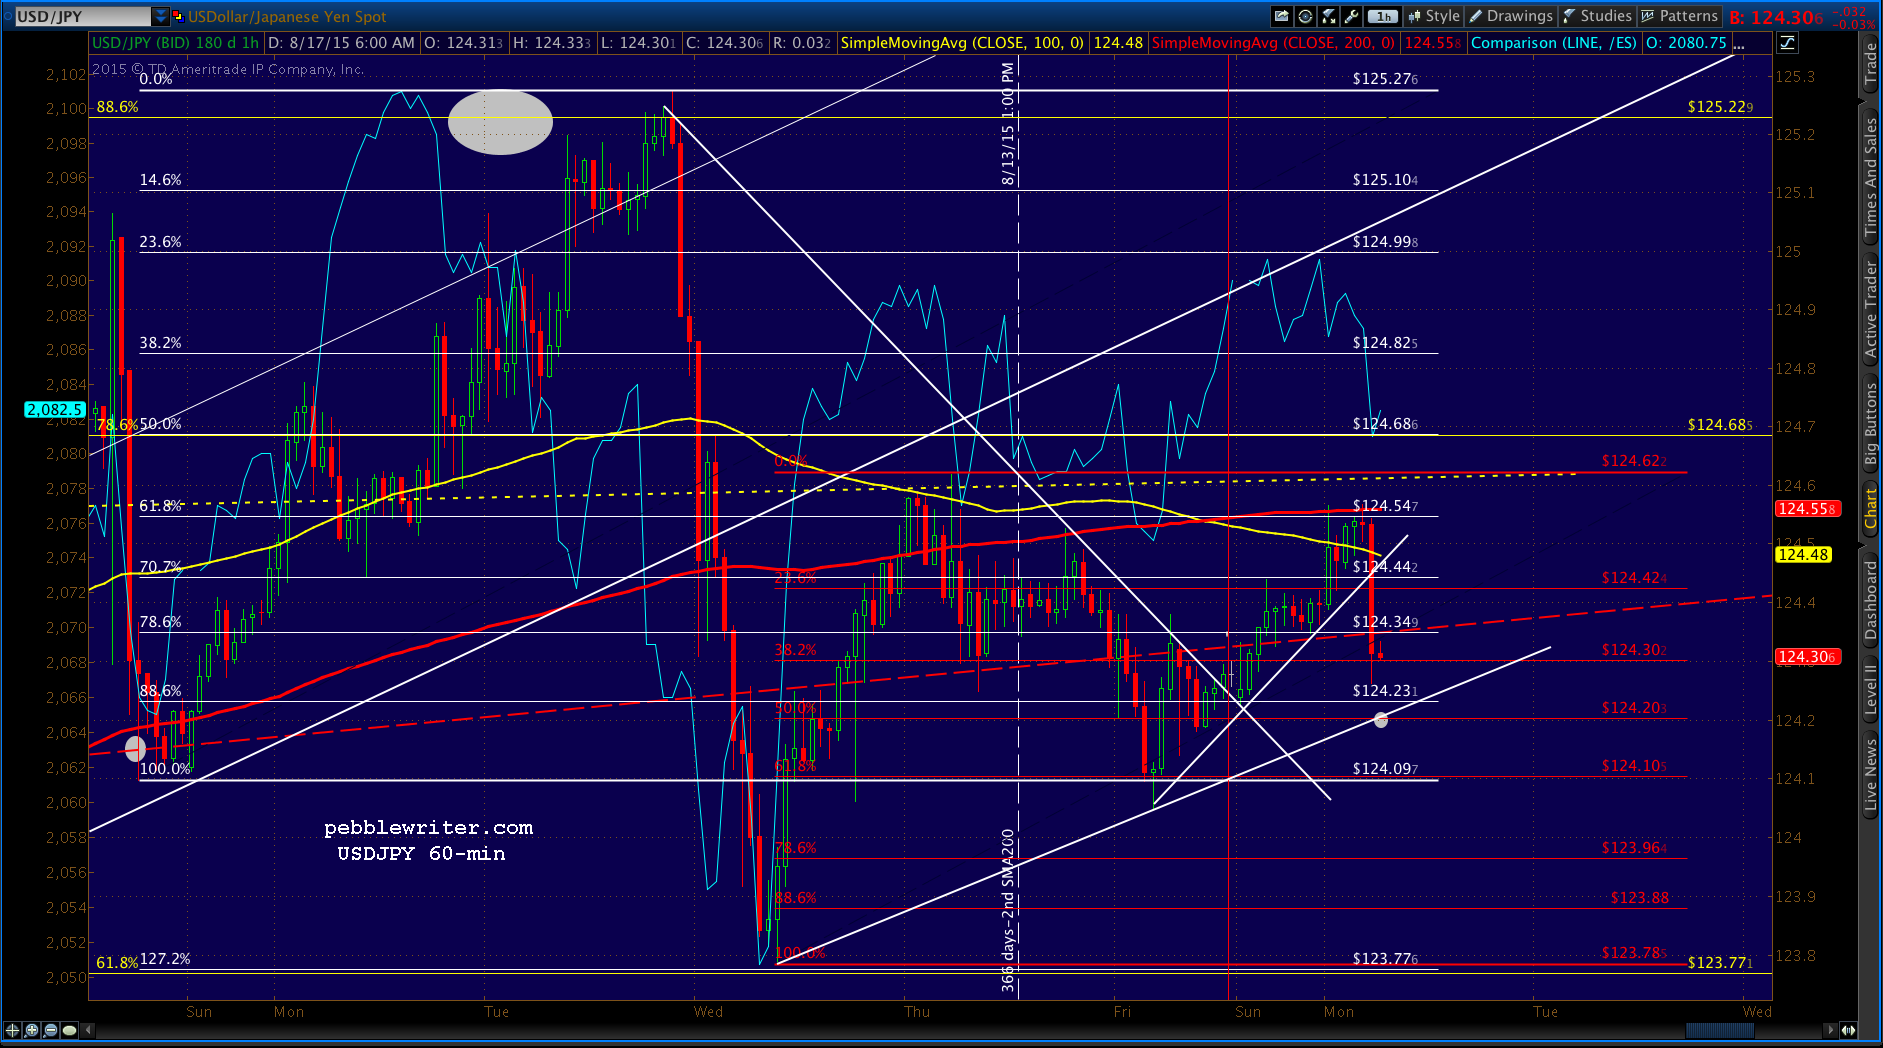 GDP declined at an annualized rate of -1.6%, another signal that Abenomics hasn’t worked, isn’t working, and never, ever can work. To Abe worshipers, of course, this is yet another justification for the coming expansion of QQE.
 ES is currently off around 9 points.
  Perhaps SPX will get some follow-through to last week’s elusive target: the SMA200, currently at 2076.54.
 UPDATE: 9:40 AM
 continued for members… (more…)