

The market has ignored the most obvious reversal points. Does that mean the waters are safe? For what warning signs should we be watching? We’ll take a look back at the patterns exhibited in the last few meltups.
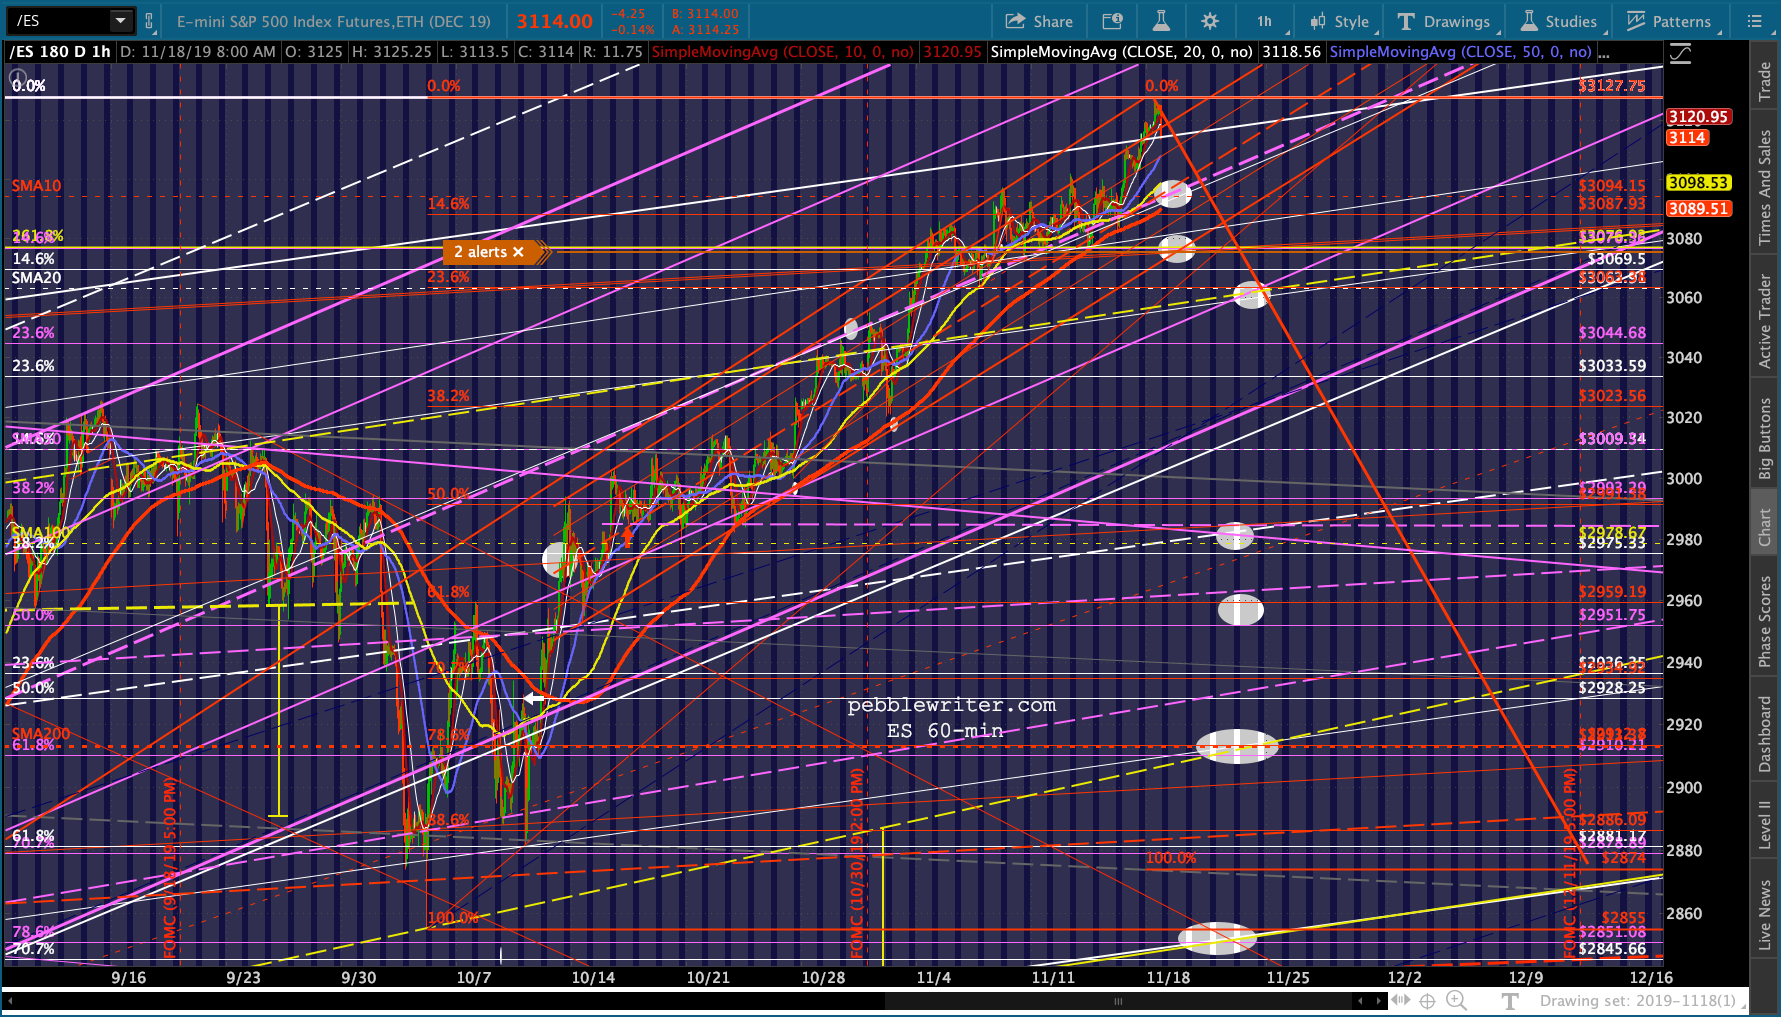
The first is that backtests happen. The tricky part is the timing. ES is currently about 44 points above its 2.618 extension and has broken a short-term trend line of support. As we discussed Friday in our argument to fade that particular ramp job, the path to 3076.93 is wide open. But, is the timing right? Is a backtest certain?
 continued for members…The downside potential for a reversal here is quite logical — as it has been several times over the past two months. The SMA200 is right on top of the yellow midline, the red .786 and the purple .618. It’s hard to find a more compelling downside target.
 Yet, as we’ve witnessed many times over the last month or so, the factors won’t have it. USDJPY keeps poking up above its SMA200…
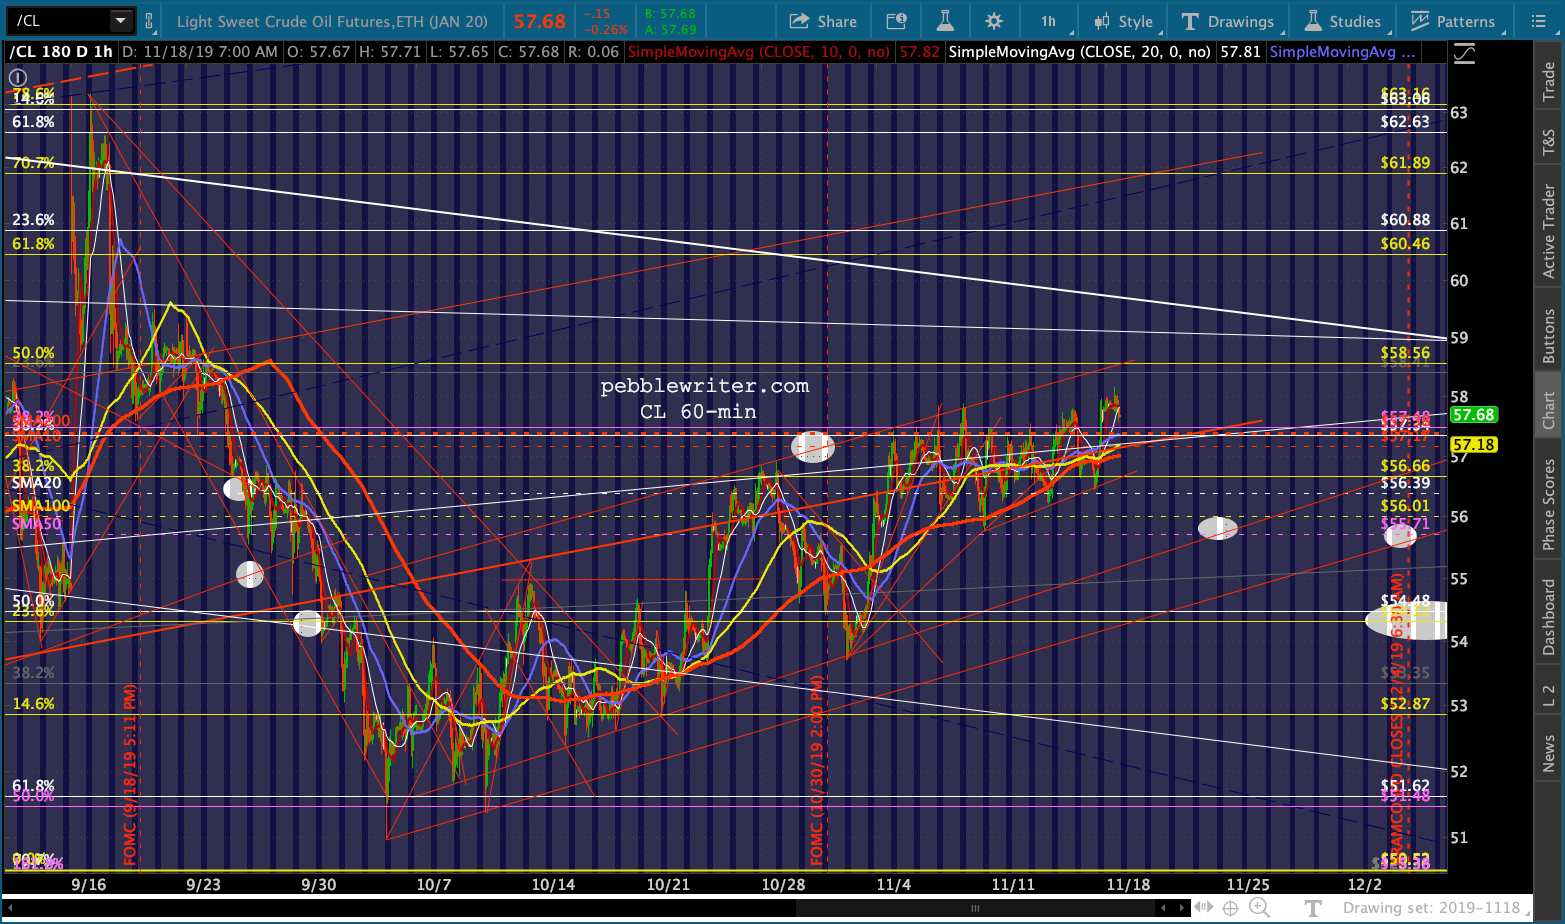
 …as does CL.
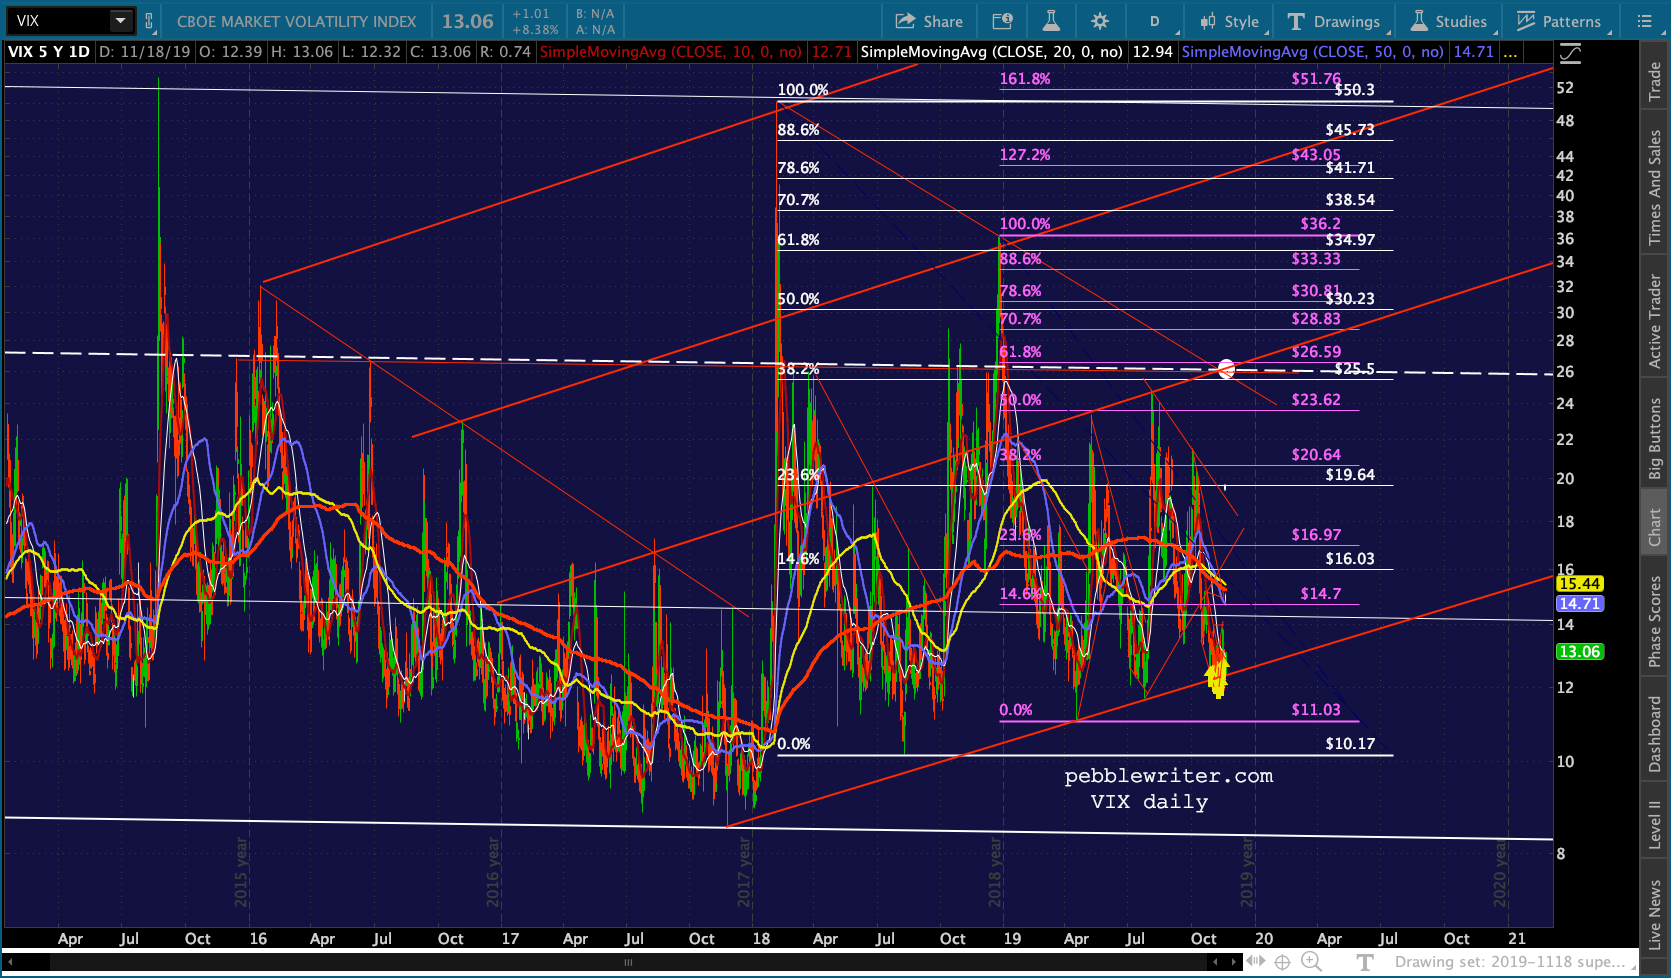
 And, VIX keeps dropping down to and in some cases through its TL of support from Nov 2017.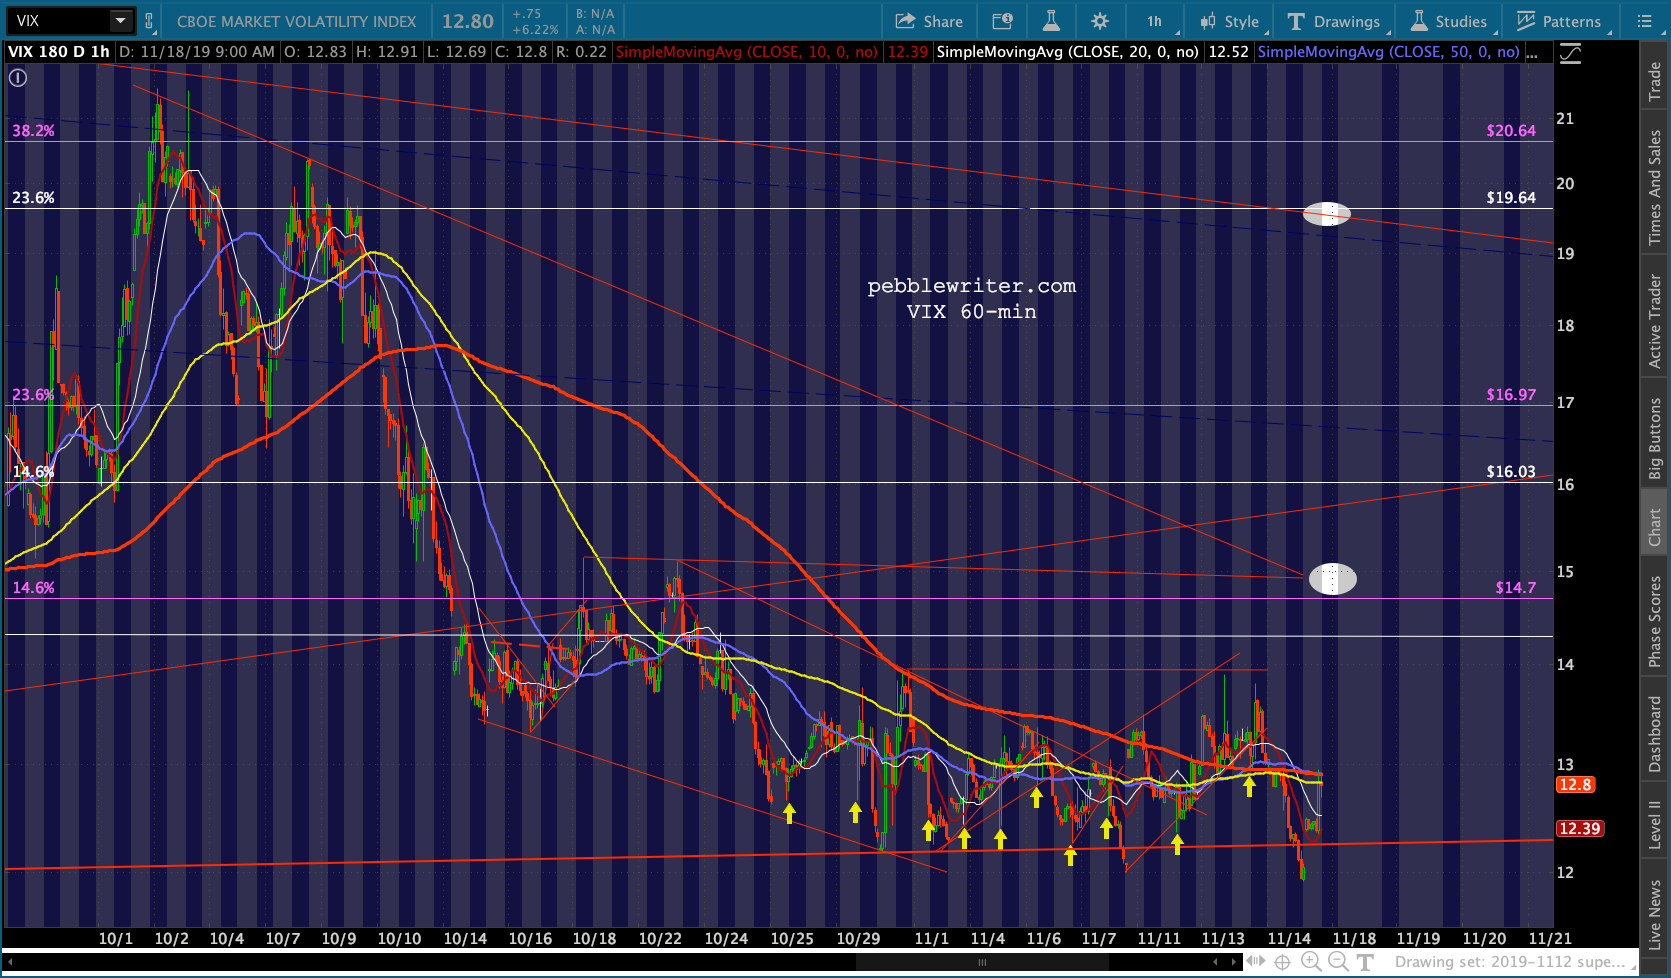
 If we look back, we can see numerous reversal points that might have made sense but which were overrun by algos being triggered by these same factors. We should have seen a backtest of 2138 in Aug 2018.
Failing that, we should have seen the Dec 2018 drop reach 2242. Since that failed to materialize, we might have expected a backtest of 2703.62 in Aug 2019 and, if that didn’t hold, to 2485.
The close-up below illustrates the logic of each.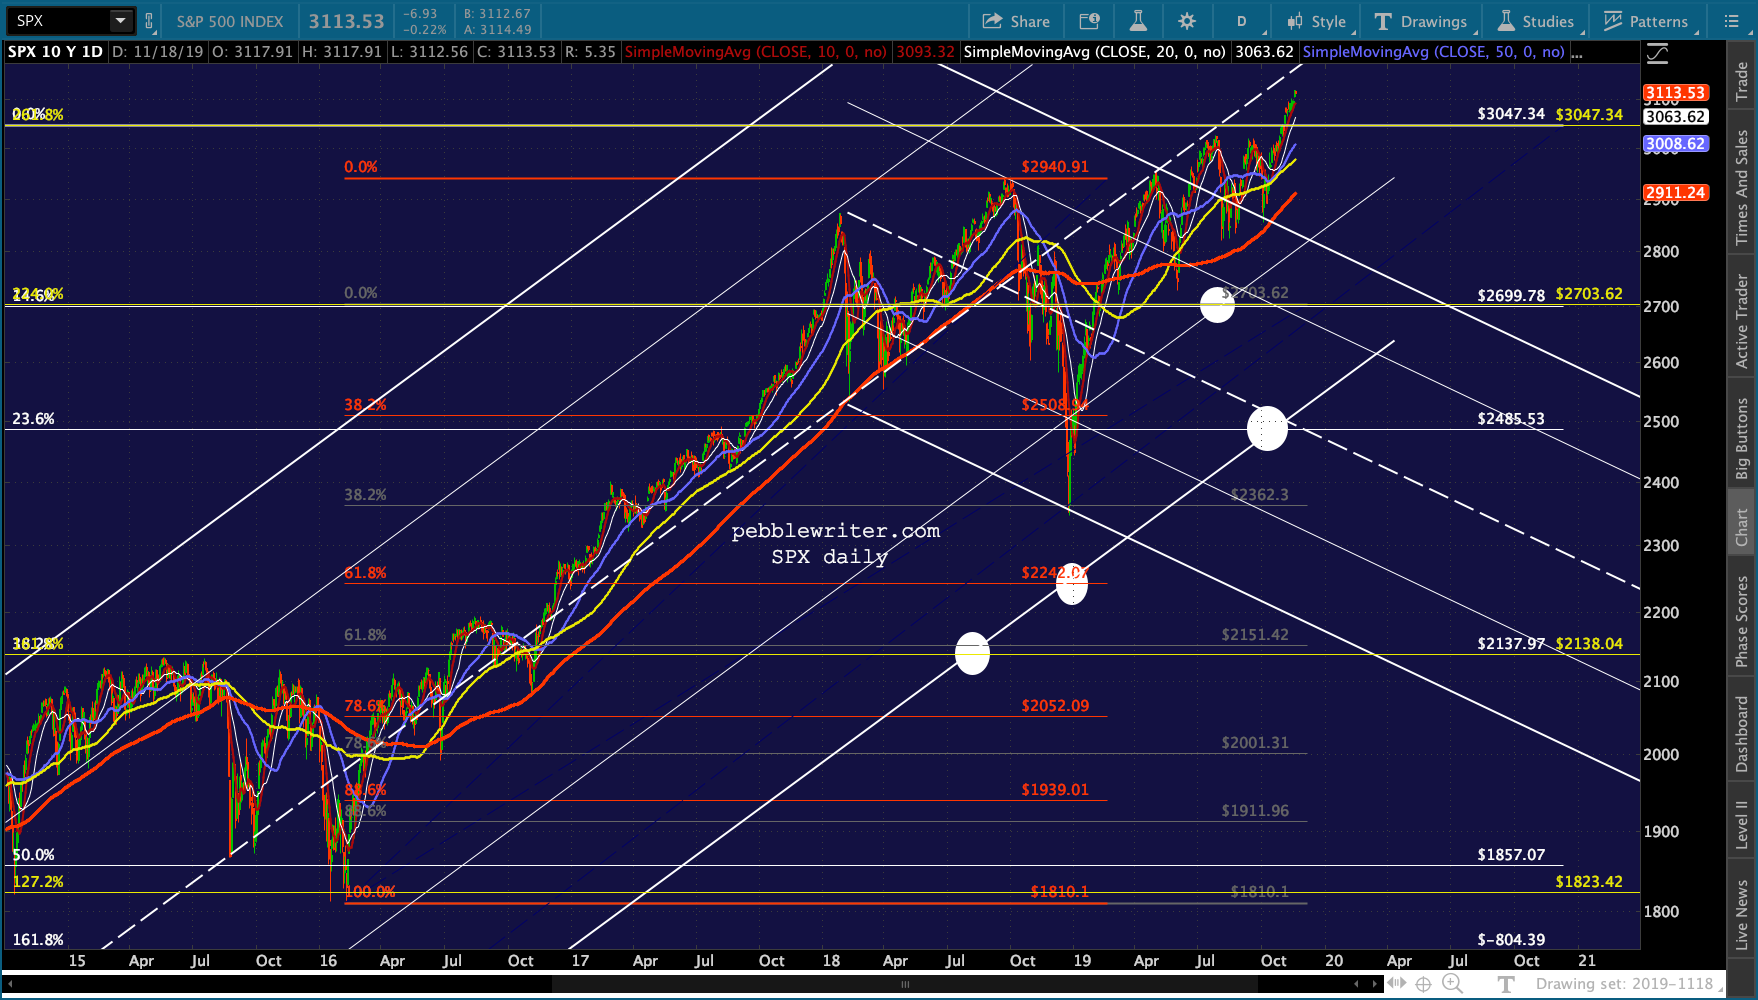 At the end of the day, though, the thing that really mattered was holding the rising white channel — which would sometimes confirm the Fib levels, but often didn’t.
 There have been two similar meltups in recent memory. The first occurred in late 2013 when SPX meltup up through the 1.272 extension at 1823 as though it was irrelevant. As it turned out, nothing could have been further from the truth.
It was ignored when SPX pushed through it on Dec 23 on its way to new all-time highs just in time for the year-end headlines. 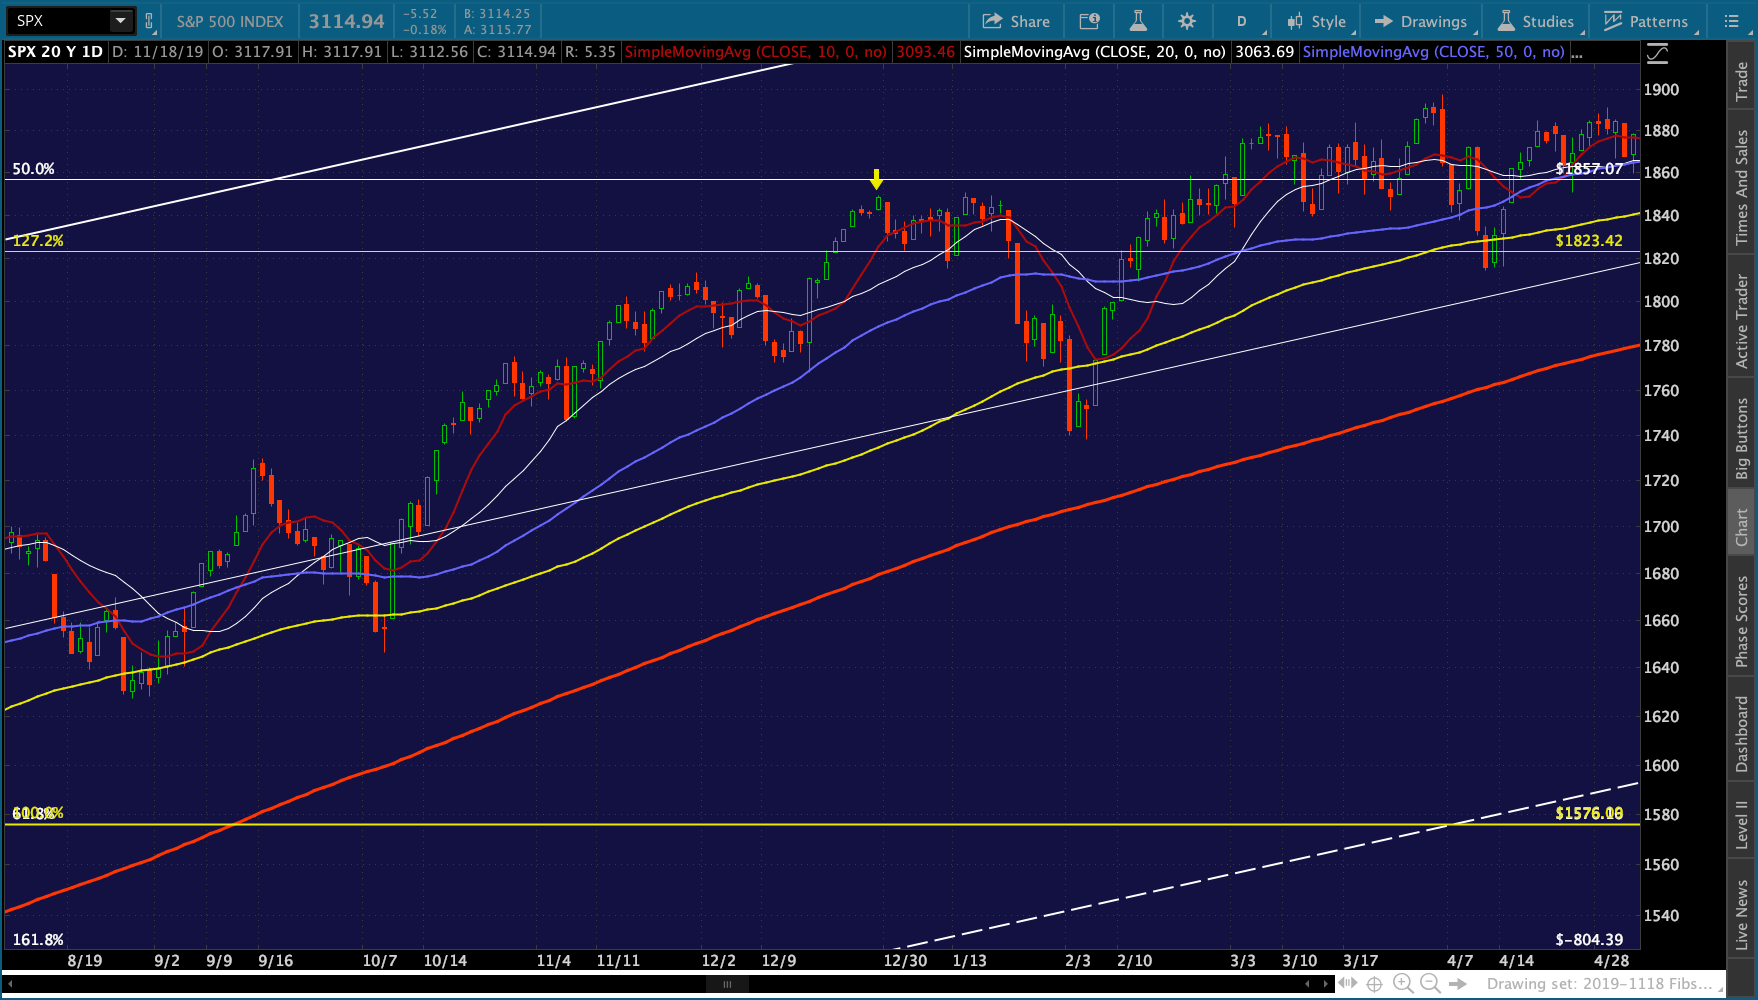 It closed with 1.08 of its all-time high, then tumbled 5% by early Feb — overshooting the backtest by a wide margin. It would backtest it again in Apr 2014, Oct 2014, Jan 2016 and Feb 2016.
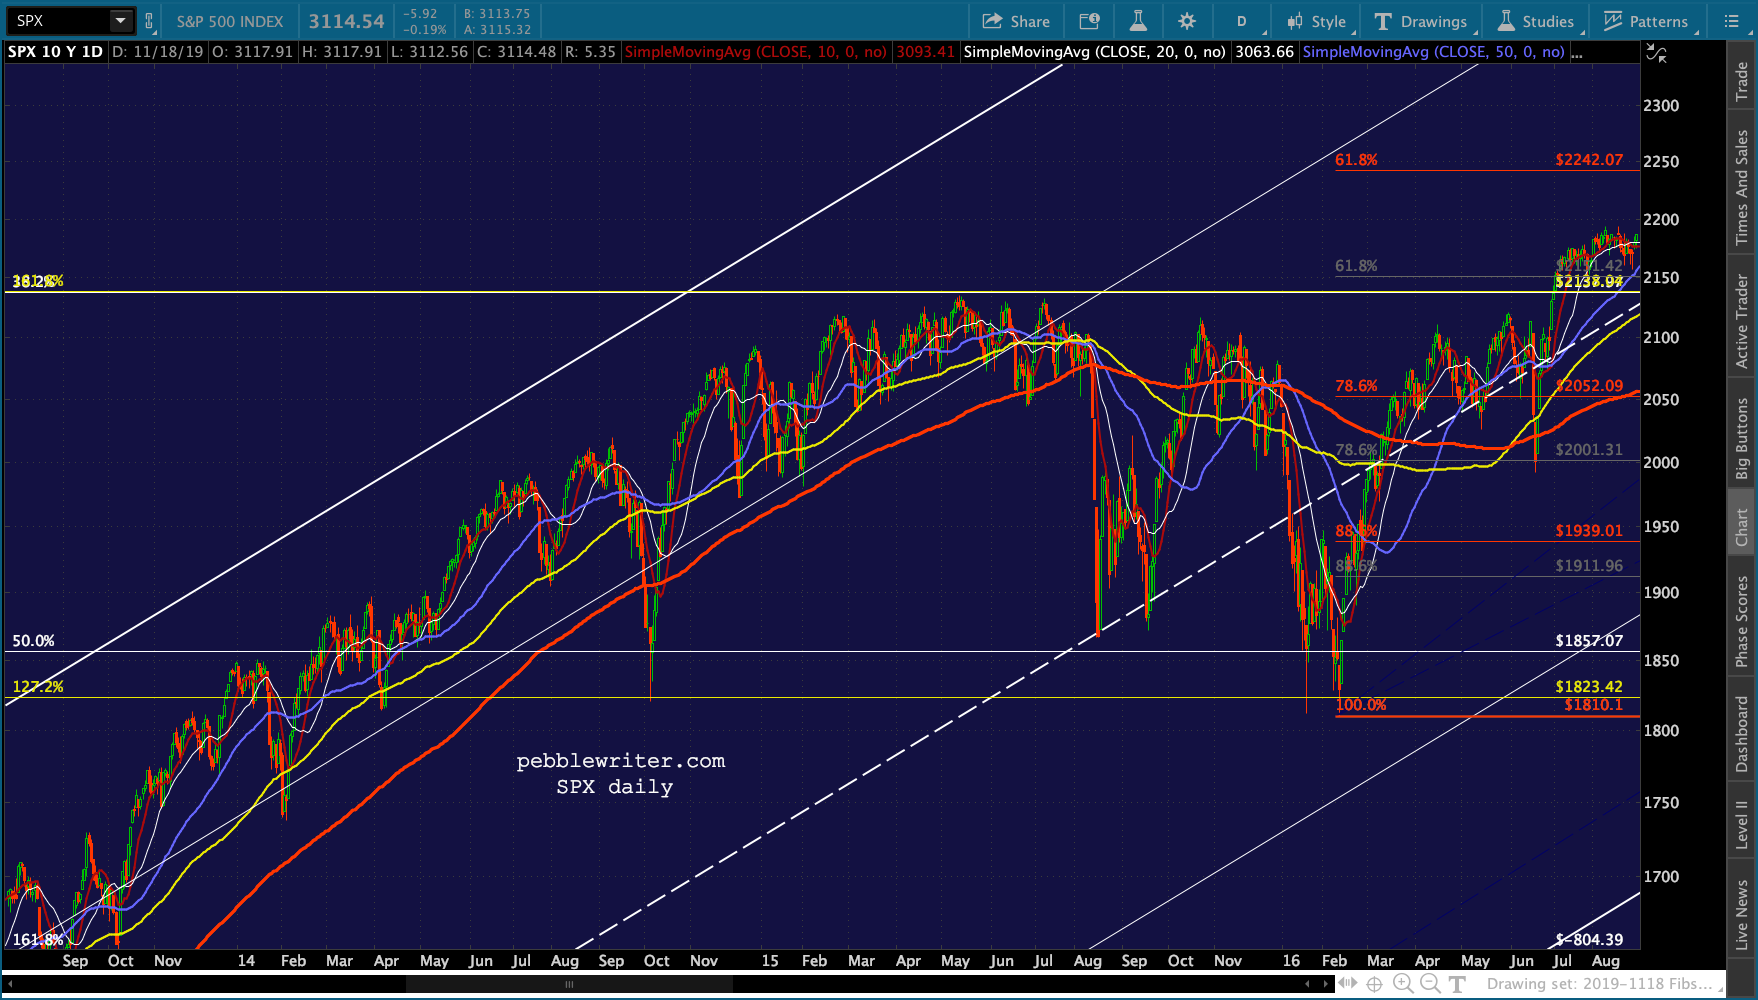 This was a tough trading environment as you didn’t know what to pay attention to and whether or not the Fib should matter. Furthermore, there were some very compelling bearish signals from other fronts [see: Eye Candy for Bears.]
In the end, the bottoms were very well captured by the SMA100 and a TL connecting the 6/24/13, 10/9/13, 1/31/14 and 8/7/14 lows. Several of the highs were also defined by a TL.
Given all that, how should one invested/traded during this period? This was essentially 2 years and 4 months of frustrating chop.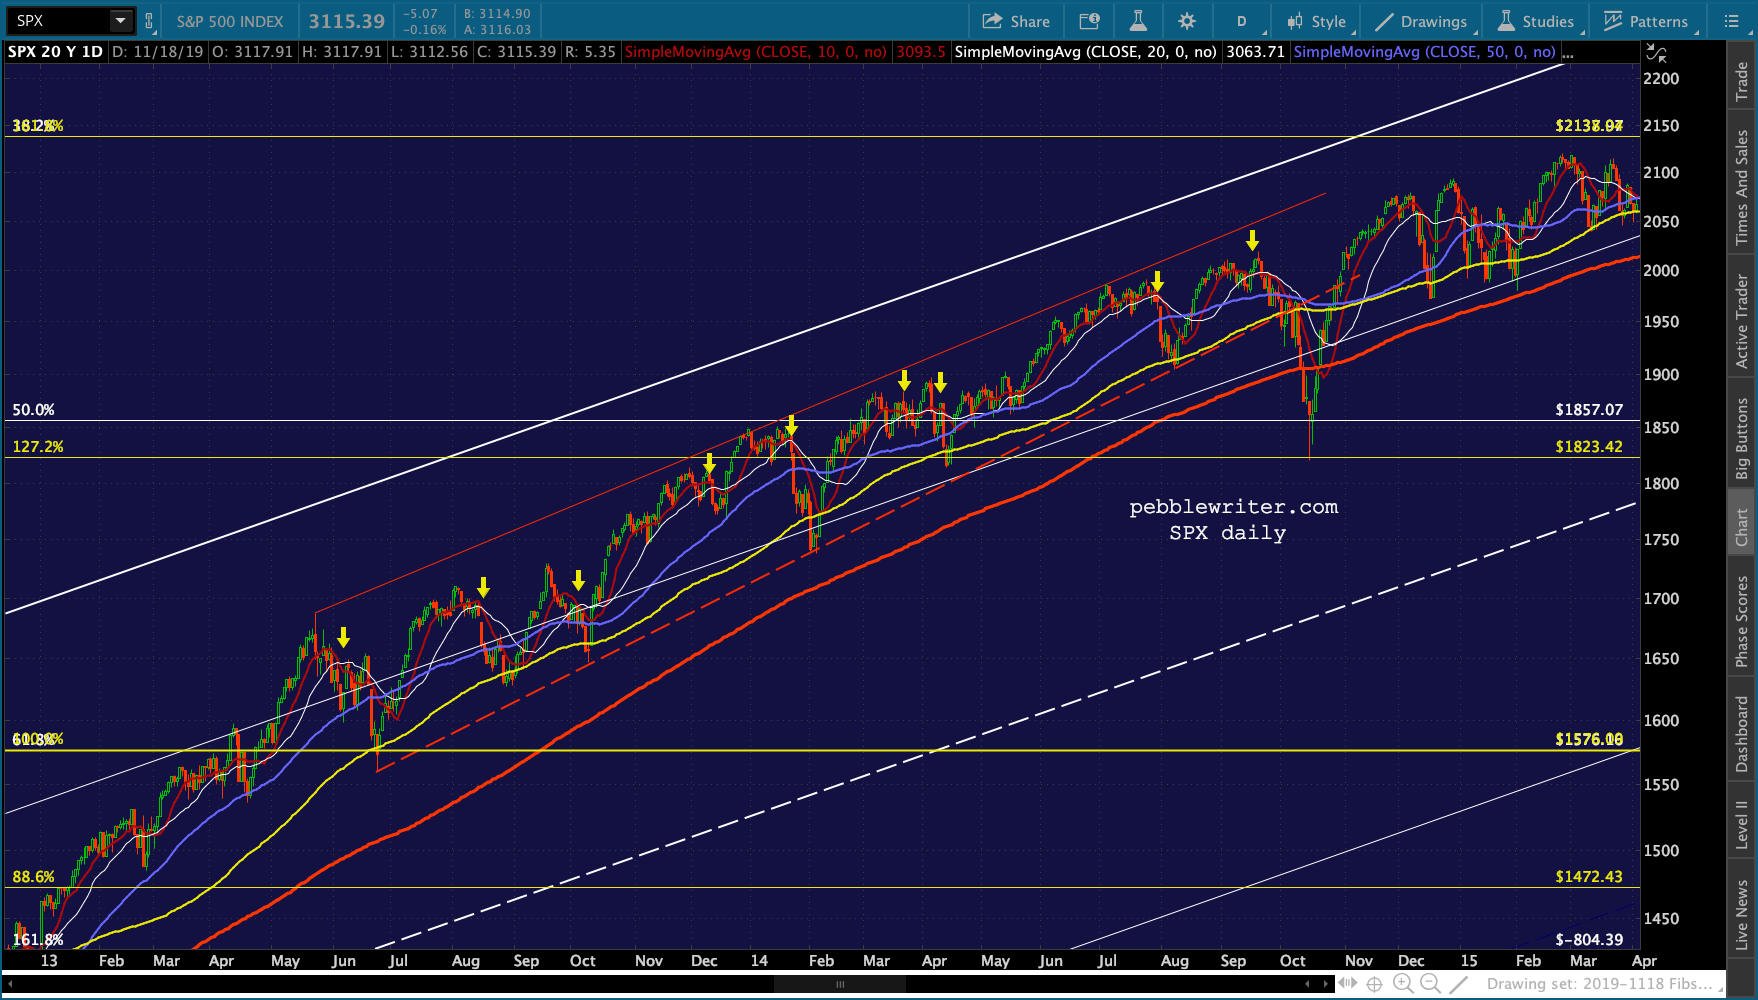 If, after the Nov 2012 test of the SMA200, you went long every time SPX rose above it and shorted every time it dropped below, you would have done pretty well. There were headfakes, but if you didn’t mind jumping in and out, it was pretty profitable. Assuming you switched long/short positions every time there was a close above/below the SMA200 (a total of 7 transactions) the total return between Nov 2012 and Aug 2015 would have been 61%.
[This is admittedly an exaggeration, as you don’t usually know when SPX crosses the SMA200 whether or not it will close above it or below it that day. But, we’re just spitballing for comparison purposes.]
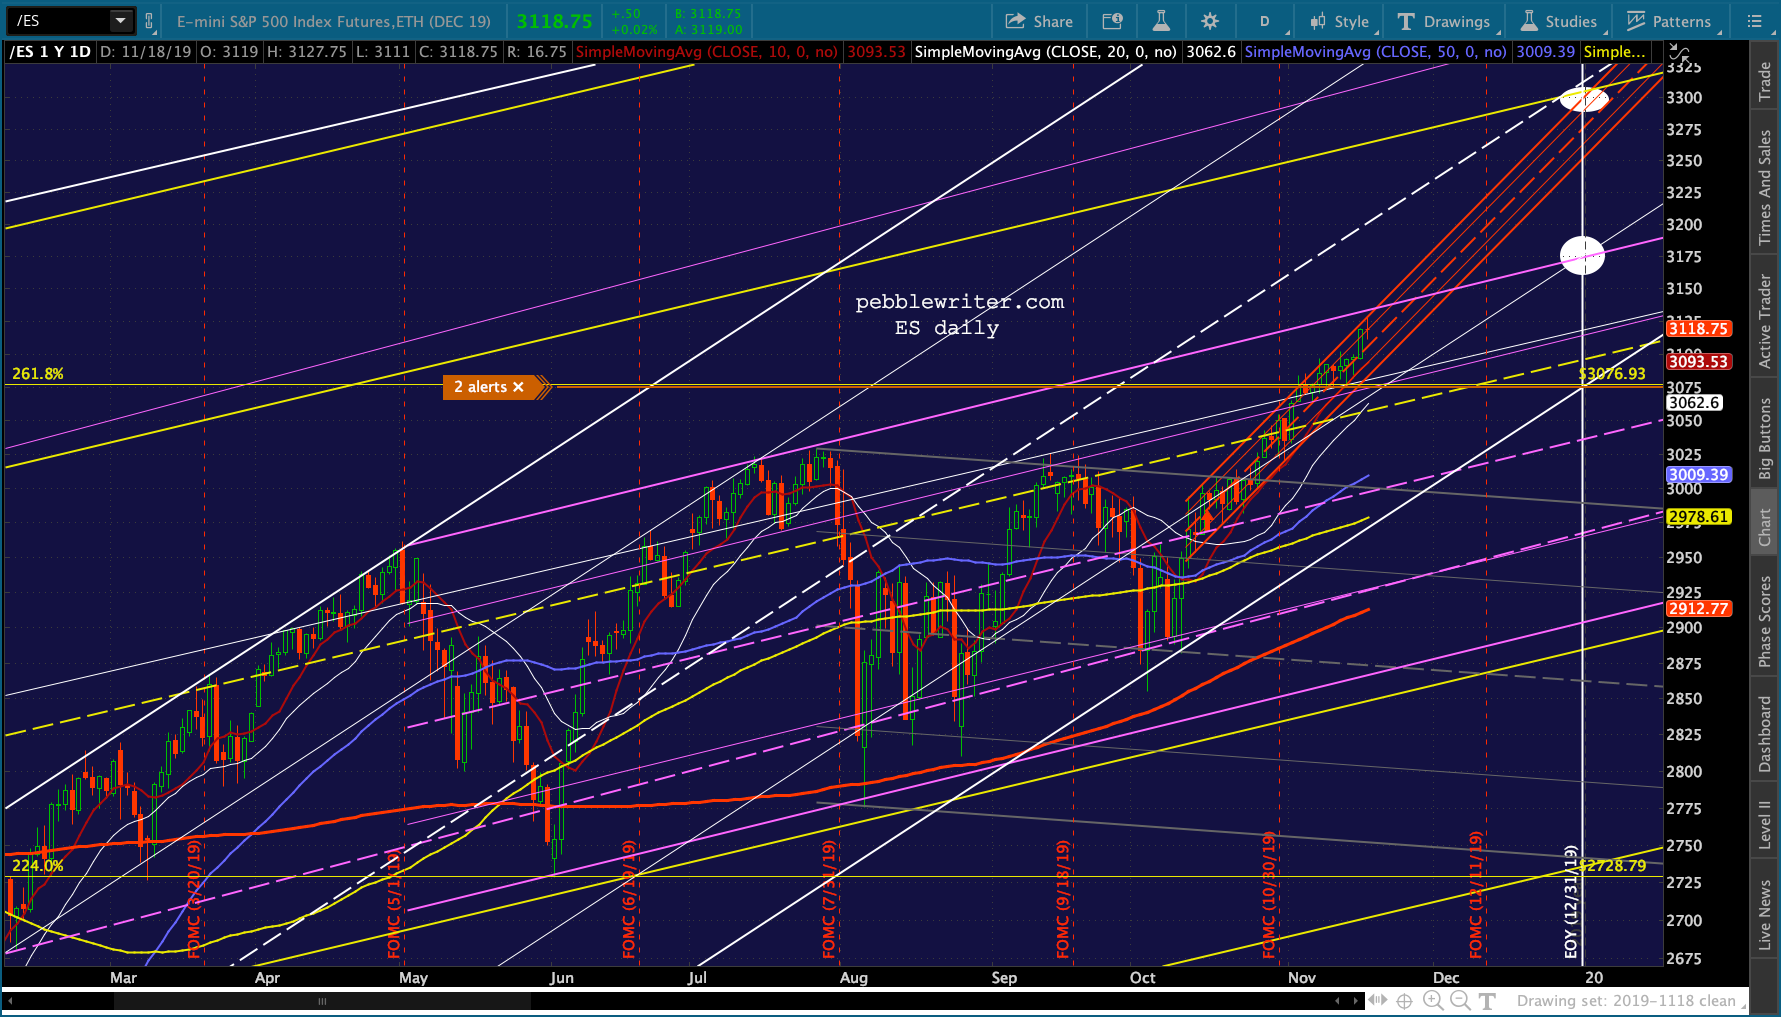
Using the SMA100 instead would have yielded almost exactly the same returns but would have increased the number of transactions unless you established some guidelines as to when to trade. Between 11/30/12-12/31/12, for instance, there were 11 separate times when it crossed and closed on the opposite side of the SMA100. This strategy, therefore, would have generated a huge amount of trading, particularly if you throw in all the intra-day head fakes.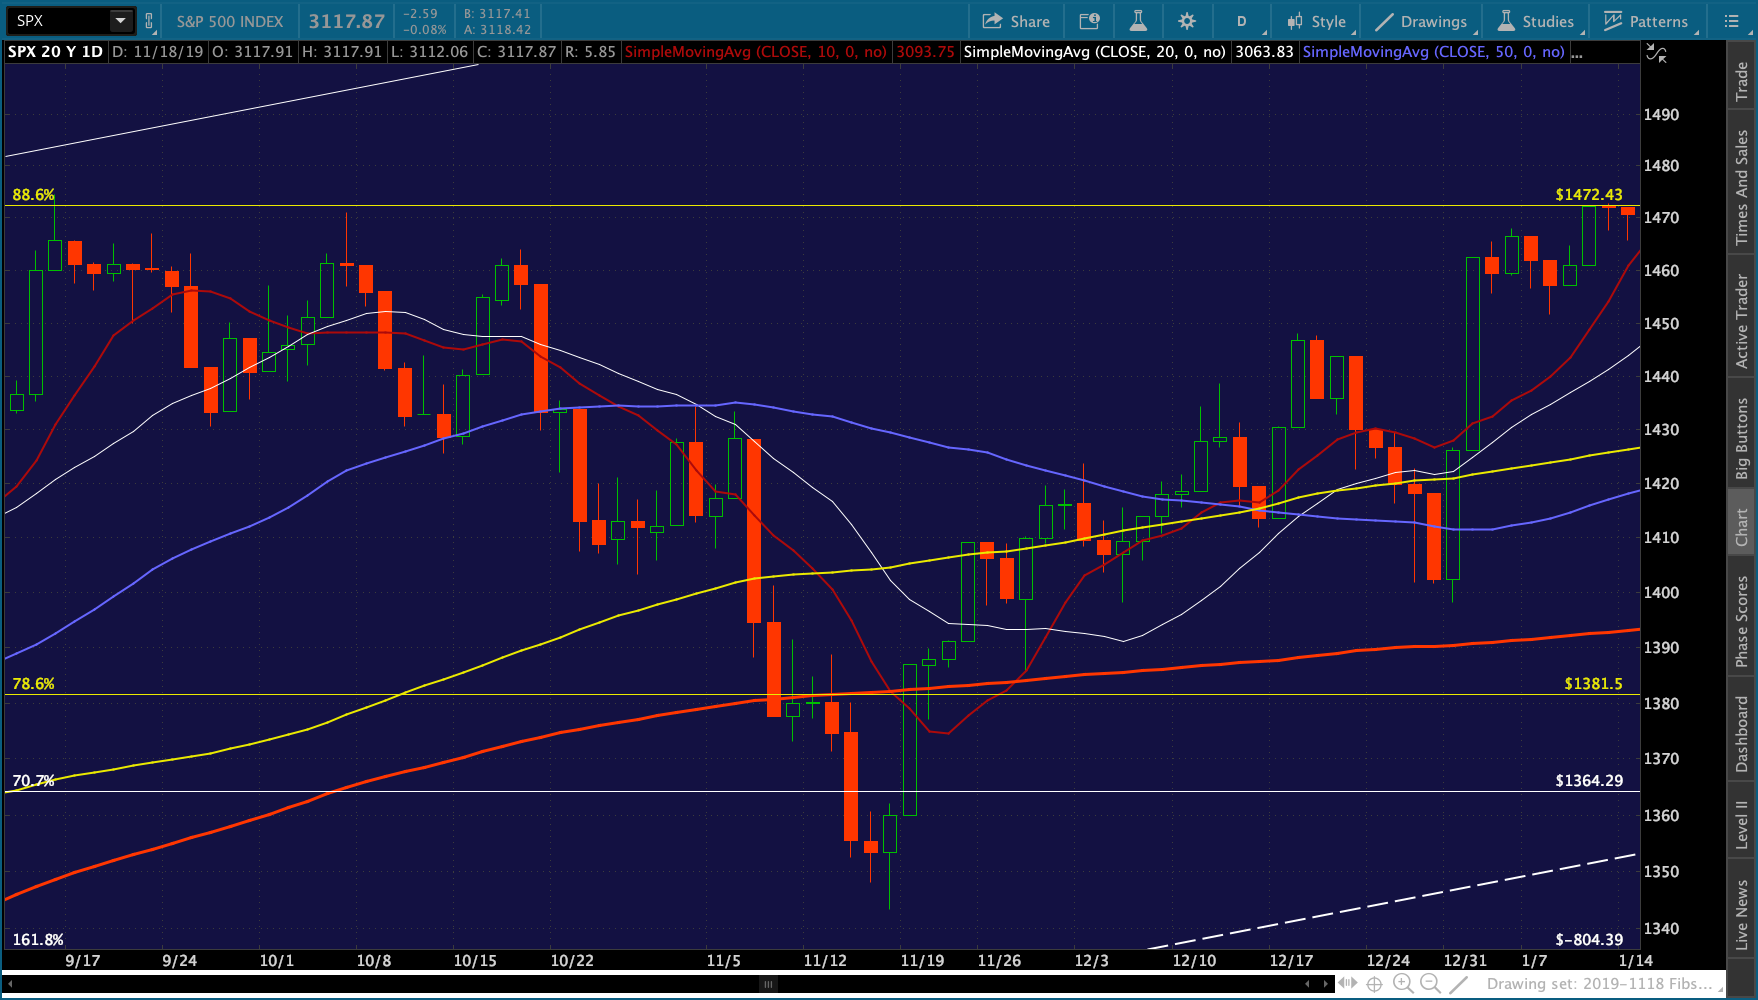 Since we’re currently 4.6% and 6.6% above the SMA100 and SMA200 respectively, the more difficult issue for traders is how to decide when to go short. They key elements right now are the SPX 2.618 at 3047.34, the ES 2.618 at 3076.93 and a sharply rising channel which has been guiding the price action for both since Oct 11. ES’ and SPX’s SMA100 and SMA200 are roughly the same.
Looking back at 2012-2015, one useful tool was the SMA10/SMA20 cross. The yellow arrows in the charts above were pretty helpful in indicating when a meaningful downturn was about to occur. Once SPX pushed back above the .886 on 1/17/13, there were very few times it sent a false signal — particularly if you set a second criterion: SPX being below its SMA10.
On 2/28/13 and 3/1/13, for instance, the SMA10 (thin red line) dipped below the SMA20 (white line) but SPX never closed below the SMA10. Therefore – no sell signal.
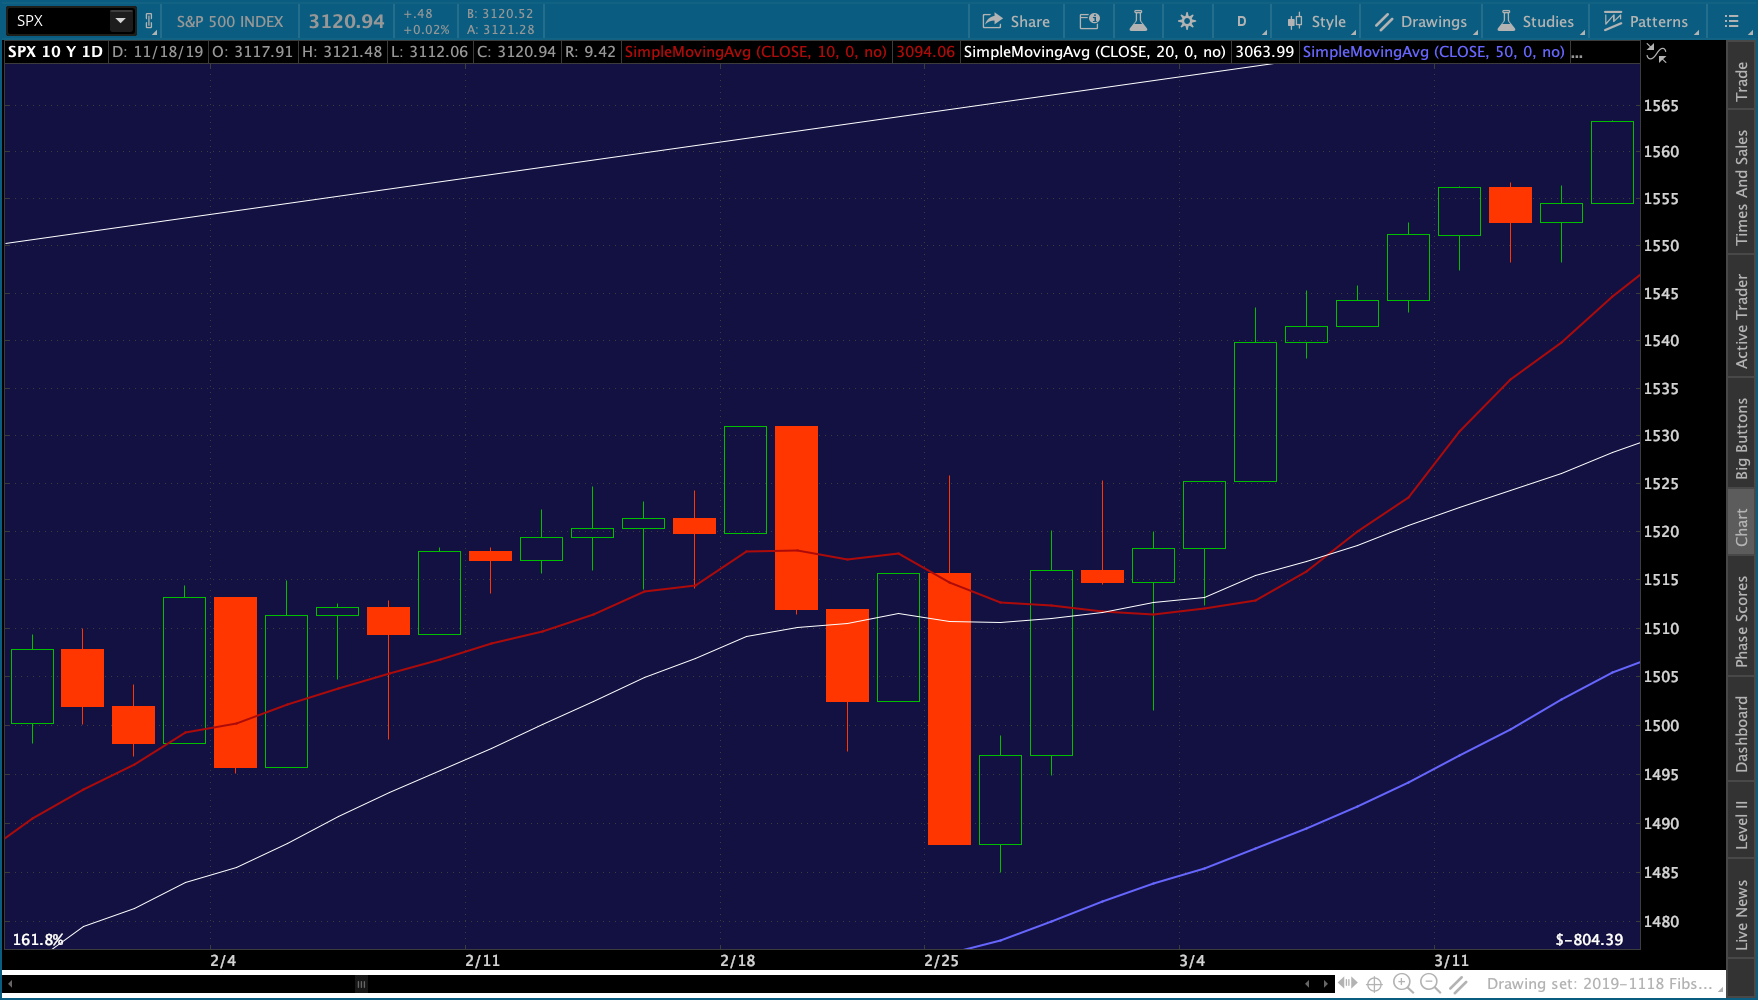 There was a bit of churn at various times such as between Jun and Oct 2013…
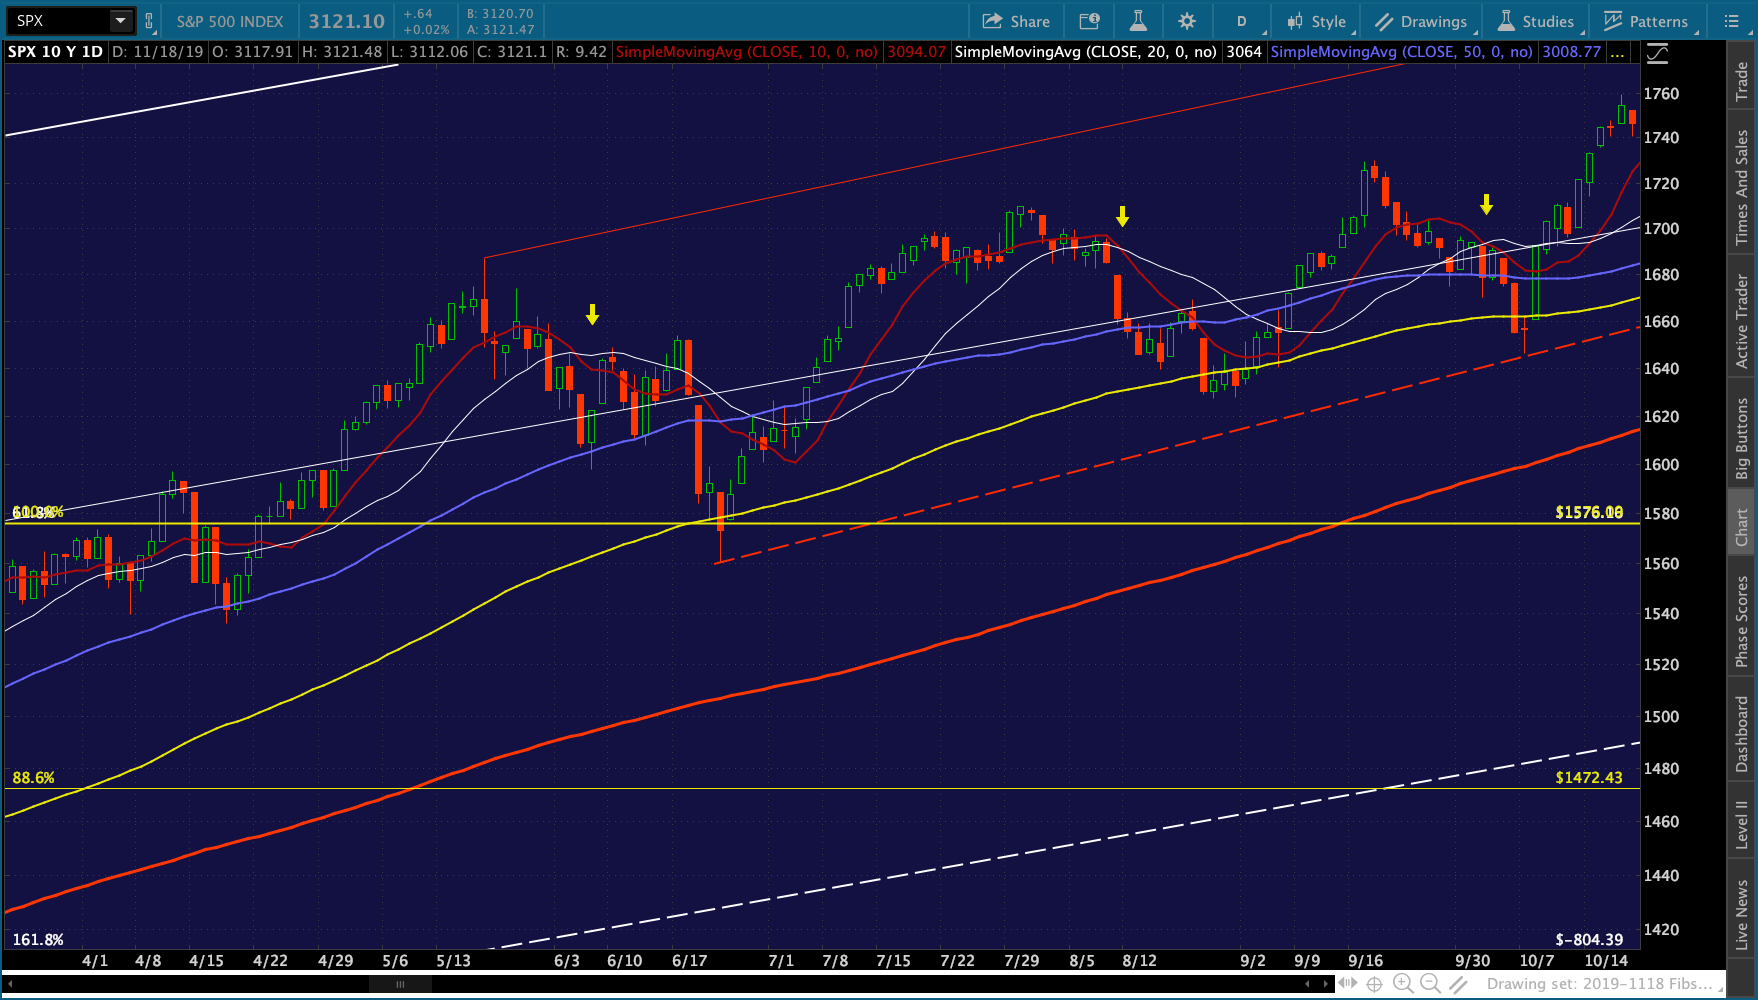 …but, covering your short after the cross unwound (i.e. turned bullish) was usually able to prevent a loss. Throw in another criterion such as cover when SPX moves back above the SMA10 or SMA20 — even if the cross hasn’t yet unwound — would have prevented almost all losses.
Frequently SPX would gap higher the day after it closed right up against the SMA10 or SMA20 in advance of a bullish cross or after recently reaching some other support (e.g. the TL, SMA100 or SMA200.)
This system worked pretty well during 2018. The red arrows indicate a bearish cross, the yellow arrows a bullish one. It could have been improved on by adding the close above/below SMA10 or SMA20 rule. Adding in the SMA100 and SMA200 rules would have helped quite a bit, as would paying attention to the 2.24 Fib at 2703.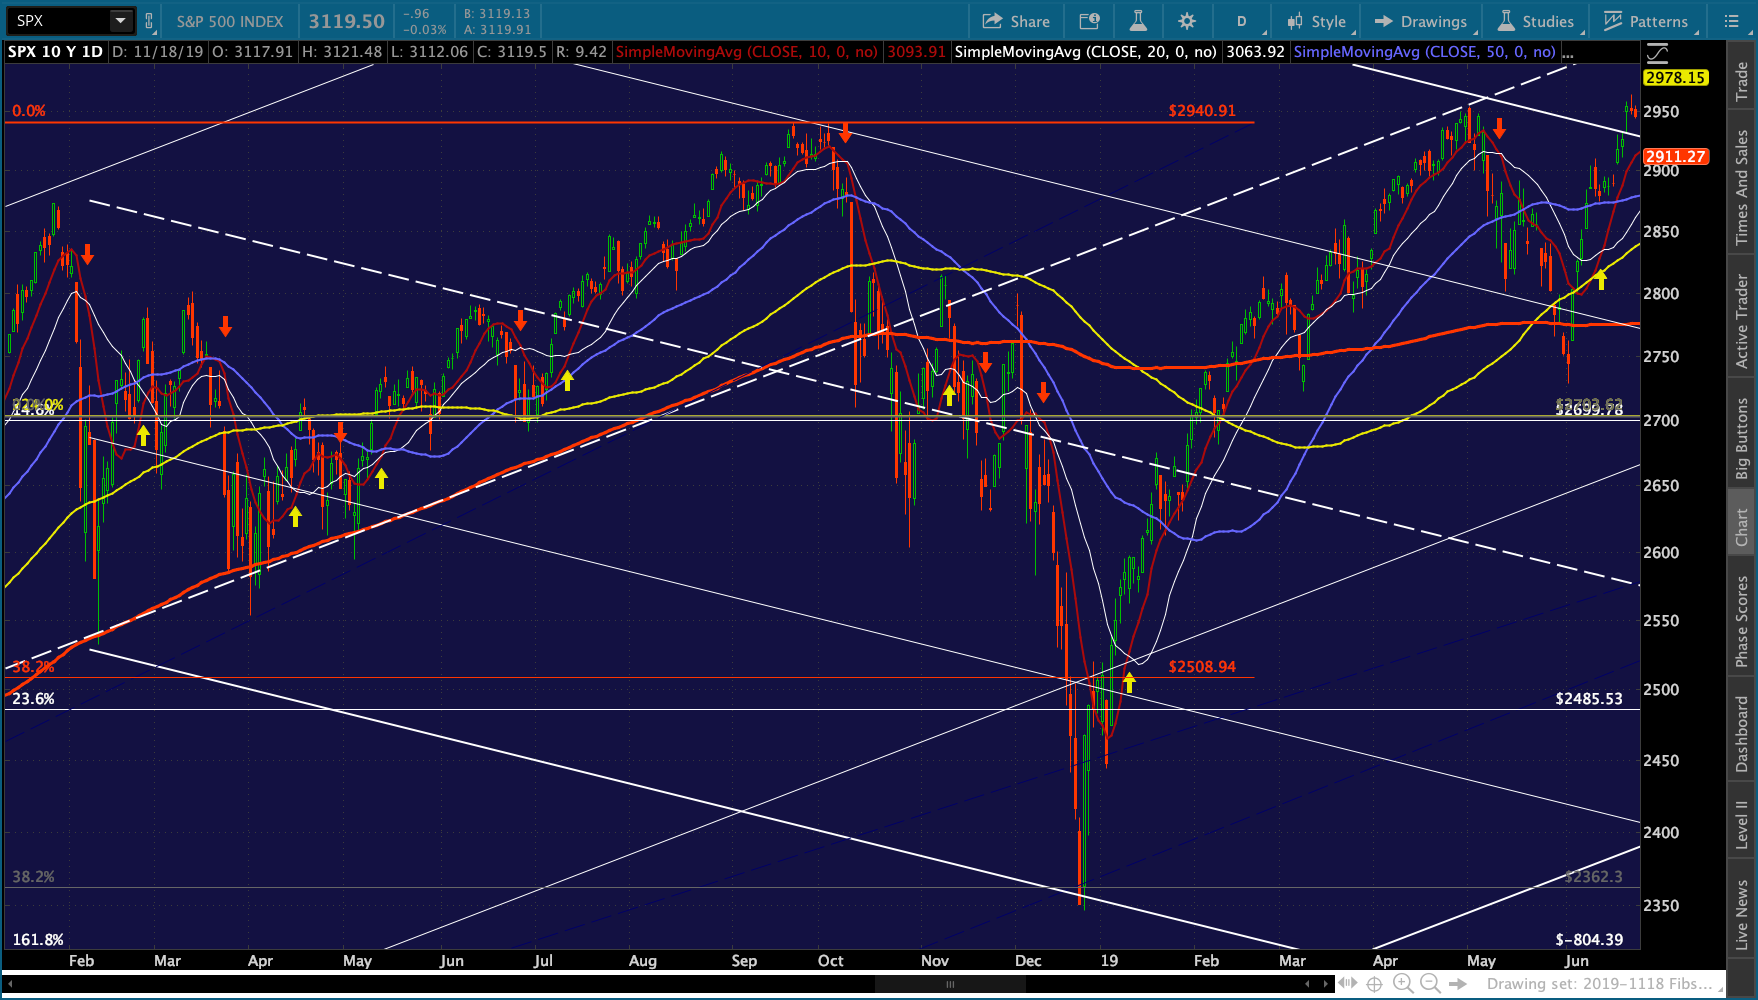 Lately, the 10/20 cross has worked very well. When I last posted a similar chart on Oct 16 [see: Market Timing] SPX was about to experience a bullish cross. At that point, it hadn’t yet broken to new highs but it was close to its Jul 26 highs. As I noted at the time:
Bears should be concerned at this point as one or two more days of this kind of ramping will result in VIX and SPX both experiencing a 10/20 cross which tends to unleash more buying.
Of course, with the 2.618 Fib extension just above at 3047, we couldn’t know whether the buying pressure would result in a breakout or not. But, it was a solid warning, especially since VIX had just broken below its SMA200 and experienced its own 10/20 cross.
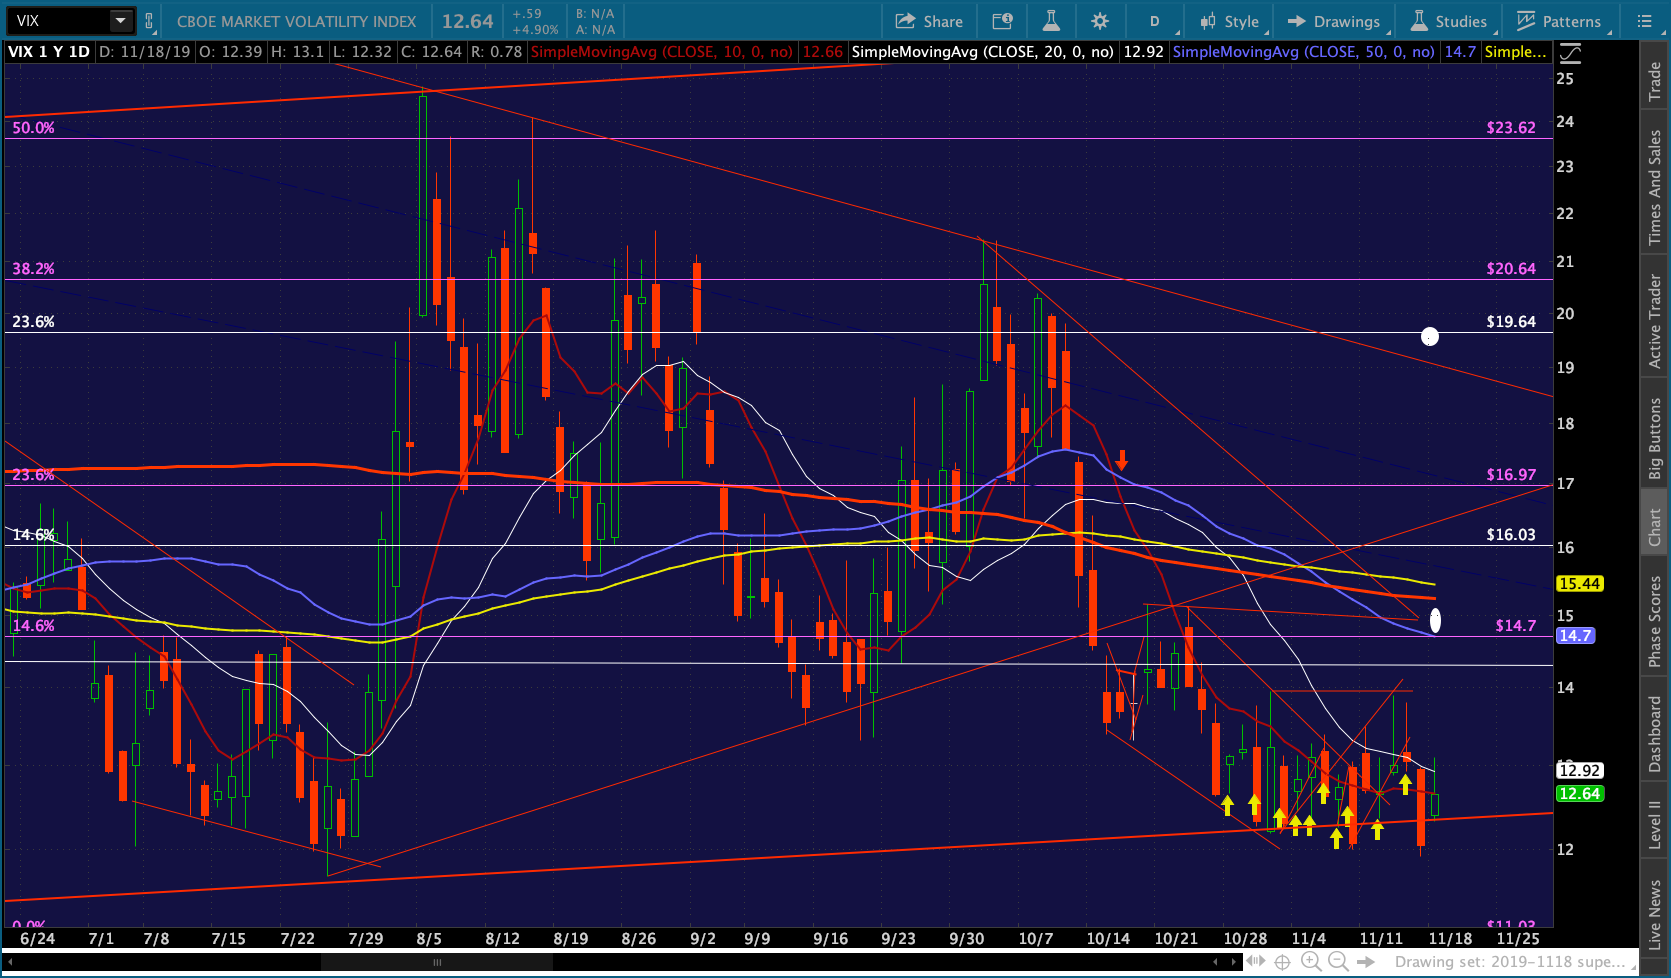 Put it all together, and this is where we stand:
- SPX is above both its SMA10 and SMA20.
- SPX hasn’t traded below its SMA10 since Oct 10
- SMA10 is above SMA20, a bullish indicator
- SPX gapped up through its 2.618 without any difficulty
- the conditions which enabled the gap higher still exist
- SPX is bouncing around within a rising channel
- it didn’t backtest the 2.618 when SMA20 reached 3047 on Nov 13
- the SMA50 should reach 3047 in mid-December
- the SMA100 and SMA200 won’t reach 3047 until at least Jan 2020
- While it is overbought, SPX’s RSI has broken out
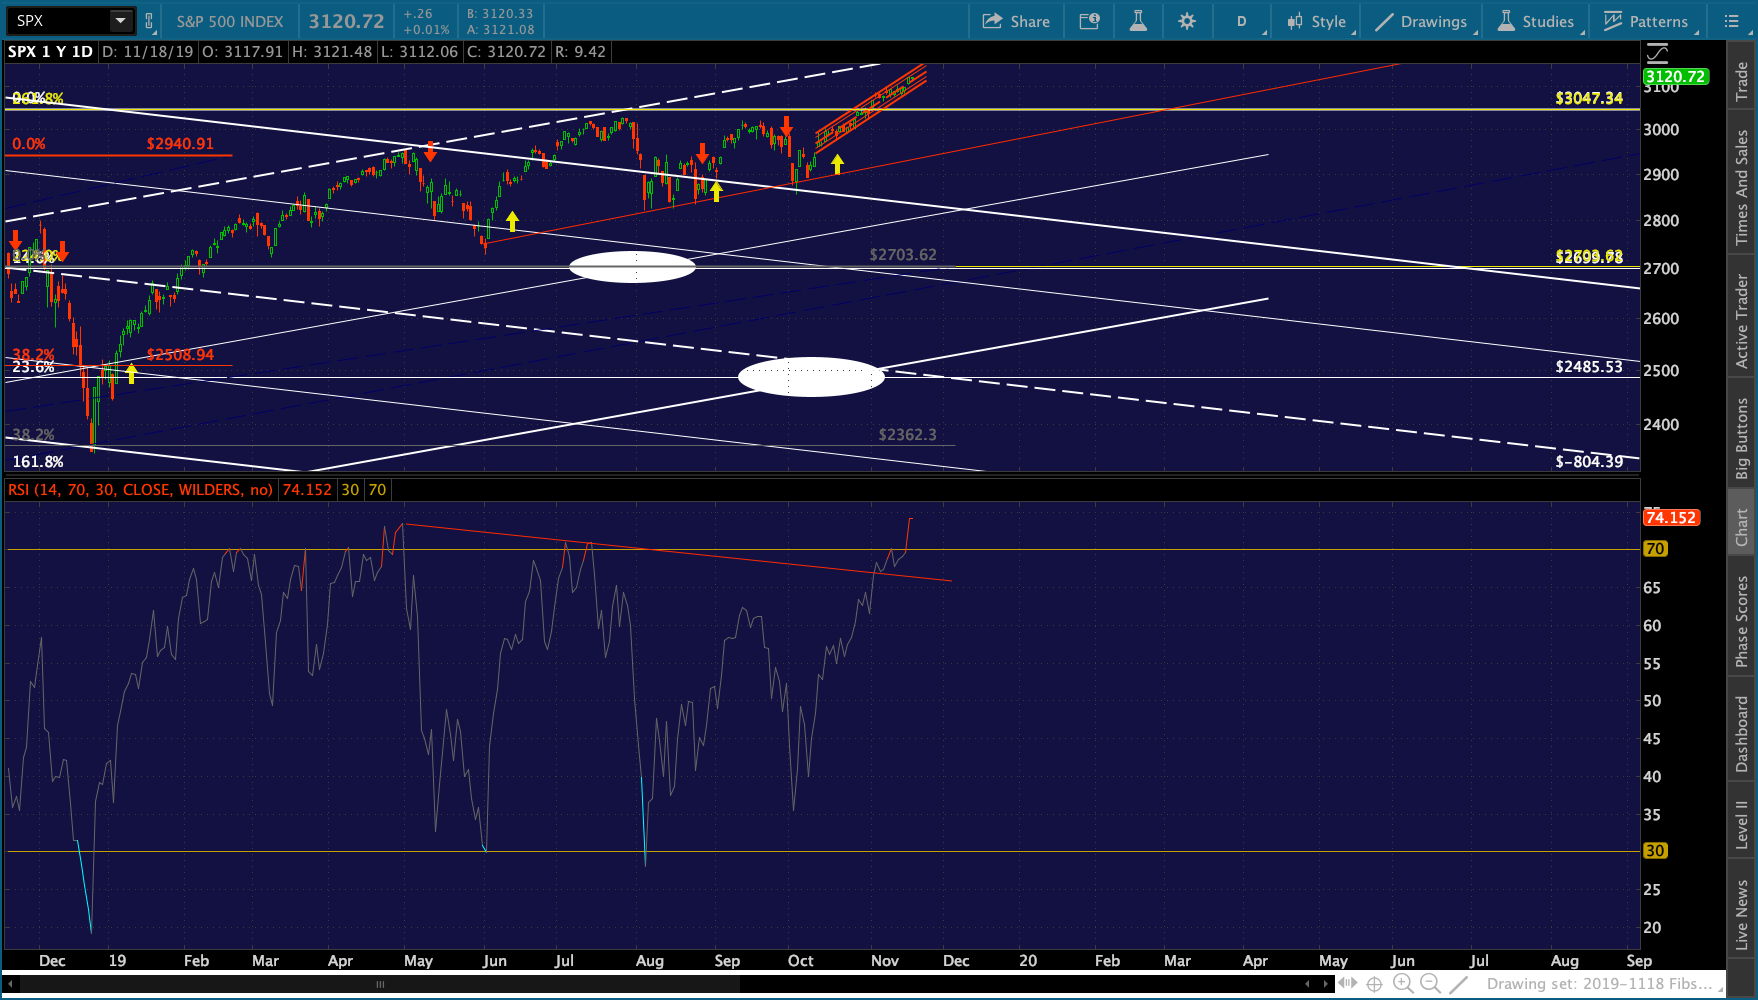 In 2014, SPX first backtested its 1.272 on the 8th session after closing above it. It backtested again on the 13 day and on the 20th day. On the 21st day, it dropped through and closed well below it. By then, however, the 2013 year was in the record books.
There are 29 sessions left in 2019, so I wouldn’t assume we’re going to get a major reversal between now and then — though we could. At this point, SPX is 2.5% above the 2.618 Fib (1.6% for ES), so it would be a very minor correction. Though, TPTB might be hesitant to break trend and open the door to a larger correction.
ES is coming up to a decision point – the red channel or the purple. We should find out in the next session or two.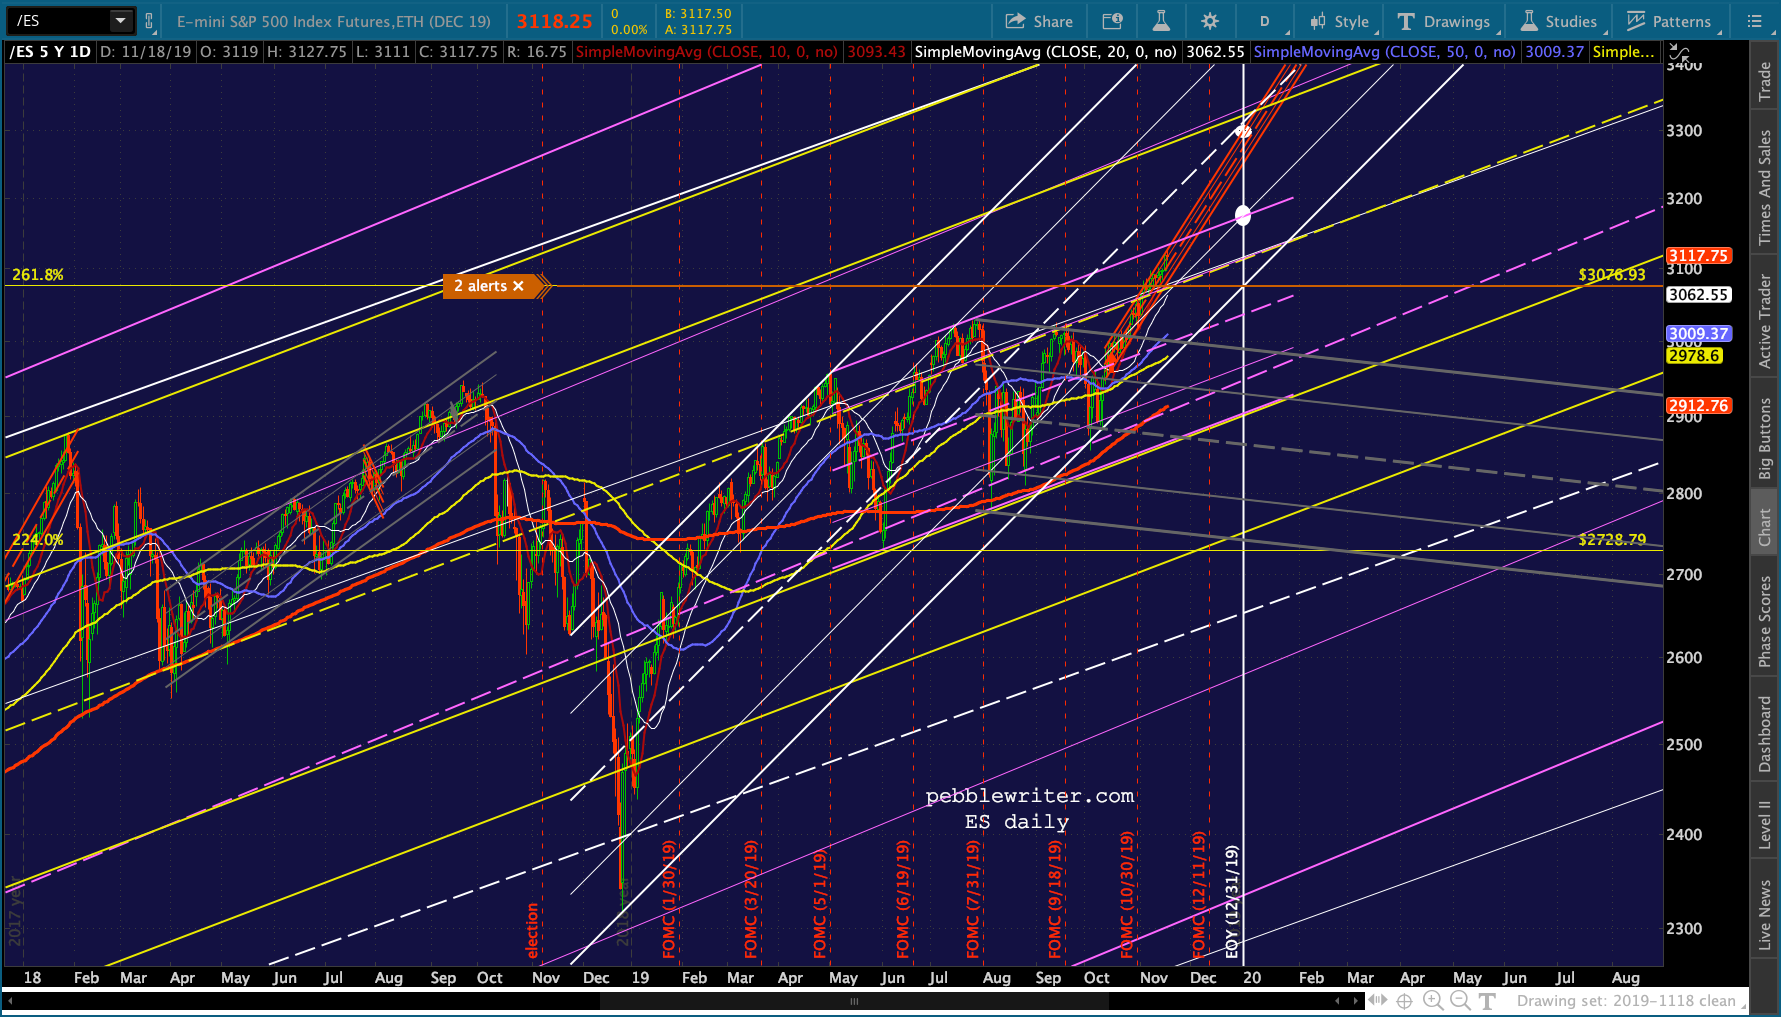
 GLTA.
GLTA.