

Traders around the world are breathing a sigh of relief, this morning, after the market narrowly averted a disaster yesterday.
The day started normally enough, with a gap higher on an 11.4% plunge in new home sales. But, after gaining about 7 points, SPX started slipping. At 12:09, it began what can only be described as a bloodbath, plunging 3.29 points in only 25 minutes. Fortunately, it bounced at the bottom of a well-developed rising (is there any other kind?) channel shown below in purple. But, the scare wasn’t over. Ten minutes later, it began dropping all over again. This time, it fell below the channel bottom (the yellow arrow.) By the time the dust settled, it had plummeted a gut-wrenching 4.13 points from the 2400.85 highs (where it deserved to be.)
Traders were heading for the nearest windows when, quite by coincidence, USDJPY and CL suddenly began to spike (the yellow arrows) higher — a completely natural consequence of lower stock prices because….well, just because. 
 Fortunately, SPX was able to close with a much-too-modest 4.40-point gain. Traders unanimously agreed it wasn’t enough. But, as one veteran floor broker exclaimed, “just imagine if it had closed up only 3 points…what a disaster that would have been!”
In related news, the FOMC’s minutes will be released today. According to insiders, they will reaffirm how well the economy is doing, but underscore the continuing need for extraordinary measures that might or might not involve somewhere between 2 and 25 rate hikes later this year. Or decade. Depending.
* * *
While somewhat tongue in cheek, the above accurately describes what happened yesterday — and, nearly every day — to prevent any loss of momentum. The purple channel did break down. USDJPY immediately broke out above a four day-old trend line that is of no significance other than it gave USDJPY something to break out above.
And, CL, which had reversed below its SMA100 and was rightfully heading lower — probably on leaks of the upcoming API inventory data — suddenly did an about face and spiked higher. It topped the SMA100 and rallied until the very minute the cash markets closed.
Ignoring longer term trends and underlying fundamentals, USDJPY and CL are employed almost every day to signal sensitive algorithms to initiate buying. Once it a while, they are unable to help, and VIX is utilized instead.
Once a reliable indicator of risk, VIX is now just a tool for propping up stocks. Central banks and their functionaries simply hammer it until the algorithms react. And, they do — nearly every time.
We had an excellent example just last month when SPX, after breaking down weeks before, gapped out of a falling channel (purple oval) and went on to register new, all-time highs. It was made possible by VIX which, in the middle of a spectacular 41% collapse, broke down below the bottom of a rising channel that dates back to February. When SPX ran out of steam and was allowed to backtest the broken channel (the white dot), it was another collapse in VIX — this one only 36% — that ensured a strong reversal.
 As we illustrated in How Broken is the Market? and, again, in It’s War!, VIX has made a habit of plunging below the bottom of a long-term channel (in yellow, above) every time stocks need support.
Once upon a time, dips below the channel bottom represented extreme complacency and signaled an impending top. In the past five months, however, over 50% of the sessions featured a dip below or a continued stay below the channel bottom (the yellow arrows, below.)
It started when a channel broke down in order to prop up stocks following the US election, and has only accelerated since. In the past month, a stunning 20 of 23 sessions were spent below the channel bottom.  “Trump rally?” Nah. VIX was simply hijacked. And, the algos couldn’t care less whether or not it makes sense. They’re programmed to buy when risk is diminished or when USDJPY or CL rally — which is pretty much any time the FOMC, BoJ, ECB or SNB decide stocks need a boost.
In an interview on CNBC’s Fast Money yesterday [CLICK HERE], legendary investor Asher Edelman discussed his belief that the Plunge Protection Team is propping up markets. It was an interesting interview for two reasons.
First, many of us were shocked that CNBC would let the words “plunge protection team” be uttered on its airwaves without quickly cutting to a commercial. Second, the reactions of the CNBC hosts illustrated the general lack of understanding and disbelief around the idea that markets are manipulated.
Just a few days ago, the Wall Street Journal in The Quants Run Wall Street Now illustrated the sea change that algorithmic trading has wrought on the markets. Every day, quants around the world electronically scour mountains of data to discover and quantify factors with reliable predictive power.
 A factor could be something as basic and “big picture” as an increase in GDP. Or, it can be something as obtuse as a devaluation in the yen [see: The Yen Carry Trade Explained], an increase in the value of oil, or a plunge in VIX.
I’ve done more than my share of ranting and raving about the phenomenon over the past few years [a few examples: Manipulation Becoming Laughably Obvious, Did TPTB Crash Oil?, What Really Drives Stock Prices?]
Yet, it’s easy to understand why it’s happening. We had a severe financial crisis. Without intervention, markets surely would have continued melting down in 2009 and we could have suffered through another Great Depression.
The first attempt at intervention — quantitative easing — was big, expensive and somewhat clumsy. But, it carried the side benefit of relieving banks around the world of trillions in toxic assets.
The second — the yen carry trade — was much less expensive but was limited by the inconvenient inflation it threatened on Japan, which imports a great deal of its fresh food and all of its oil (rising inflation is a problem when you’re monetizing your debt and need interest rates to remain at or below zero.)
When the USDJPY finally broke down and stocks plunged, oil became the algo-driver of choice. But, again, higher oil prices became problematic when they forced the FOMC to raise interest rates in order to counter inflation.
When CPI reached 2.7% in January, it confirmed what I had suspected ever since calling a bottom on oil in Feb 2016 [see: USDJPY Finally Relents.] As we discussed in April, the combination of stagnating growth and rising inflation points to a growing risk of stagflation.
 The latest intervention tool, VIX, seems to have no nasty side effects and no natural predators. Its actions have certainly engendered plenty of incredulity. But, aside from speculators and hedgers, its suppression seems to be a victimless crime.
The bottom line is that these tools work, even if they entail undesirable side effects and further inflate the bubbles evident in nearly every asset class. In my opinion, the greater risk is that algos all react negatively when several drivers break down at the same time (e.g., election night.) If they all take in and react to the same information in the same way, it increases the risk of a flash crash that can’t easily be arrested.
At one point, I expected the market’s evolution would undermine the validity of chart patterns, harmonics and technical analysis. To the contrary, it has actually increased their usefulness.
Many traders and even casual chart watchers understand the importance of channels and Fibonacci levels. When a channel breaks down, as was the case in the first chart at the top of this post, it leads to selling. A rally in USDJPY or CL can put it right back on track, giving rise to several trading opportunities: shorting the issue if it does break down, going long if the channel recovers, and trading USDJPY and/or CL in anticipation of their reaction.
When a stock reaches a Fibonacci level that should produce a significant reversal, we can watch VIX, USDJPY and CL for an indication of what to expect. And, again, they themselves can be traded.
There are other factors, of course. And, still more are likely to surface and gain prominence in the future. But, working with just these few has allowed us to generate very profitable trading signals during a time when many frustrated traders and fundamental investors are throwing in the towel.
 Riding along with a rising S&P 500 is profitable. But, it’s much more profitable to be able to guard against or capitalize on even occasional downturns in equities. Even for buy and hold investors, the incremental gains from choosing better entry and exit points can really add up over time.
And, for many clients who actively trade and hedge, it has been enormously beneficial to be able to anticipate moves in currencies and commodities. Not being aware of the signals sent by algo-drivers can be deadly to one’s portfolio, as I learned the hard way in 2014. I can’t tell you how many times I saw a wonderful shorting opportunity evaporate into thin air.
I started this post at 5 AM with the intention of explaining what kept stocks aloft yesterday — a day when the economic news and the tragedy in Manchester should have produced a pause, if not a downturn. And, here, it’s turned into another diatribe. At least VIX has ensured that nothing “bad” has happened while we’re waiting for the FOMC minutes. BTW, don’t be surprised if VIX continues to settle lower, especially if the minutes are perceived to be negative or simply don’t inspire an immediate rally.
continued for members…
UPDATE: 2:00 PM
SPX has essentially flatlined at the .886 Fib. UPDATE: 2:05 PM
SPX is slipping beneath all those SMAs. I’d try shorting here, but be prepared for a bounce at the SMA5 200. I’d cover and step aside on any sustained bounce back above 2400. VIX is sitting right at TL support, and is likely to drop through if necessary.
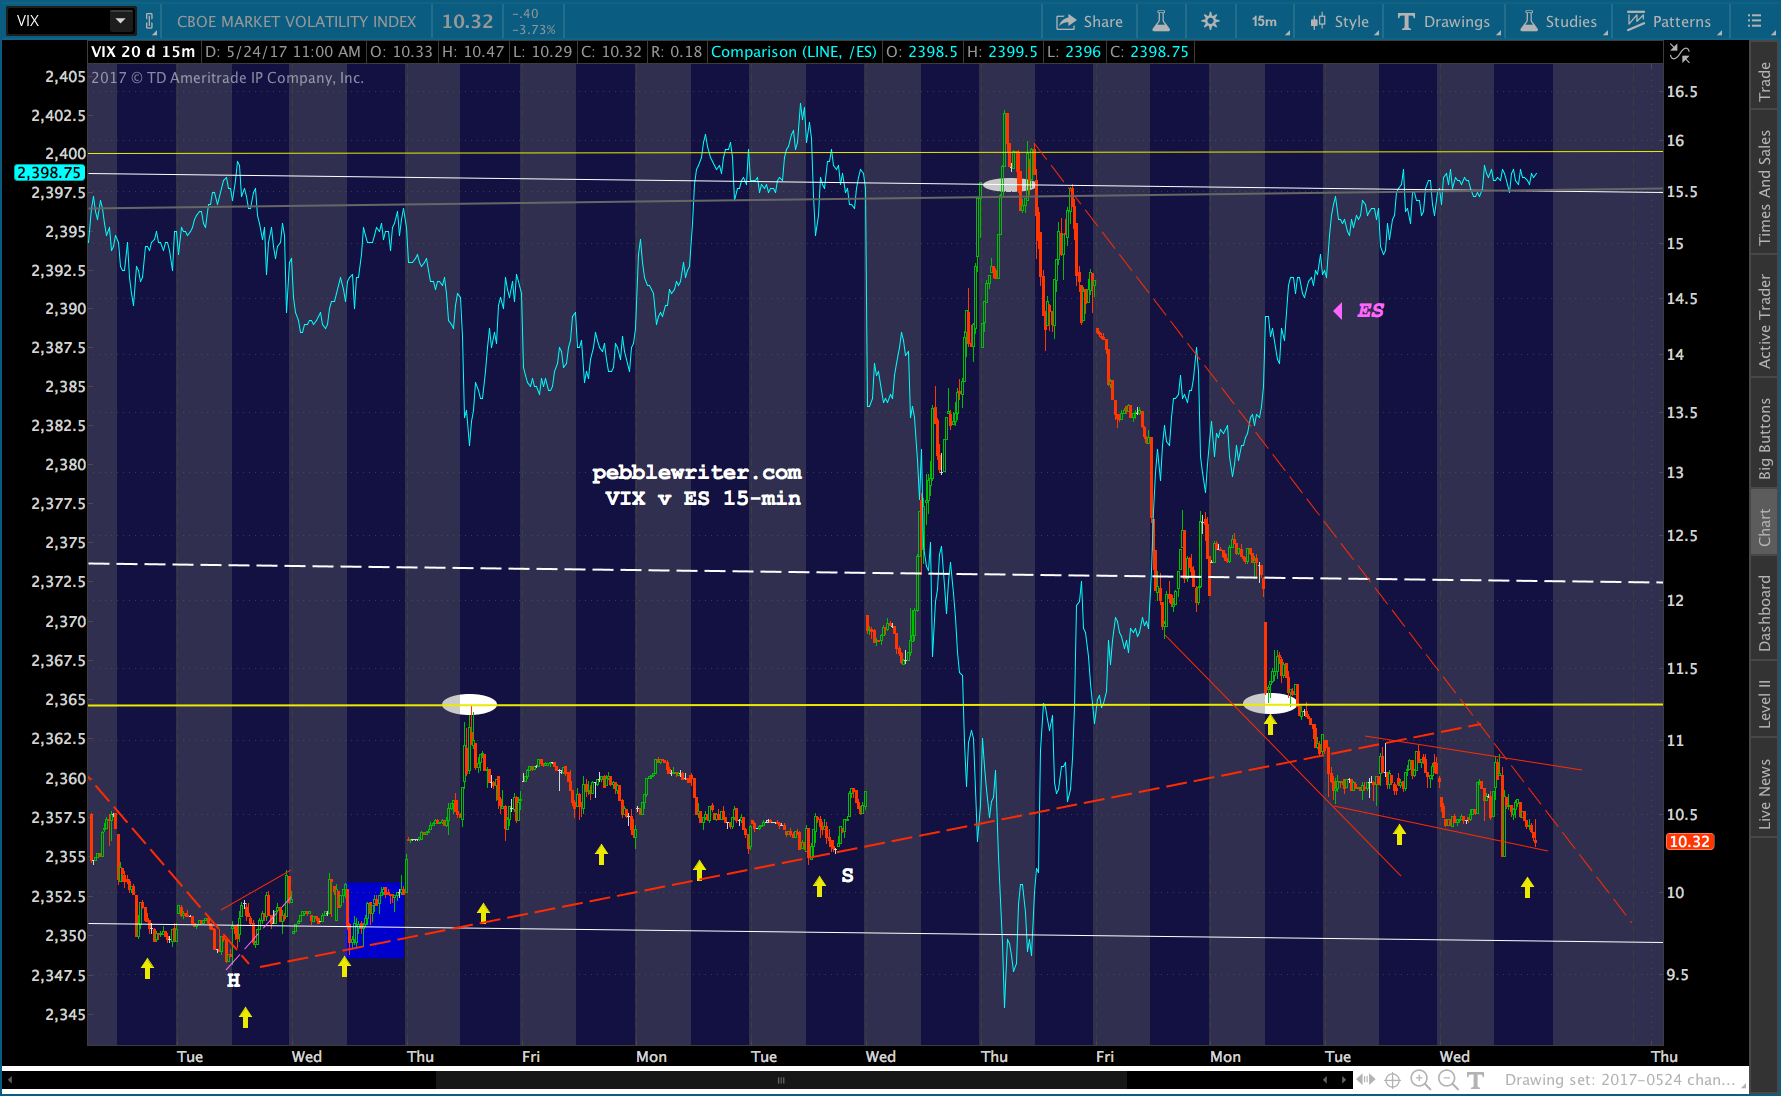 UPDATE: 2:15 PM
Stopped out and sidelined with VIX’s latest dip.
 UPDATE: 3:11 PM
I expect SPX will remain above the .886 until the SMA5 200 gets closer to 2398 or so (this morning’s low was 2397.99.) Technically, one could short here on a drop through the .886. But, there’s a very good chance that it would end at the SMA5 200 or, if not there, at the .786 at 2394.42. If that broke down, then we’d start to look at the .707/SMA20 at 2390.23.
So, nothing wrong with shorting. We just wouldn’t know until after the close, likely, whether more downside is in store and how far it could fall. CL is still above the SMA100, but on a backtest of the broken white channel line after being rejected at the .786. And, note that USDJPY is slumping.


 I haven’t heard anything in the commentary re the minutes that makes me thing they’ll raise rates any time soon. But, I’ll take a while and read through them myself. If others are starting to think, like me, that the economic weakness will delay or eliminate a rate hike, that should take a toll on the dollar.
The USDJPY’s SMA200 could reach the white channel midline at 110.05 by tomorrow. This would be an excellent time to go ahead with that backtest. More later.