

Back on April 25, I posted “How Broken is the Market?” and included the following VIX graphs. The first showed a long-term channel (below, in yellow) the bottom of which was occasionally tagged in times of extreme complacency. Each instance was followed by a correction. I contrasted it with a chart of the same channel which, over the past few months, has been under continual assault. Each plunge below the yellow channel bottom was timed to prop up stocks or push them up past resistance.
At the time, the North Korean situation was heating up. It seemed that a return to the falling white channel top was in order, so I put a dot there at 18.50ish and labeled it “War?” I had no idea at the time that the “war” which would ratchet VIX up to such lofty heights would be one between politicians. Yet, here we are.
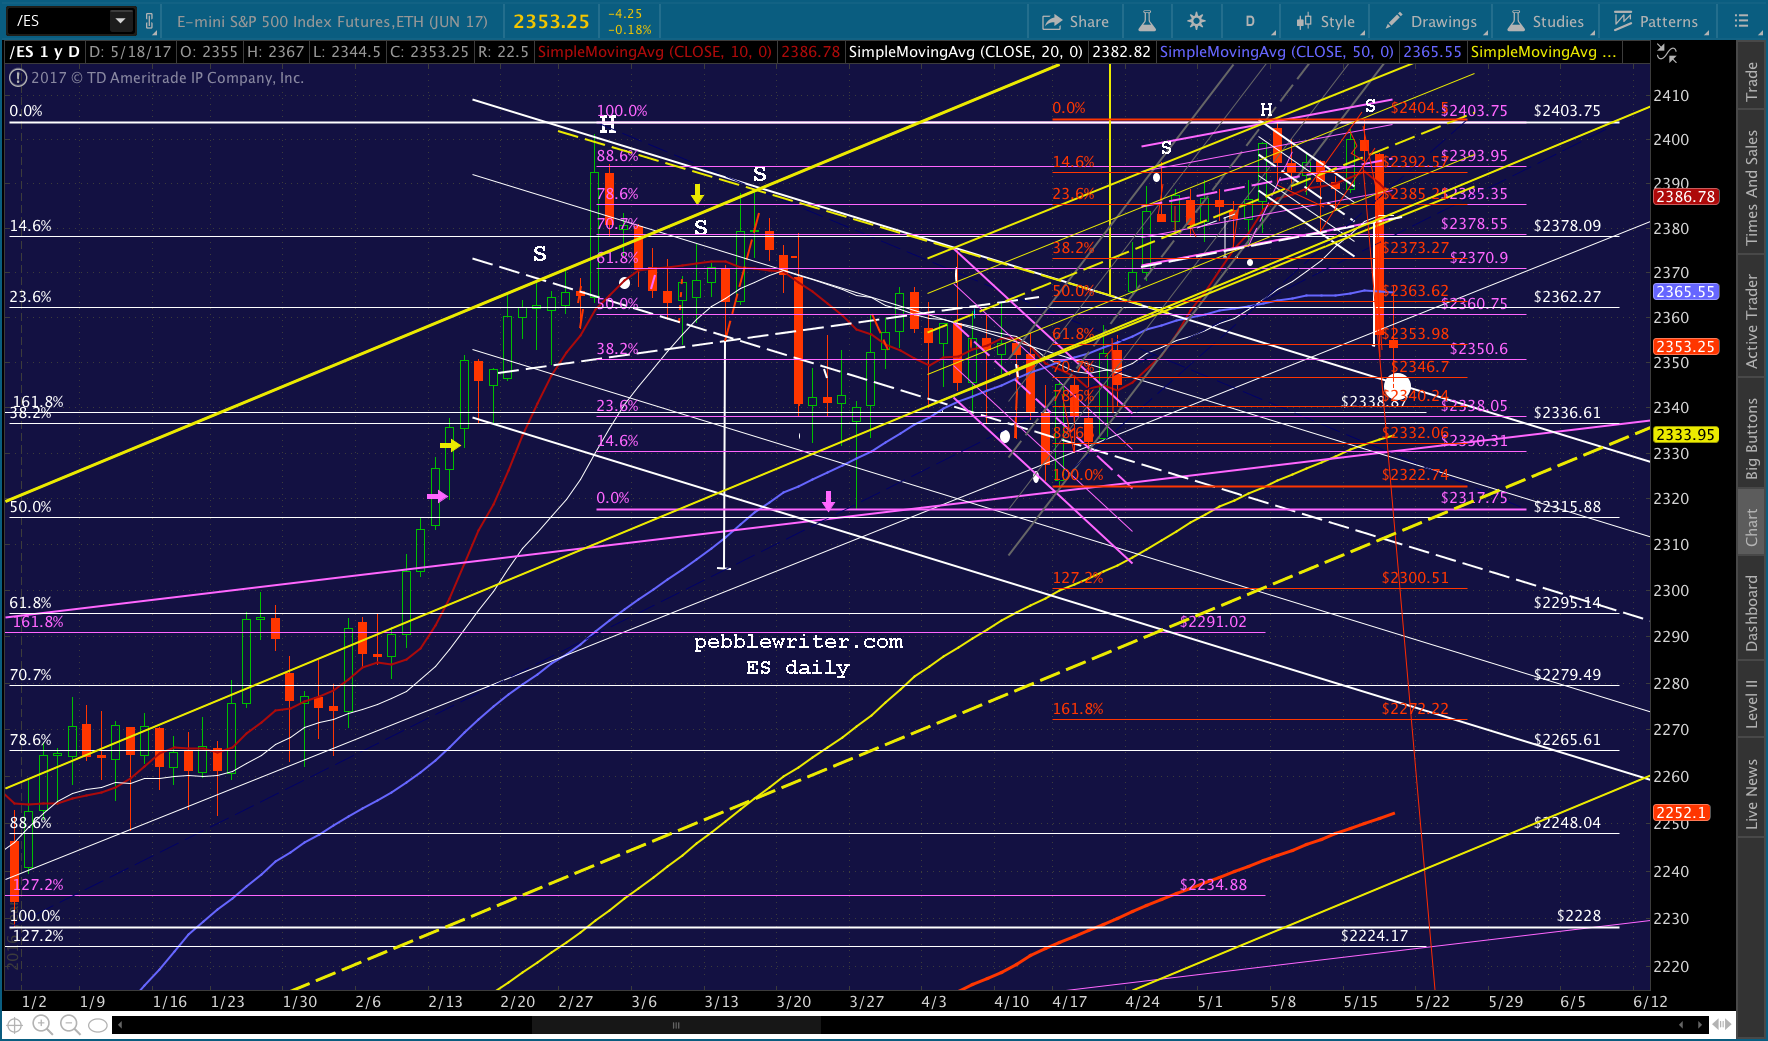
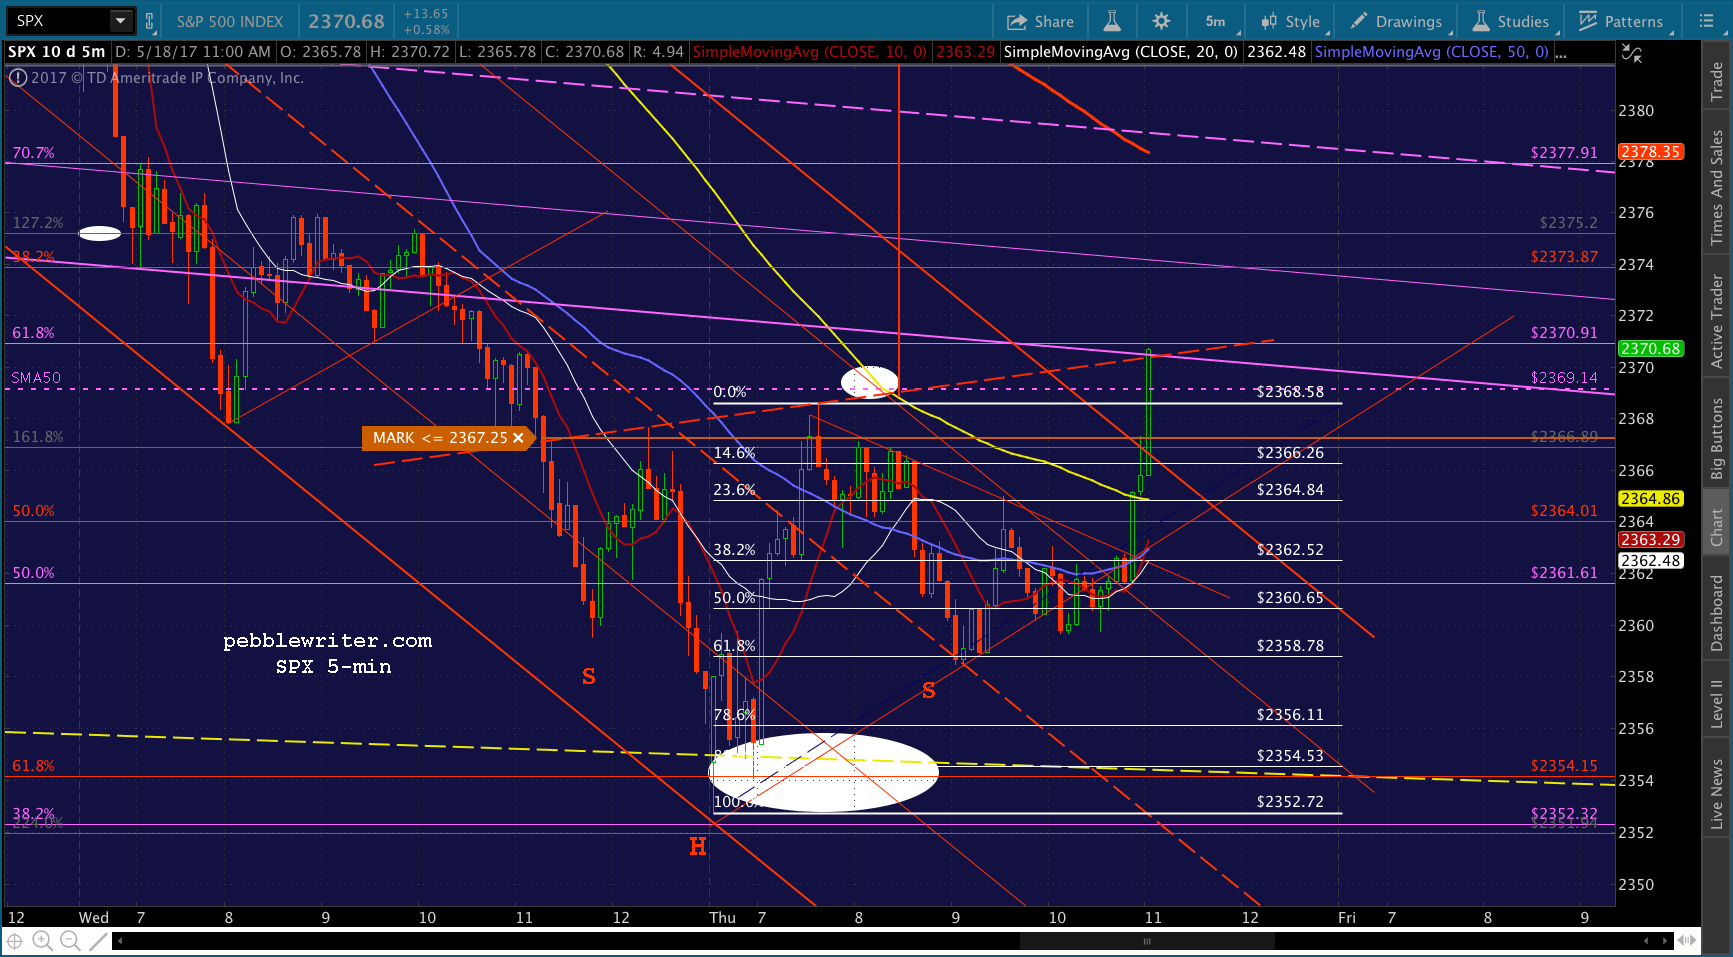
 This is only the latest example of the incredible value of charting. The spike that popped up on our forecast several weeks ago enabled SPX to come within 2 points of our downside target yesterday. And, unless the charts are fibbing, we should get a nice bounce off this morning’s initial lows.
continued for members…
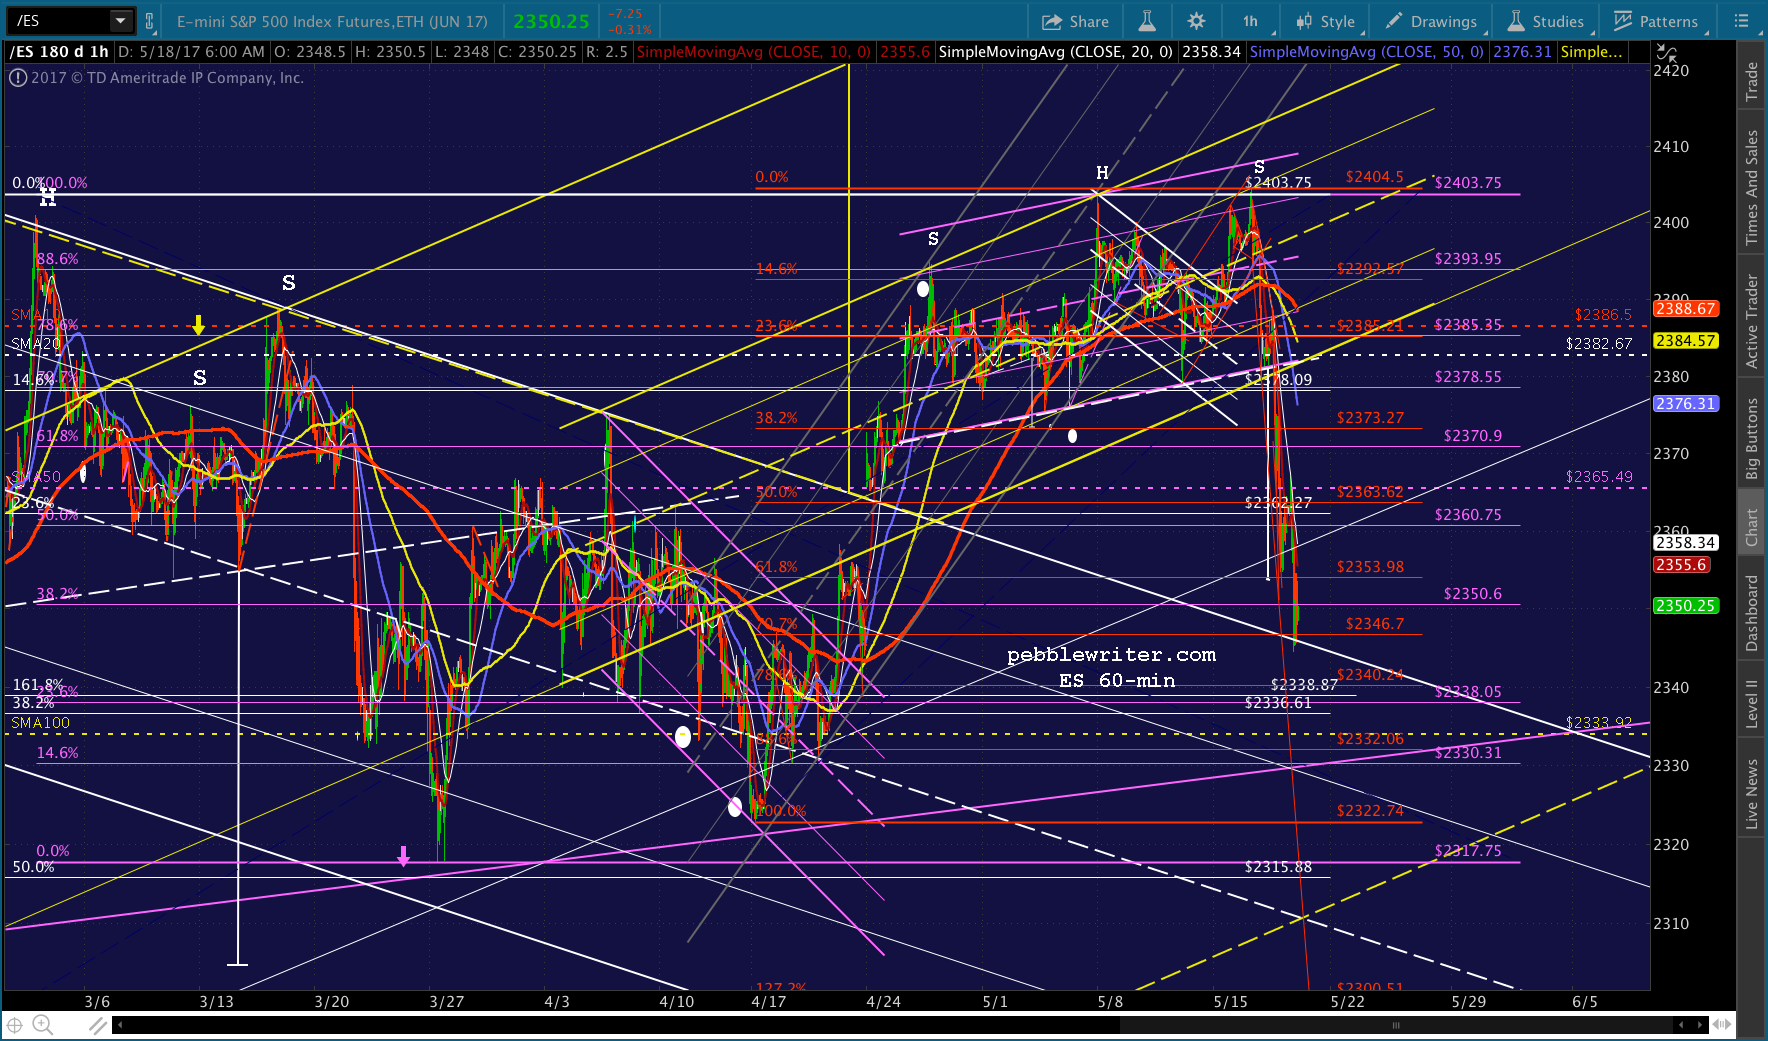
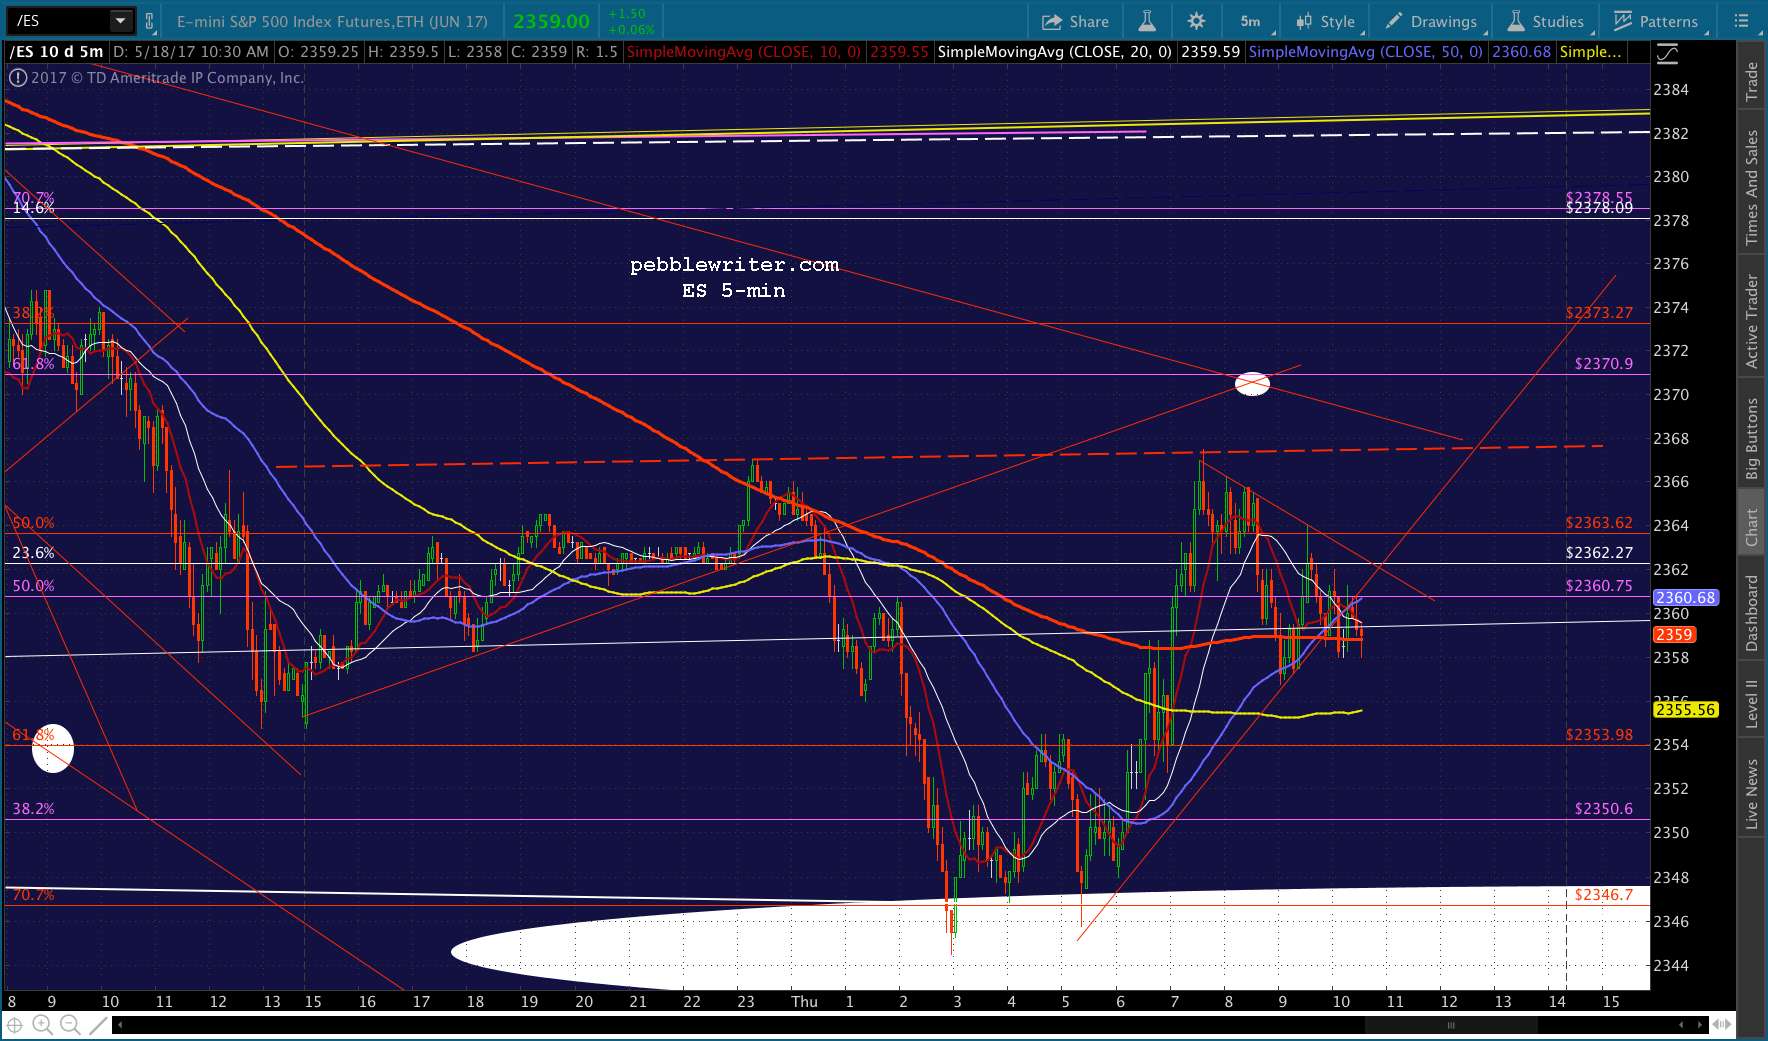
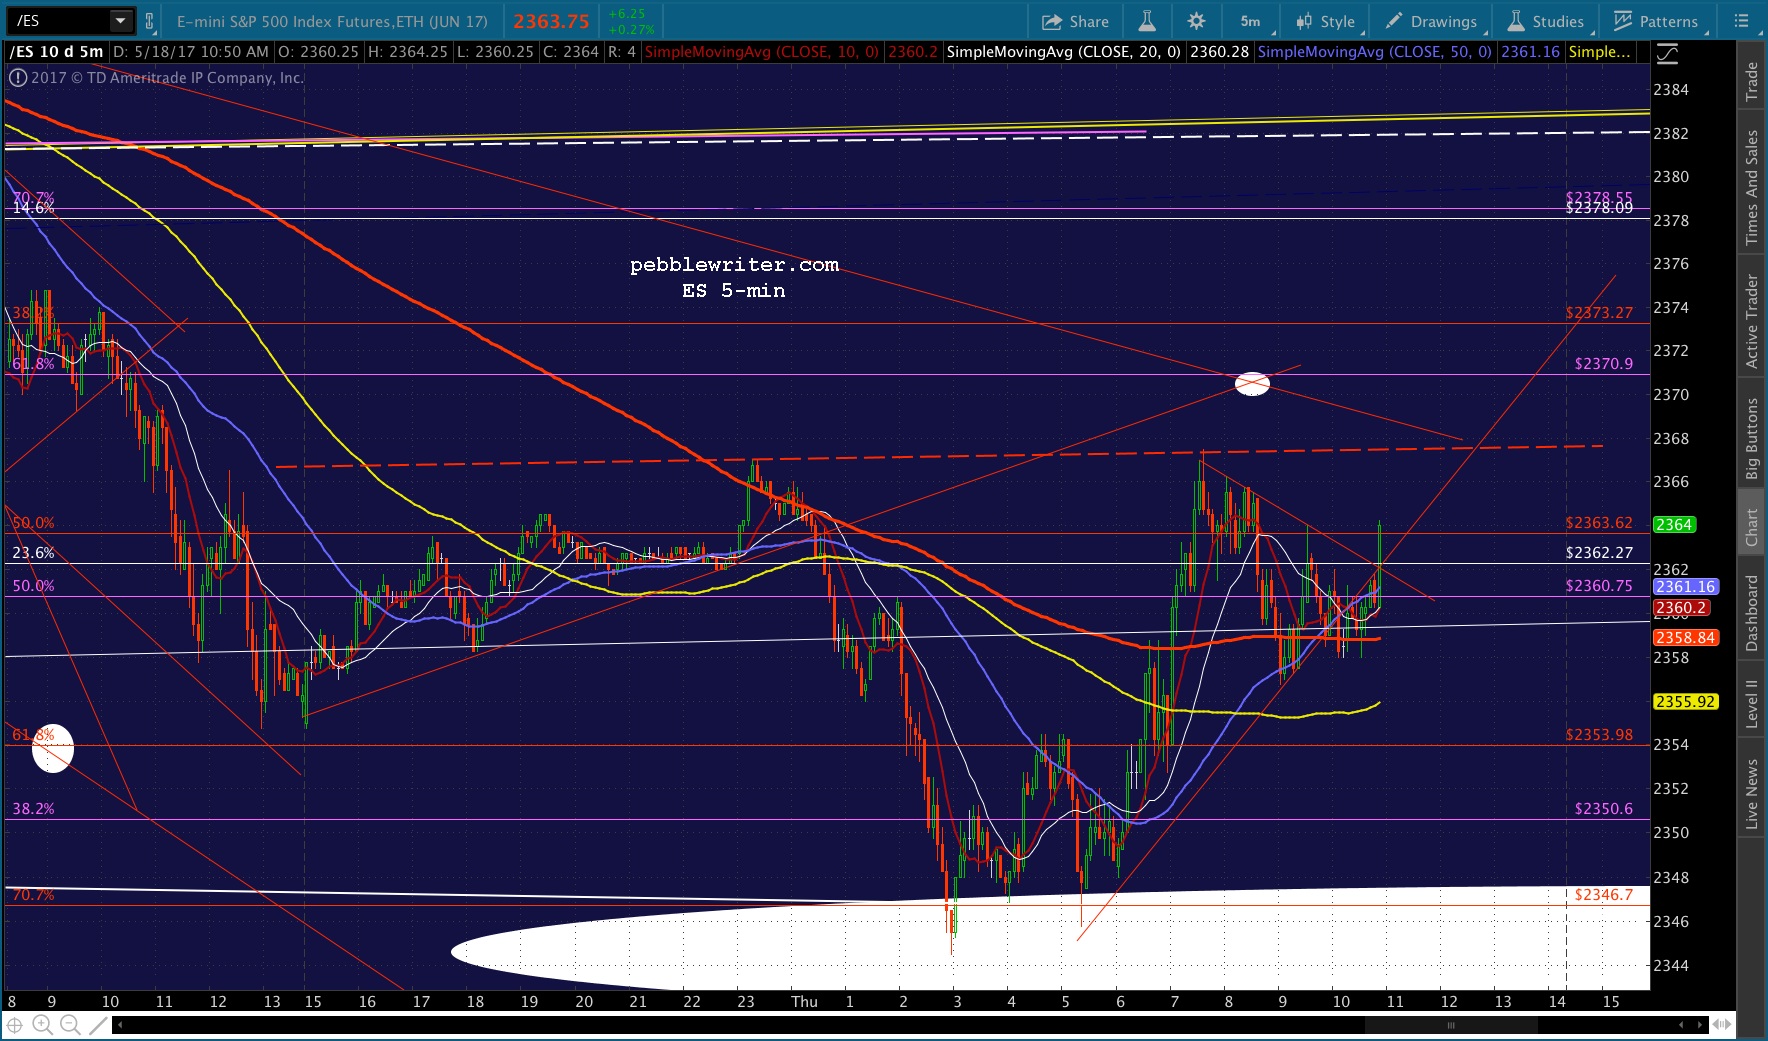
The futures’ slide overnight allowed ES to backtest its broken channel as well. It had come up well short, yesterday.
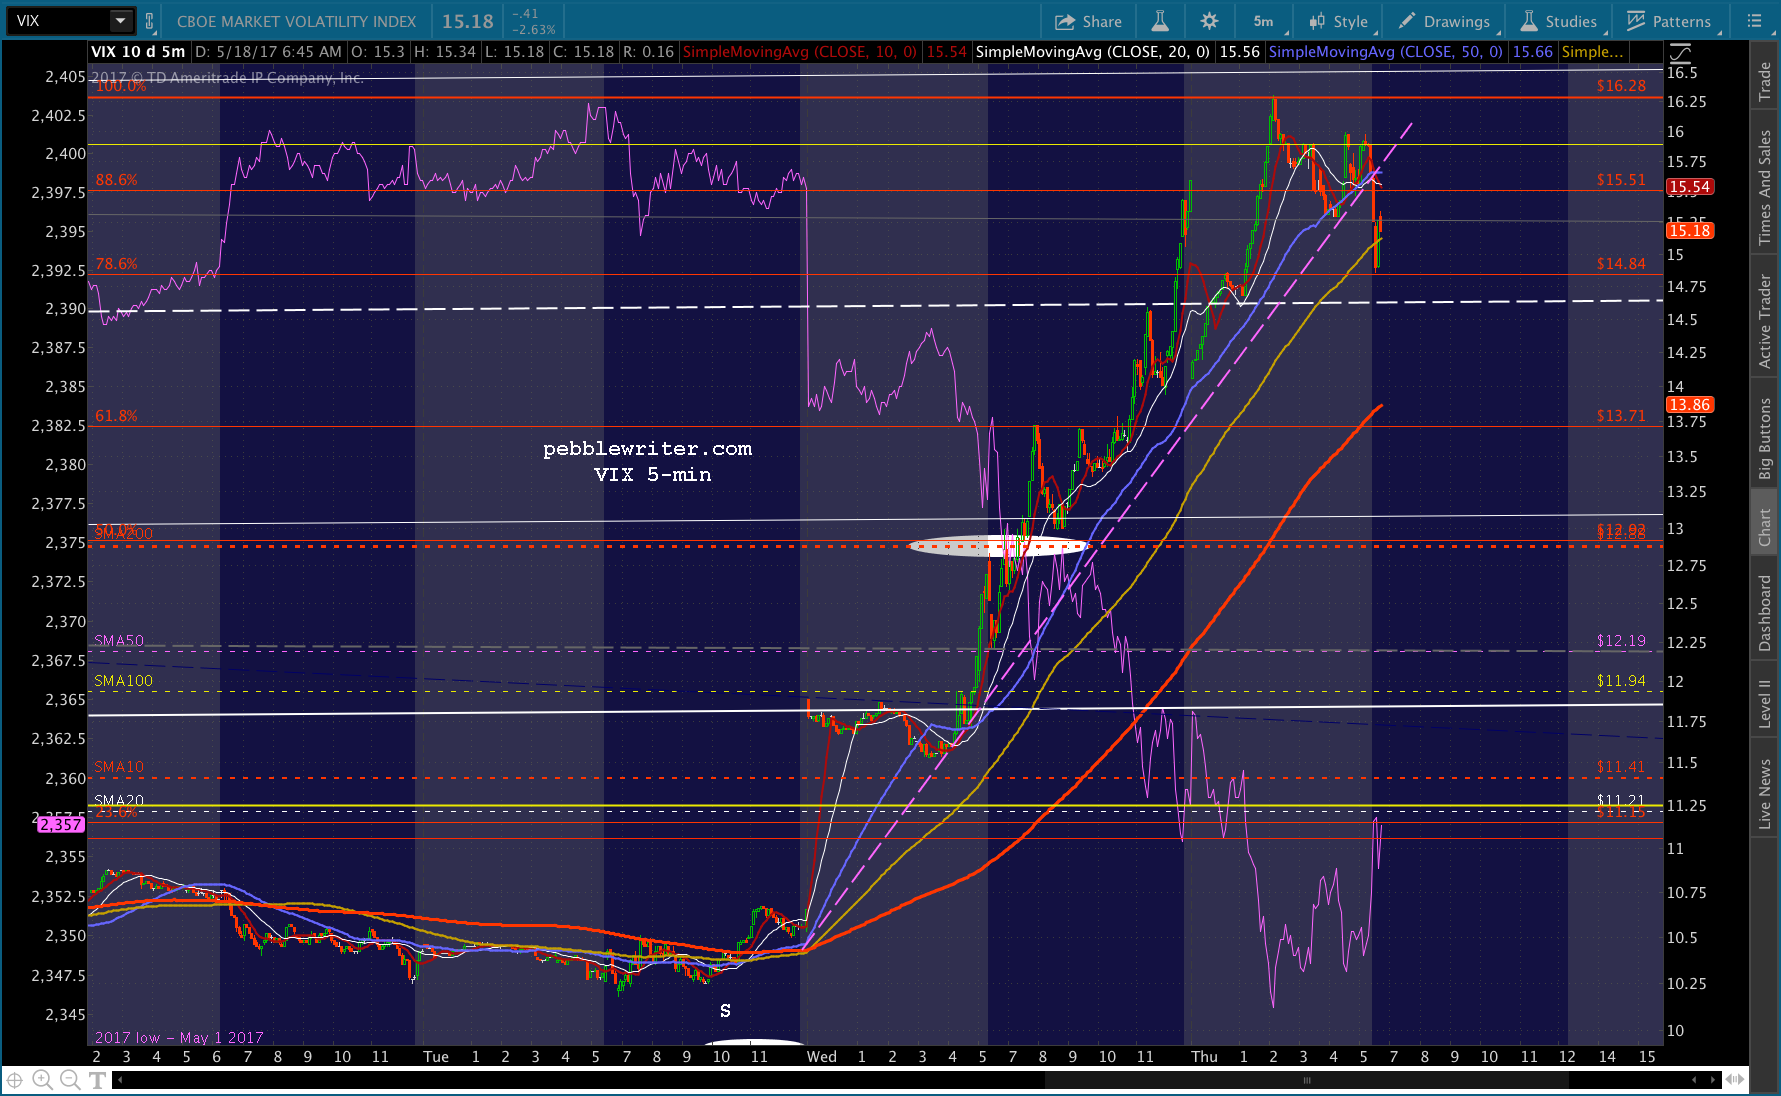
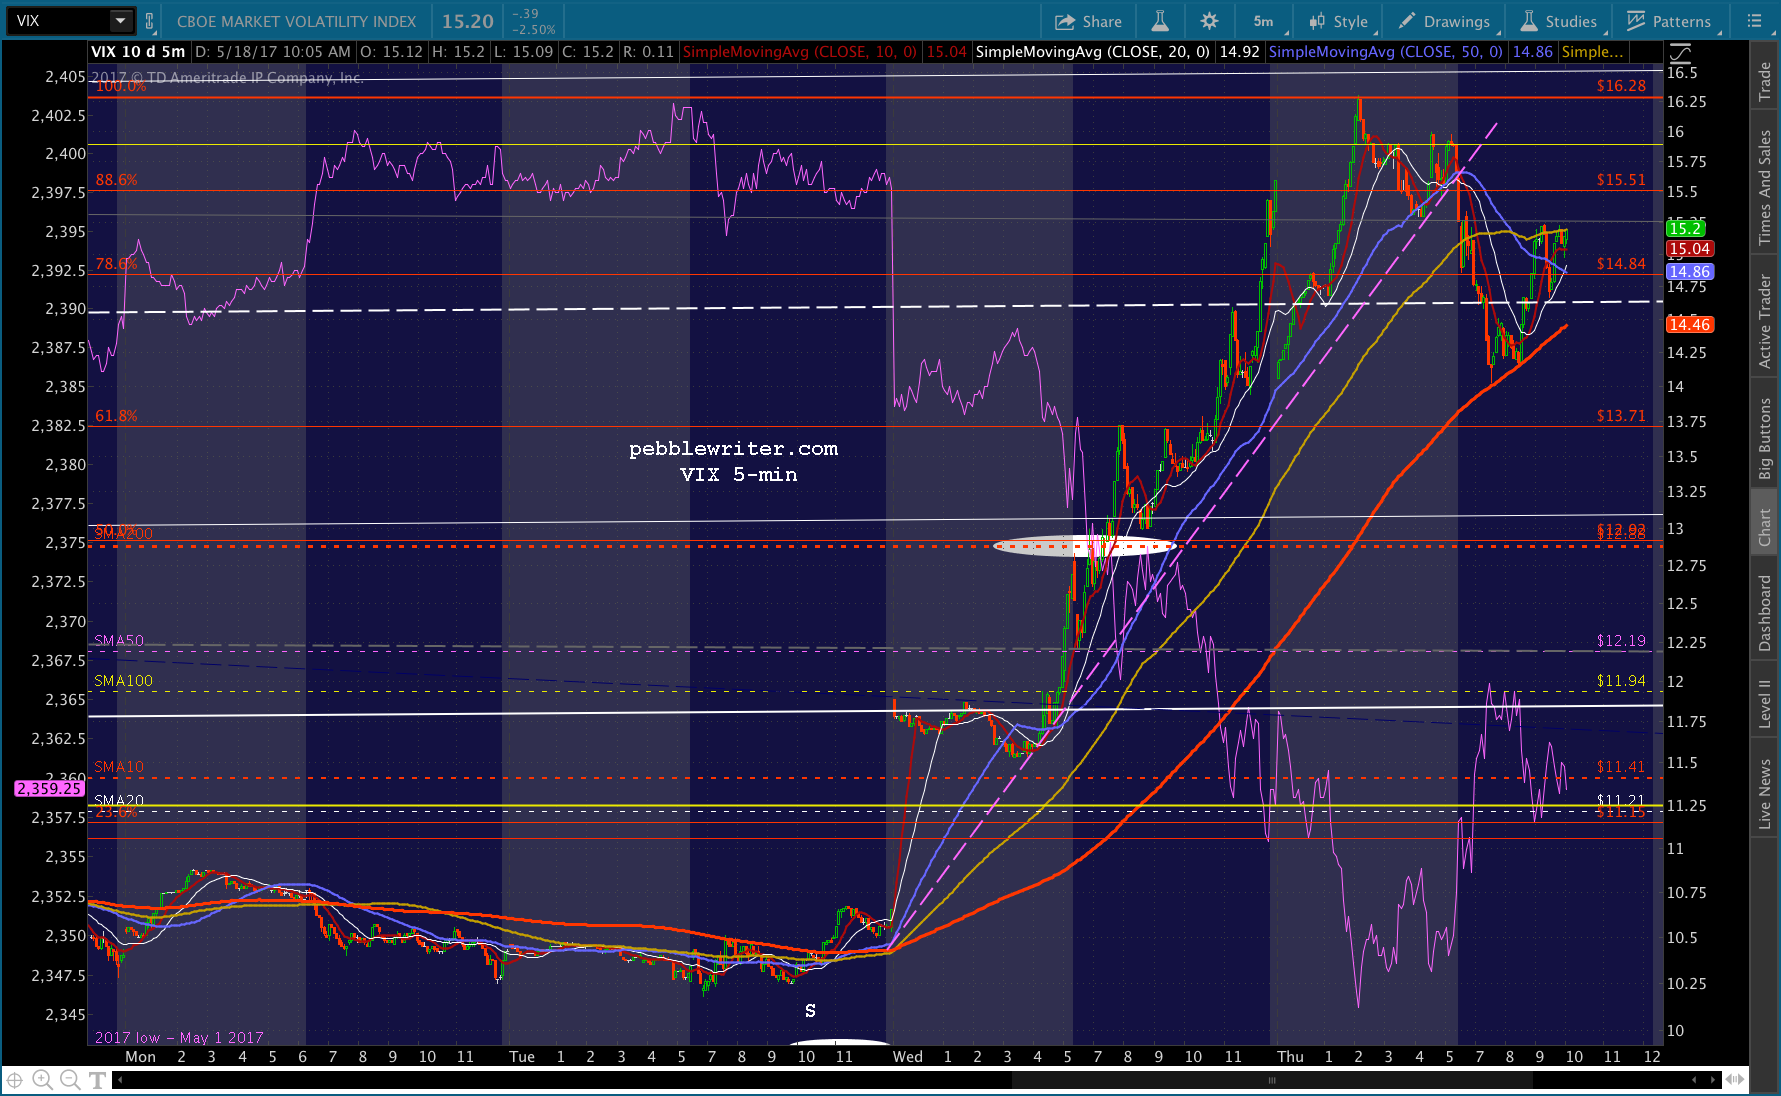
 A close up of VIX’s ascension. The big question: if it doesn’t reach 18.11 today, does that mean stocks have further downside?
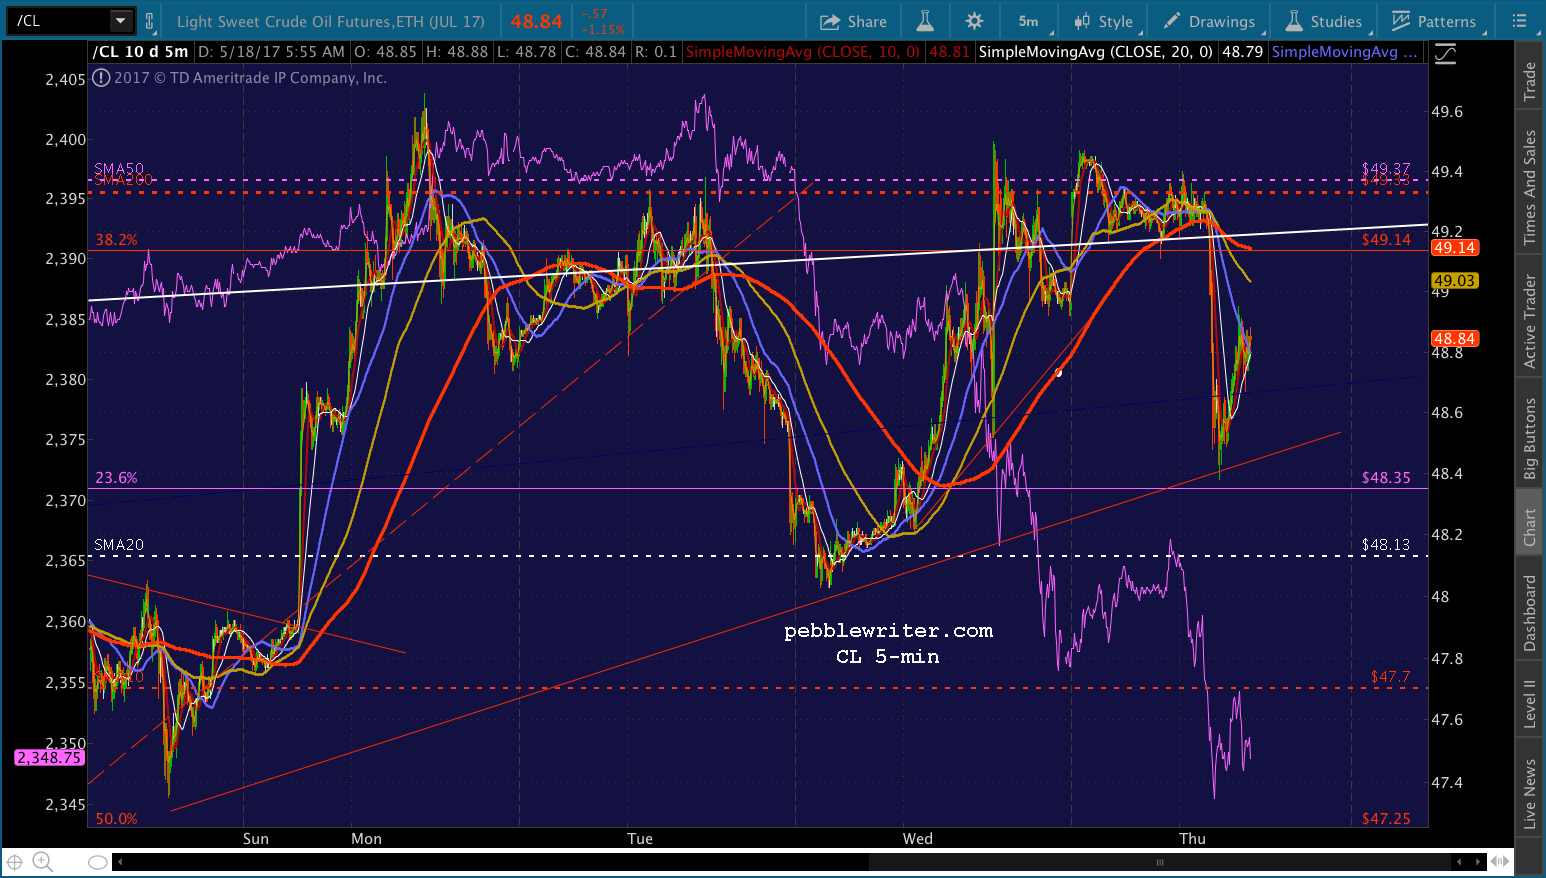
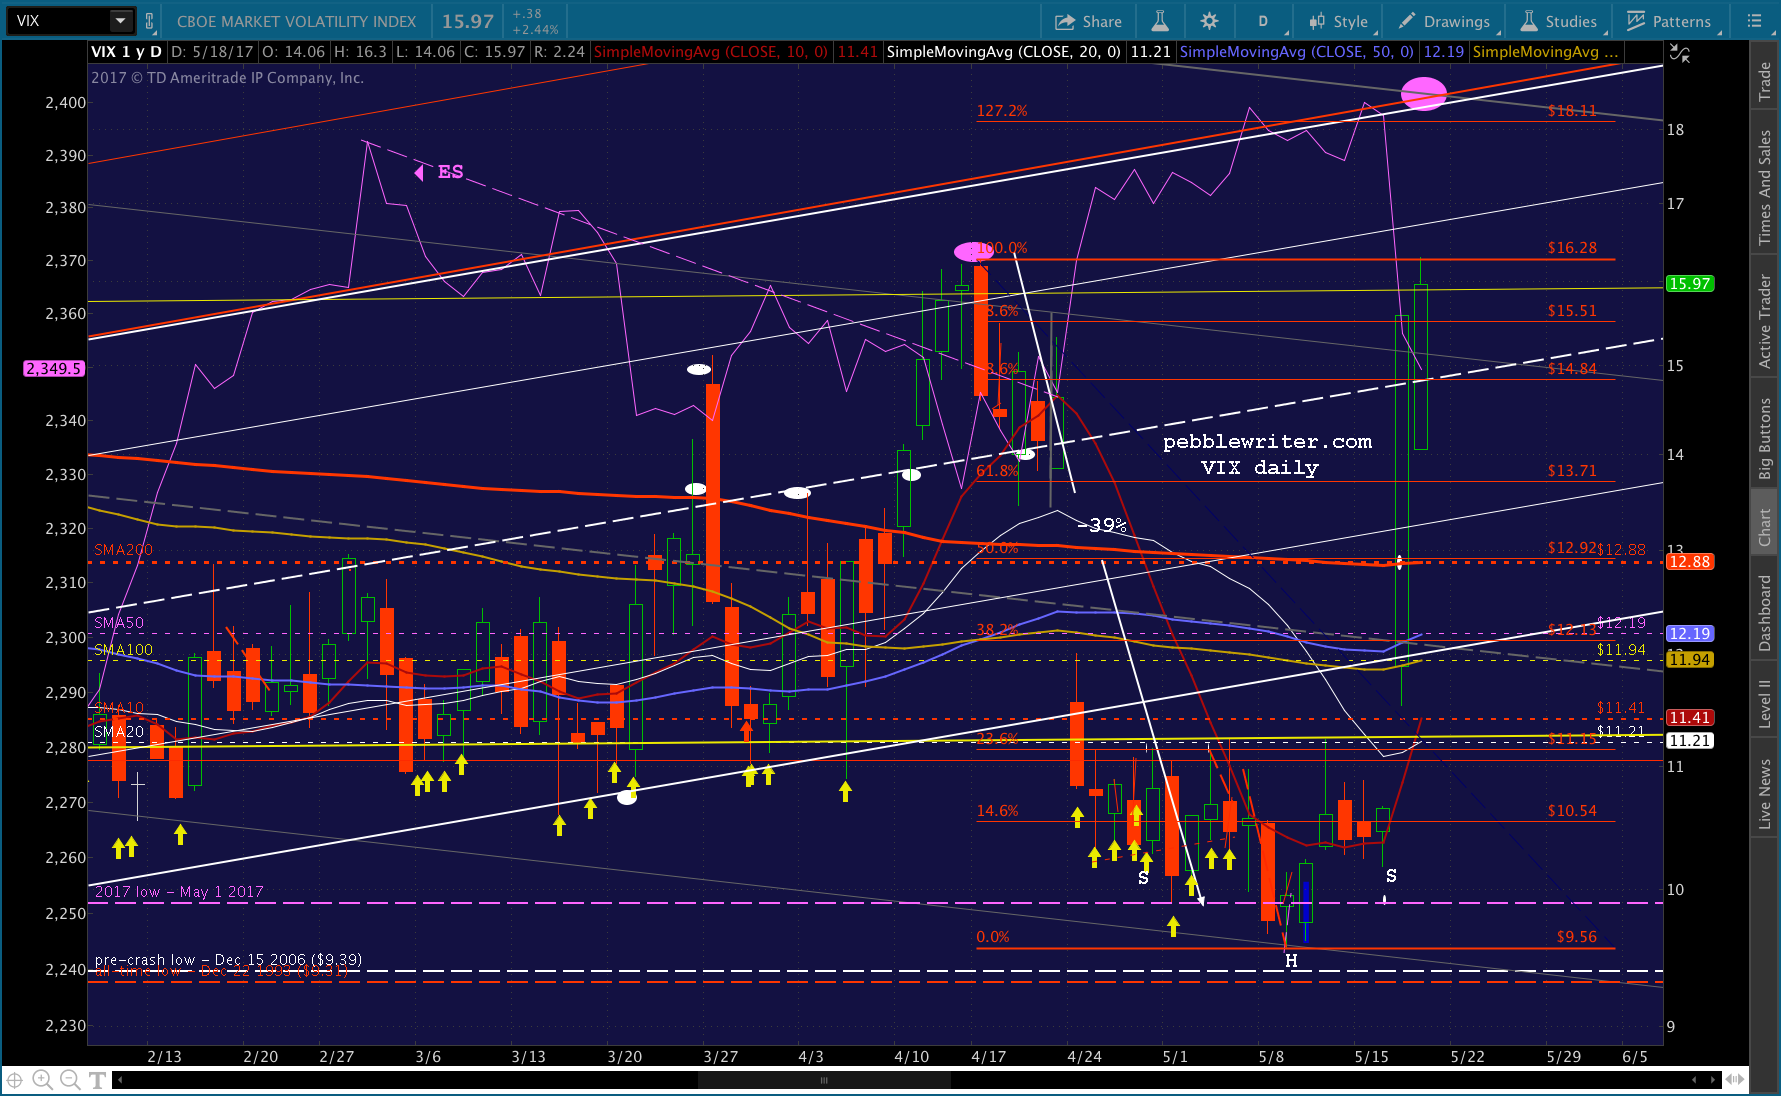 Note that CL is aiding in the recovery, but still have that white channel bottom and SMA200 looming overhead.
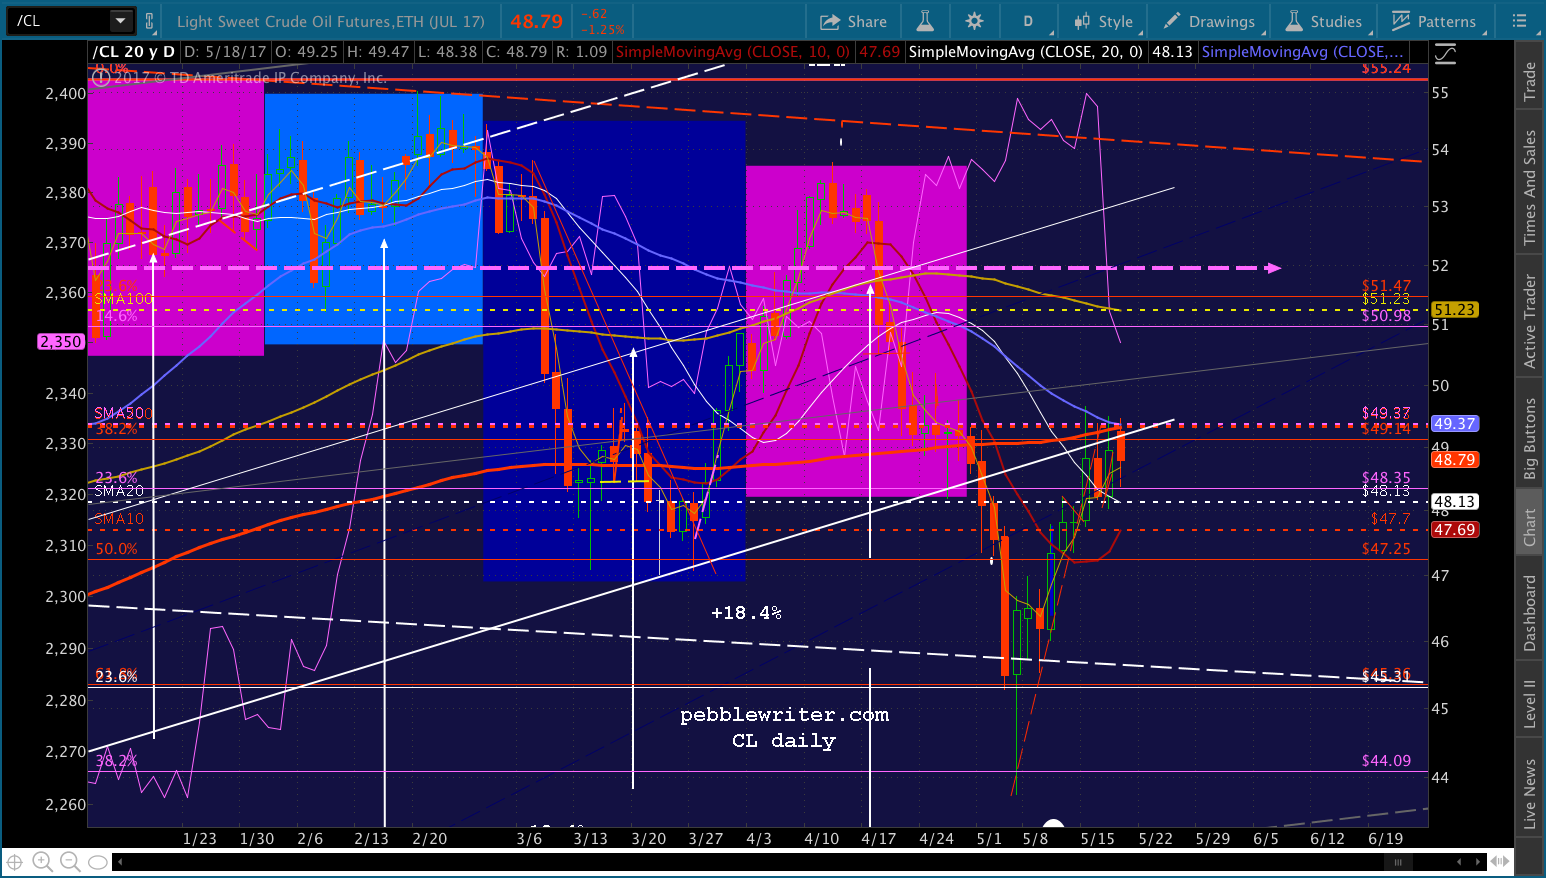
 UPDATE: 9:31 AM
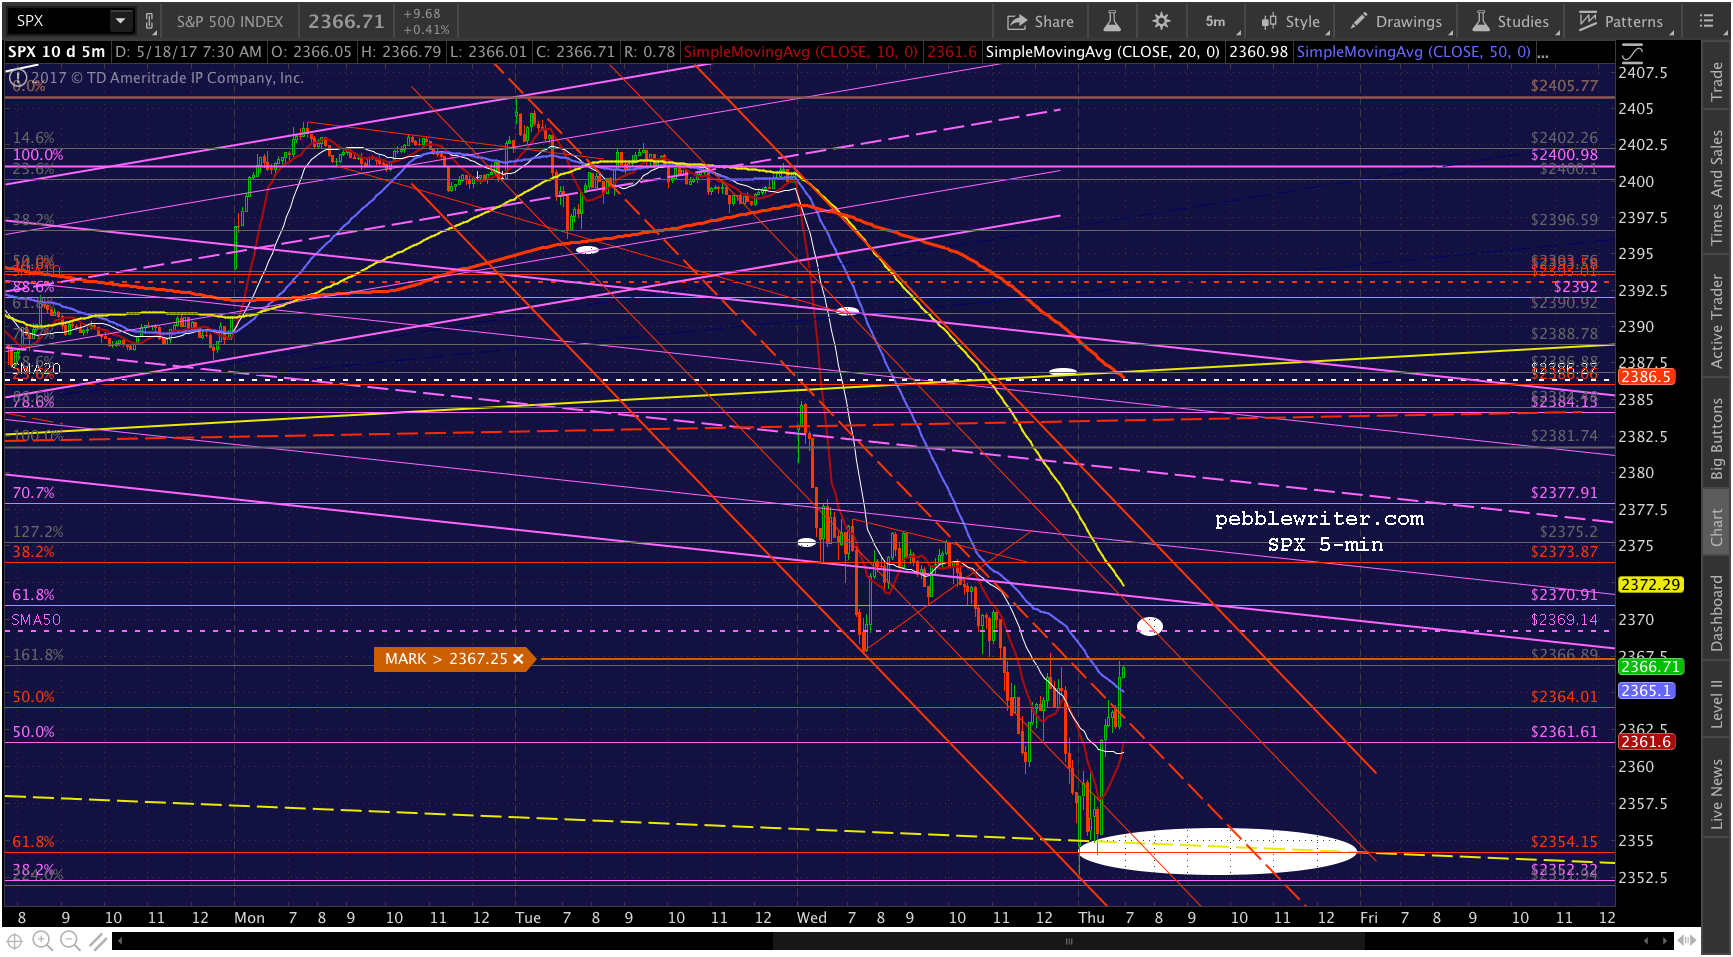
For those who didn’t hold long overnight, this is as good an entry point as we’re likely to get.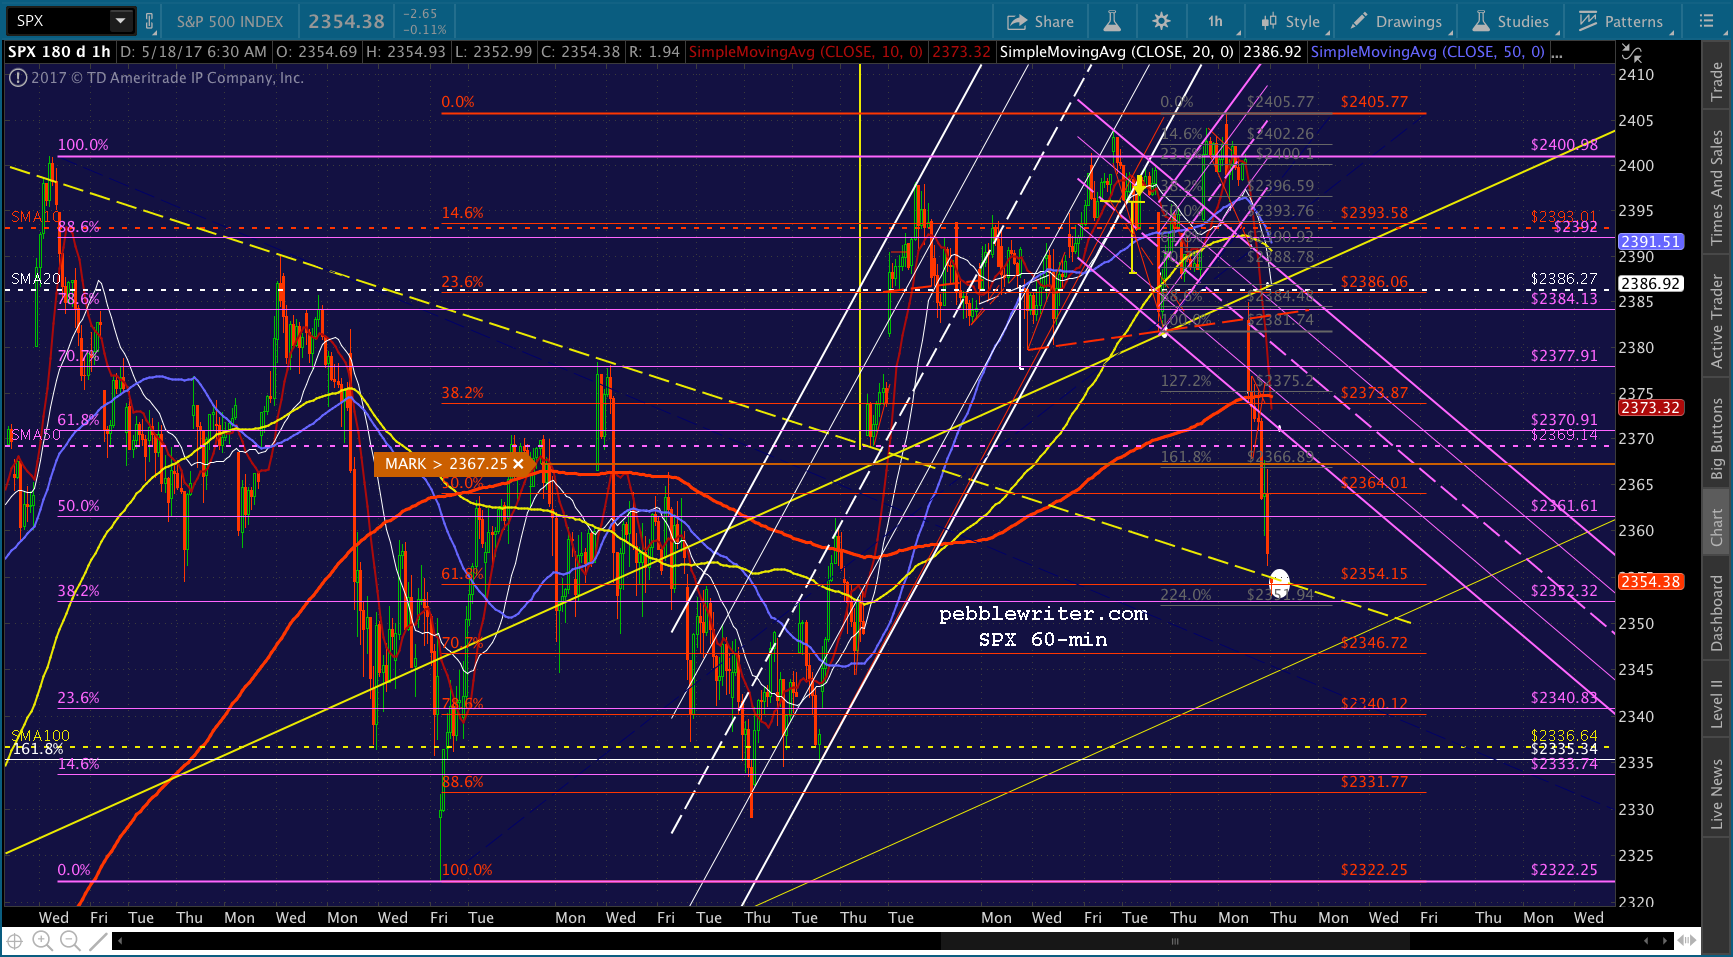 If VIX does have more upside, can we get there without the yellow TL breaking down? I don’t think so, unless it spikes after hours tonight and uses the slide from 18.11 to 15 or lower to drive tomorrow’s rally.
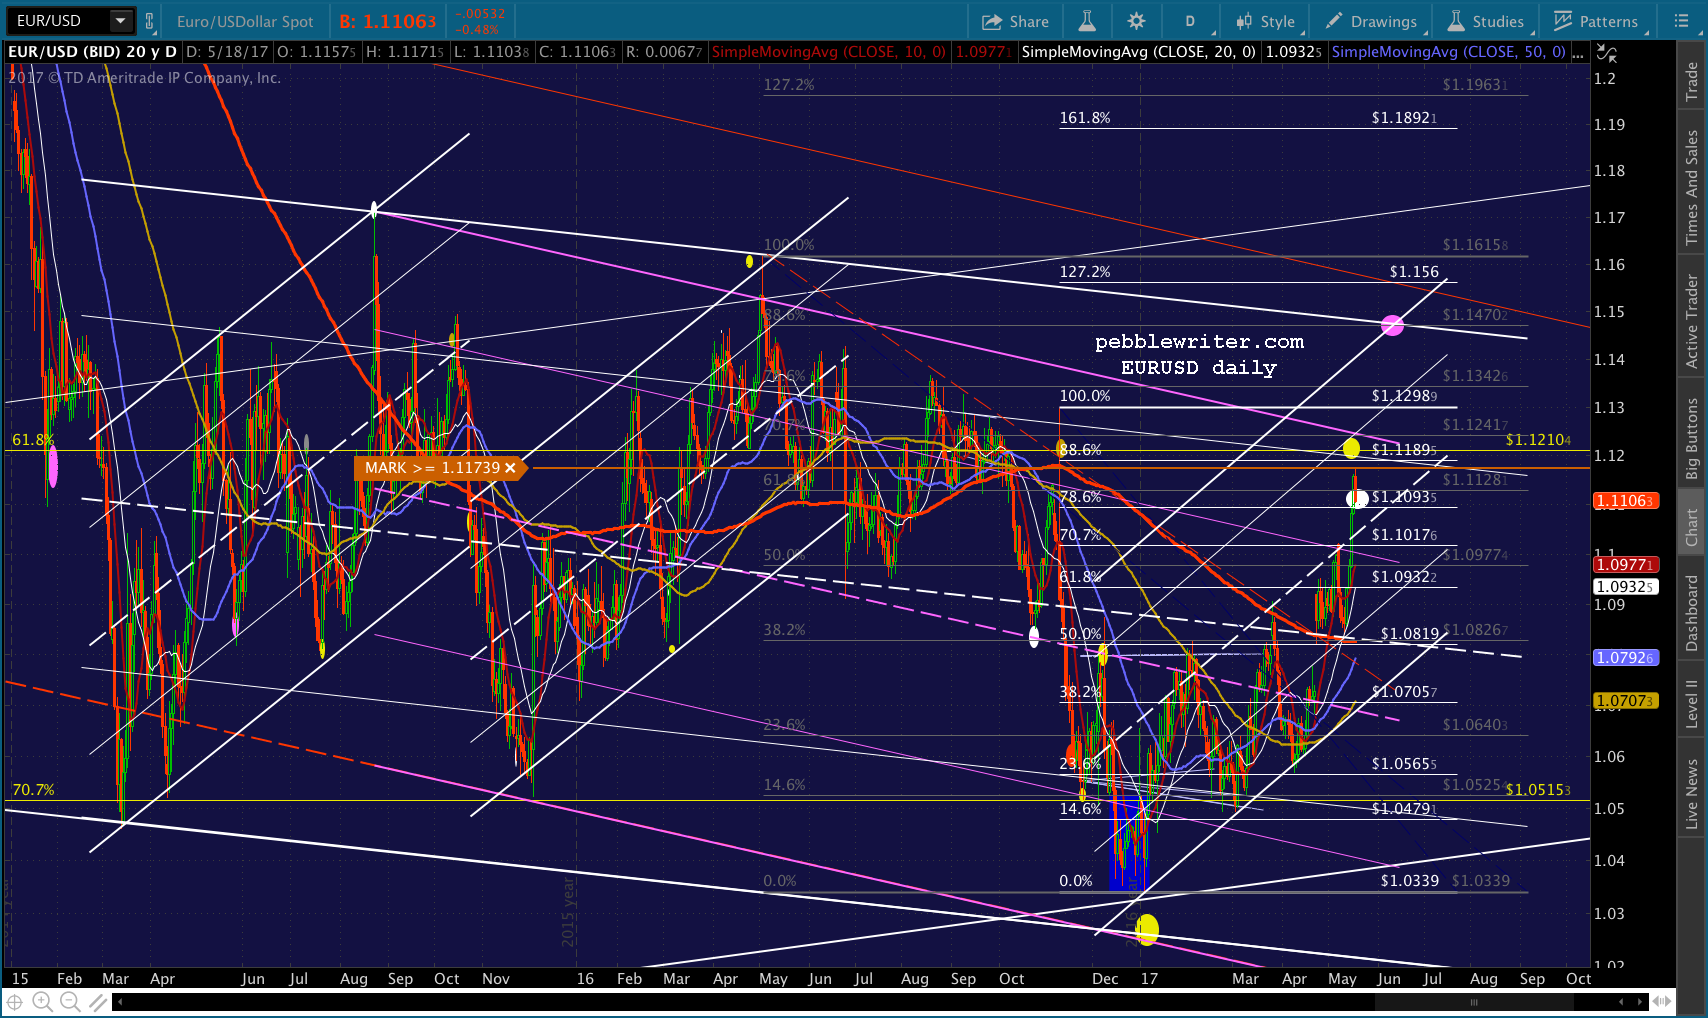
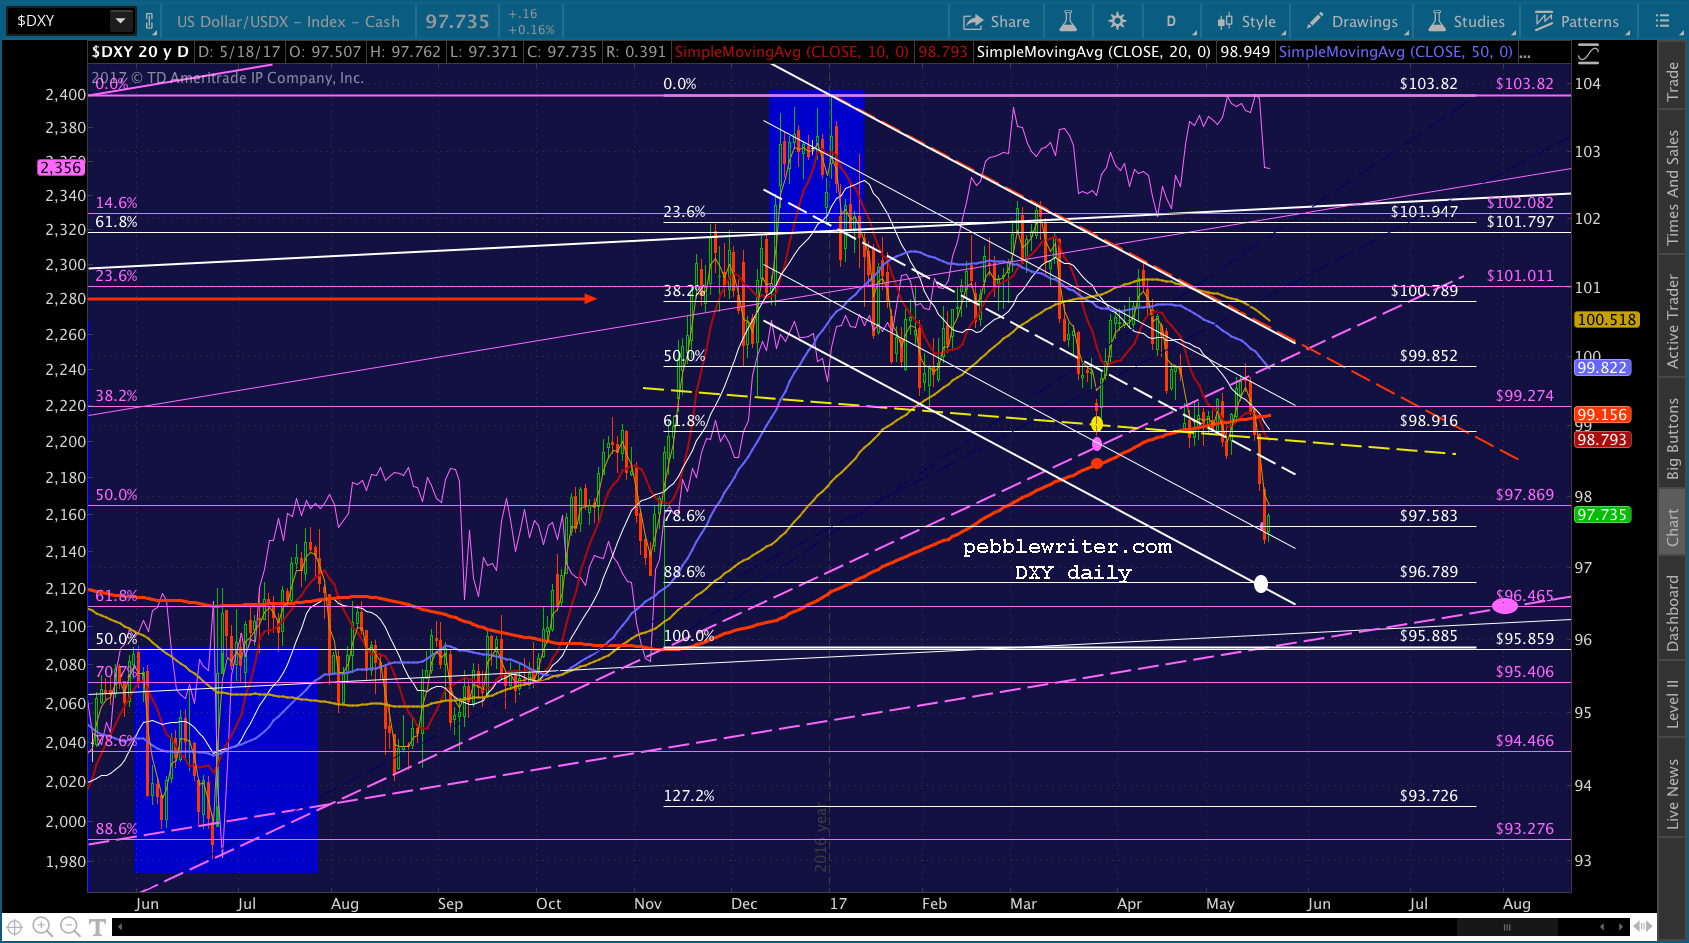
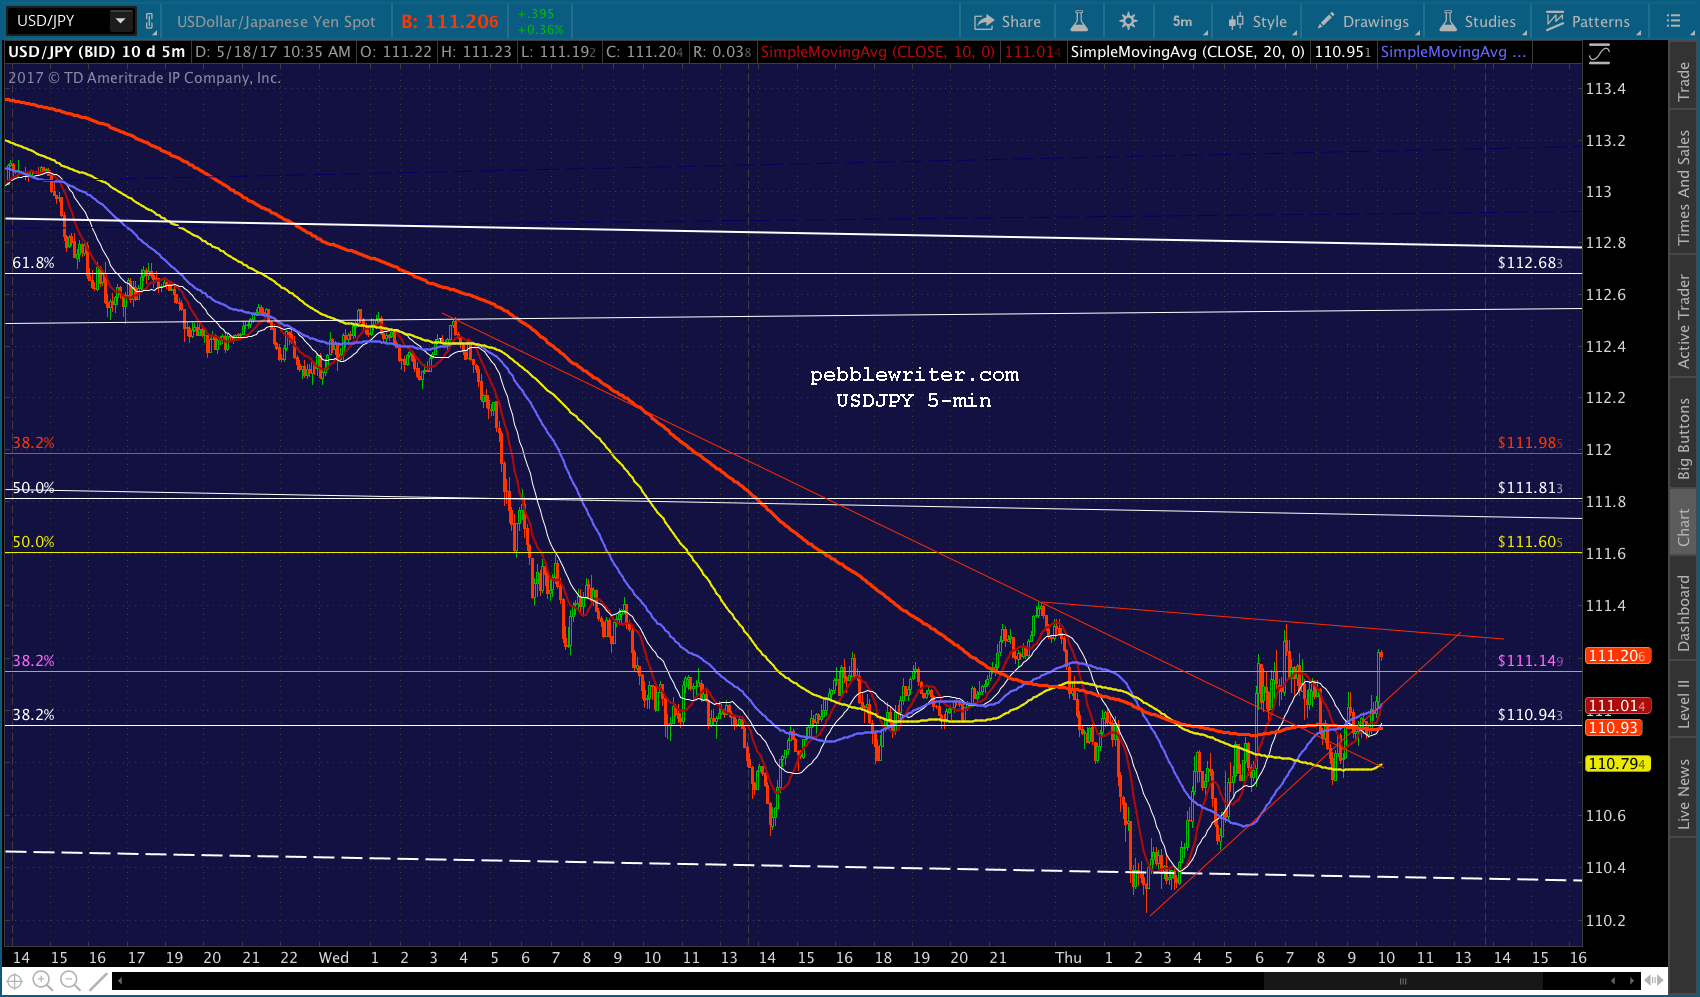
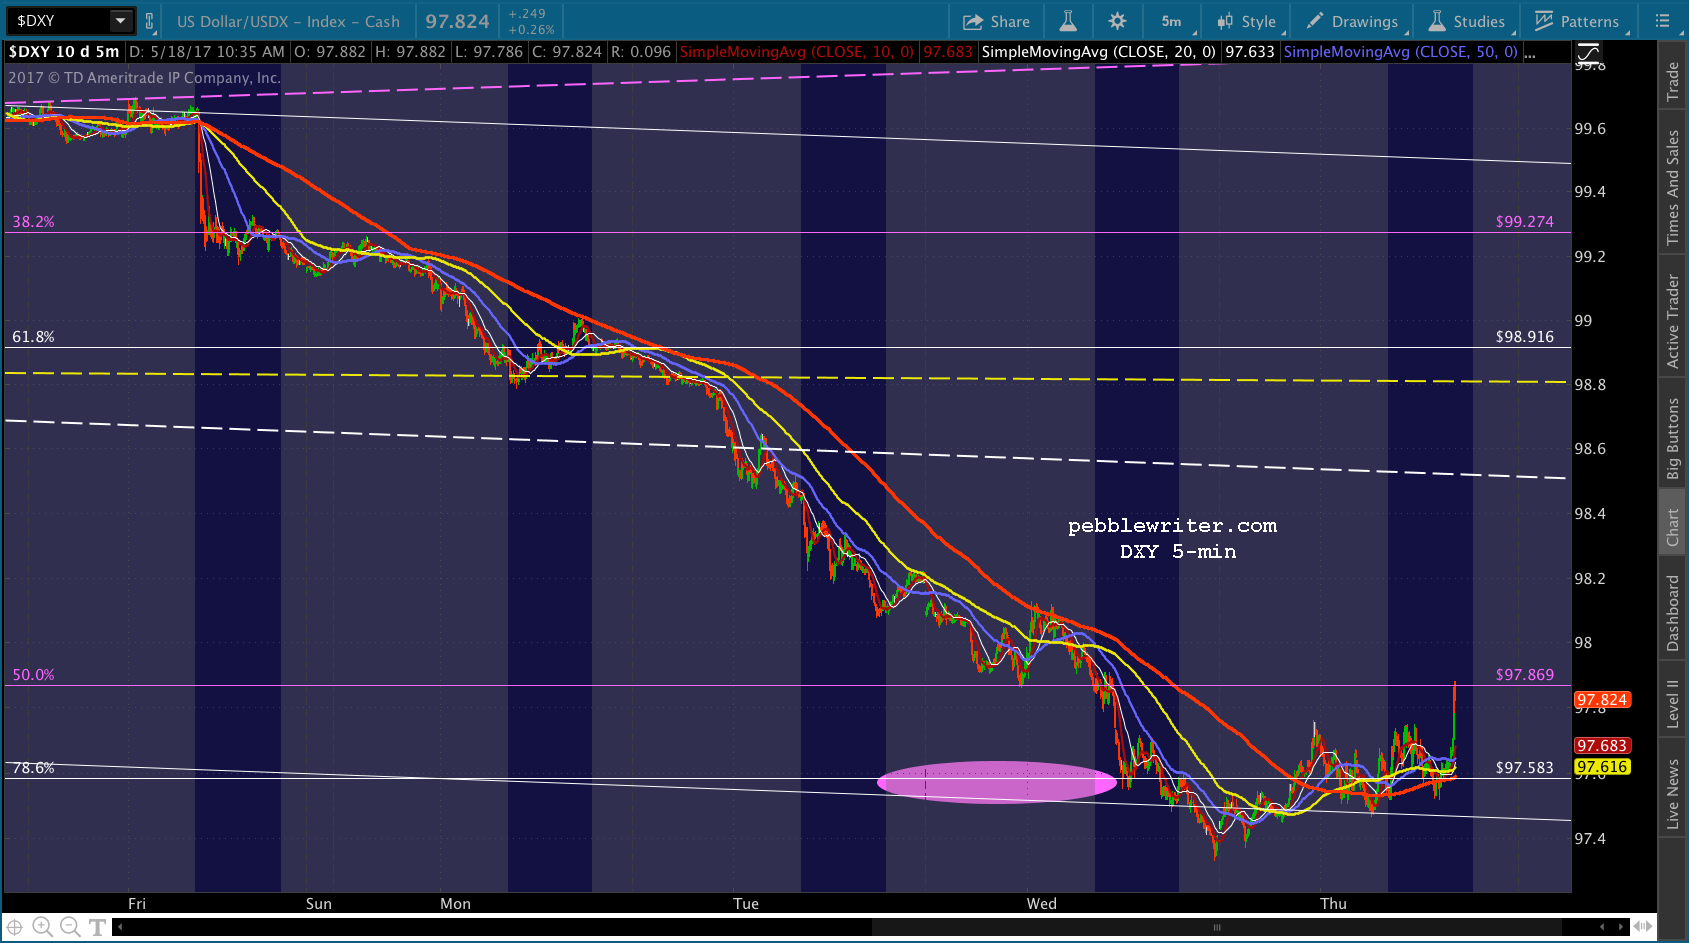
The currency moves are still unfinished. EURUSD, USDJPy and DXY all have further to go. But, right now, they’re involved in propping up SPX.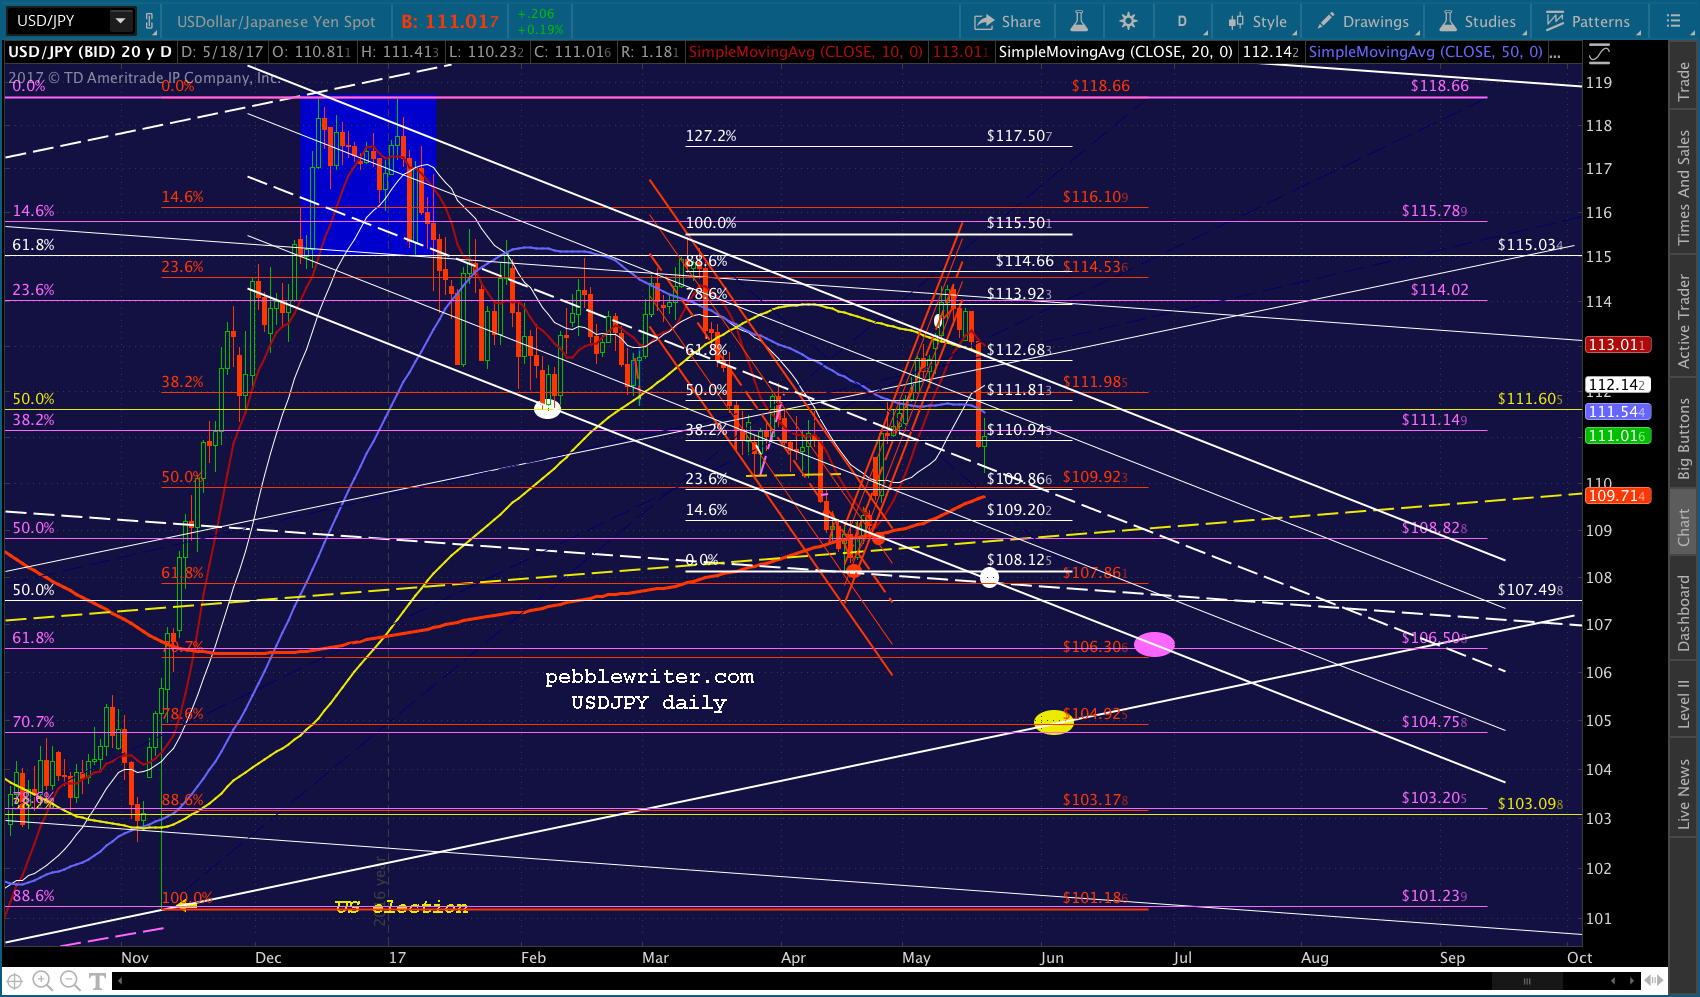
 UPDATE: 9:45 AM
VIX is helping, too, as SPX approaches its first real test — the SMA5 10 — and ES tags its SMA5 200.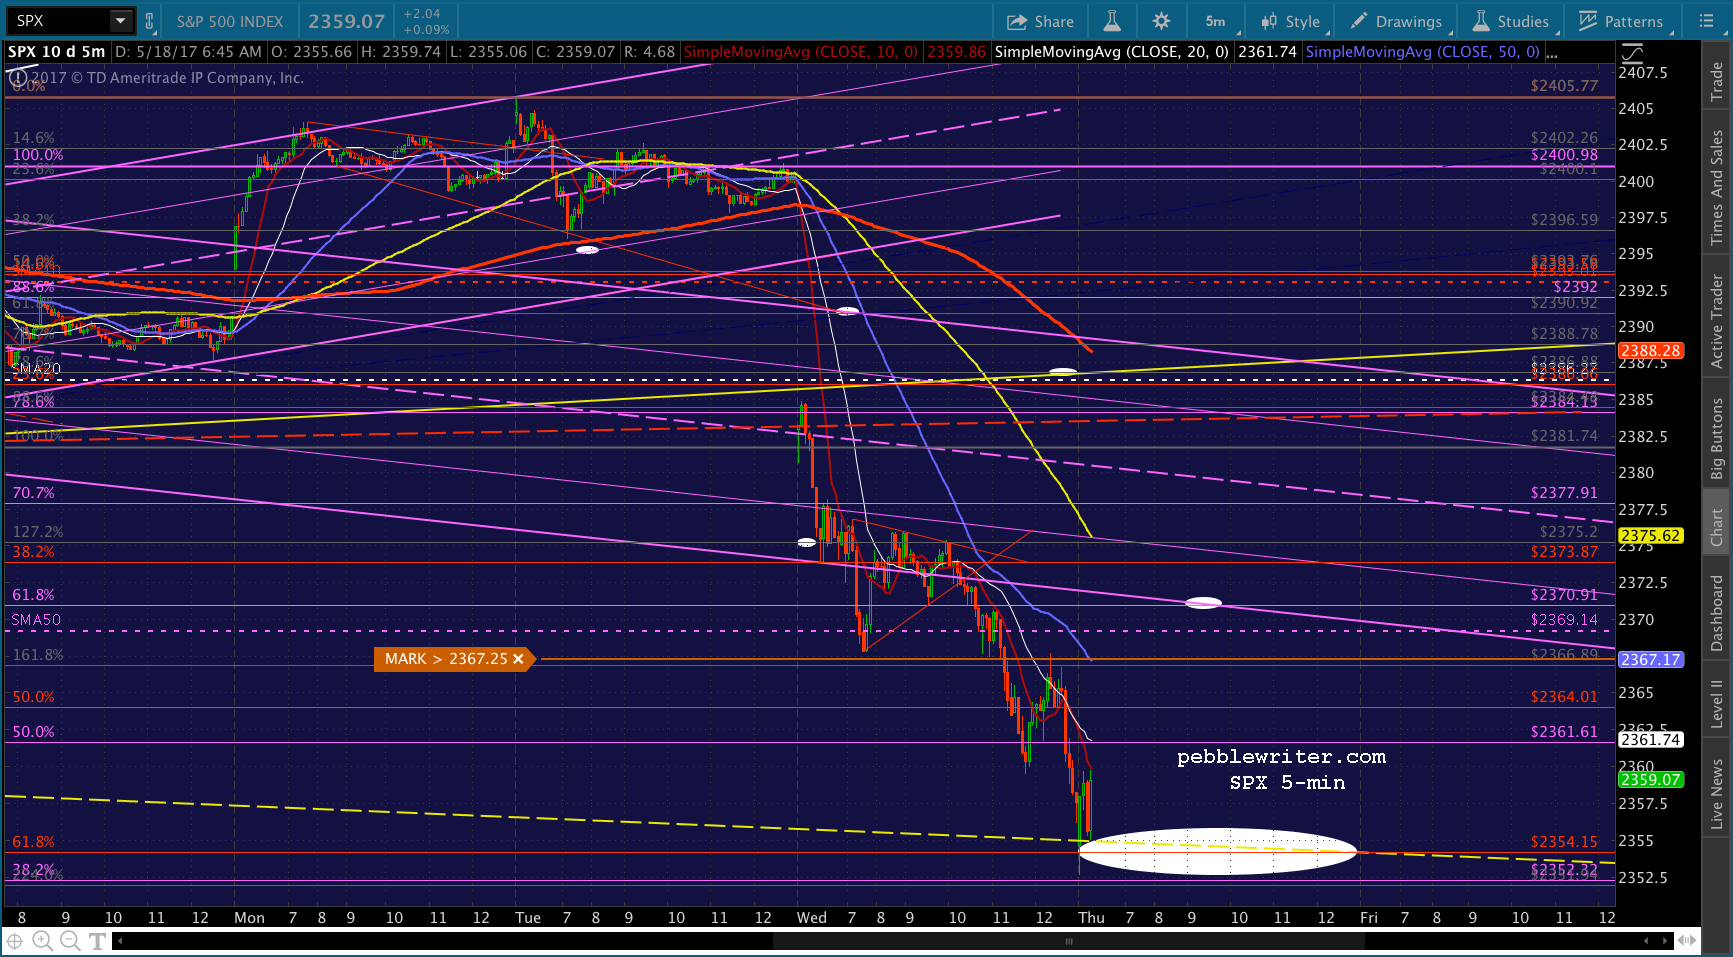

 UPDATE: 10:32 AM
VIX is coming up on its SMA5 200, which could coincide with SPX reaching the SMA50 or SMA5 100 and ES running into TL resistance. This should mark the beginning of a backtest of the rising SMA5 10/20 or the midline of a falling red channel I’ve added. But, for now, it’s all about how high CL is willing to go. 


 UPDATE: 10:48 AM
We’re getting that backtest, as VIX bounces off its SMA5 200. If they’re smart, they’ll develop a little IH&S. The one shown below, for instance, would target 1292ish.
 UPDATE: 12:05 PM
We should be near the end of the decline if they’re going to be able to do any thing mildly bullish with this bounce. Back to long here for those who played the VIX bounce.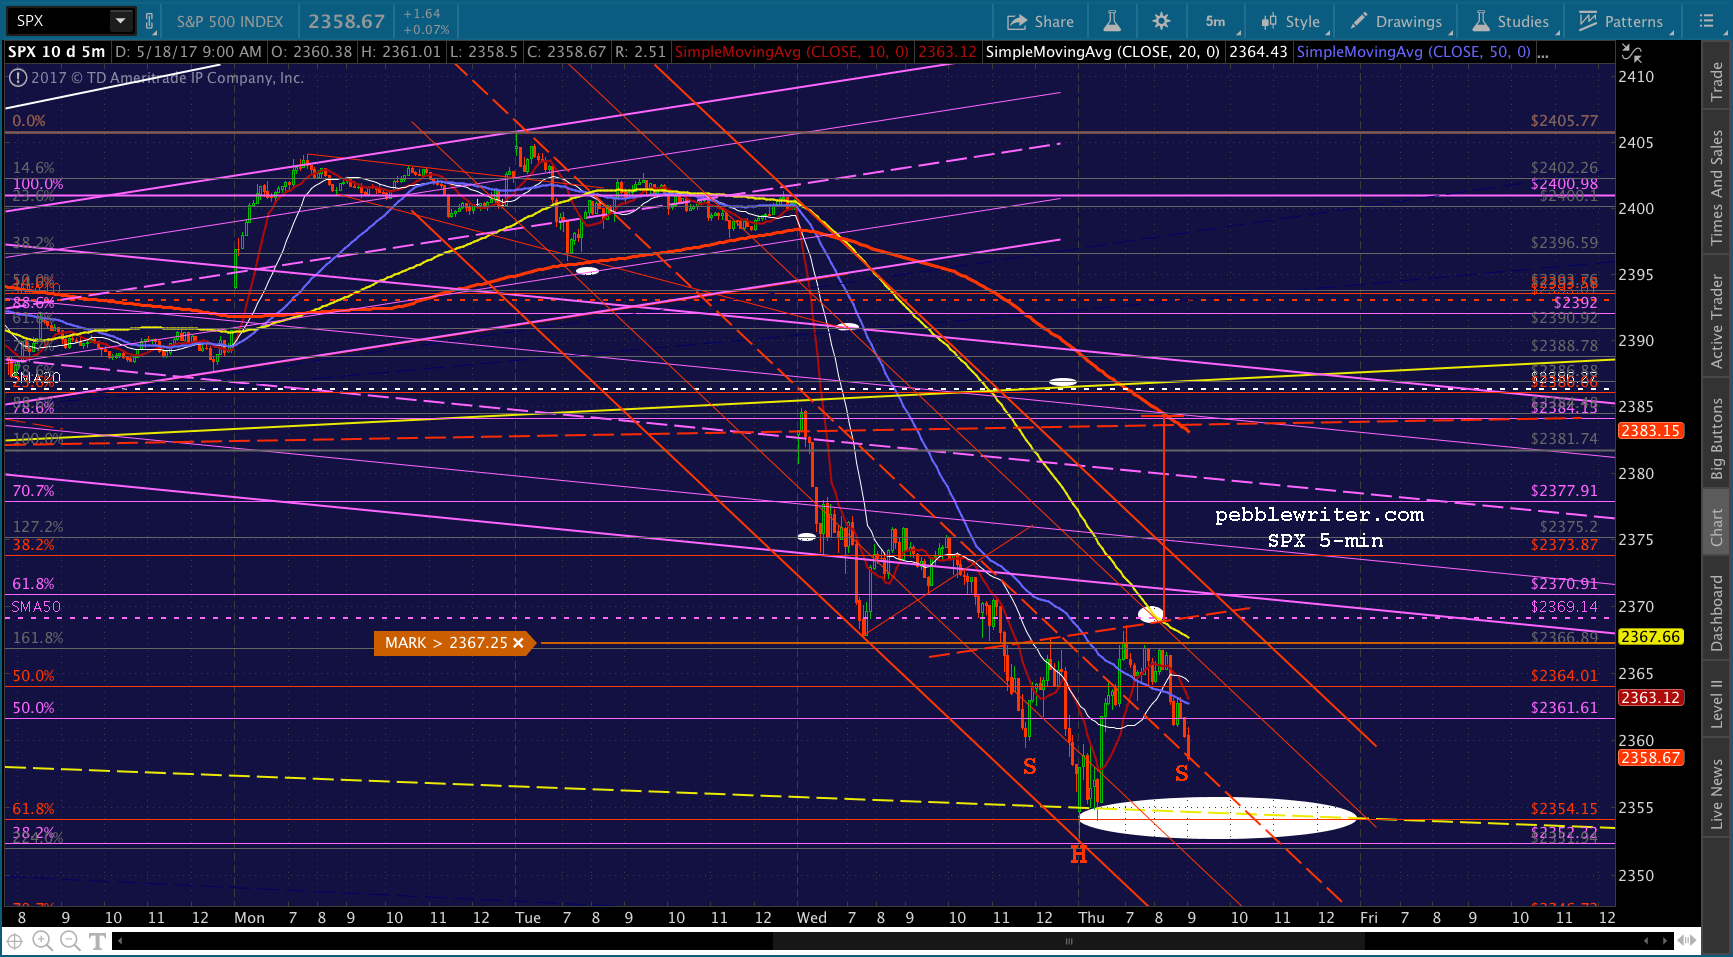
 USDJPY will need to recover from this breakdown of the two TLs. If not, and if VIX can’t reverse off the SMA5 100, then the entire bounce is in trouble.
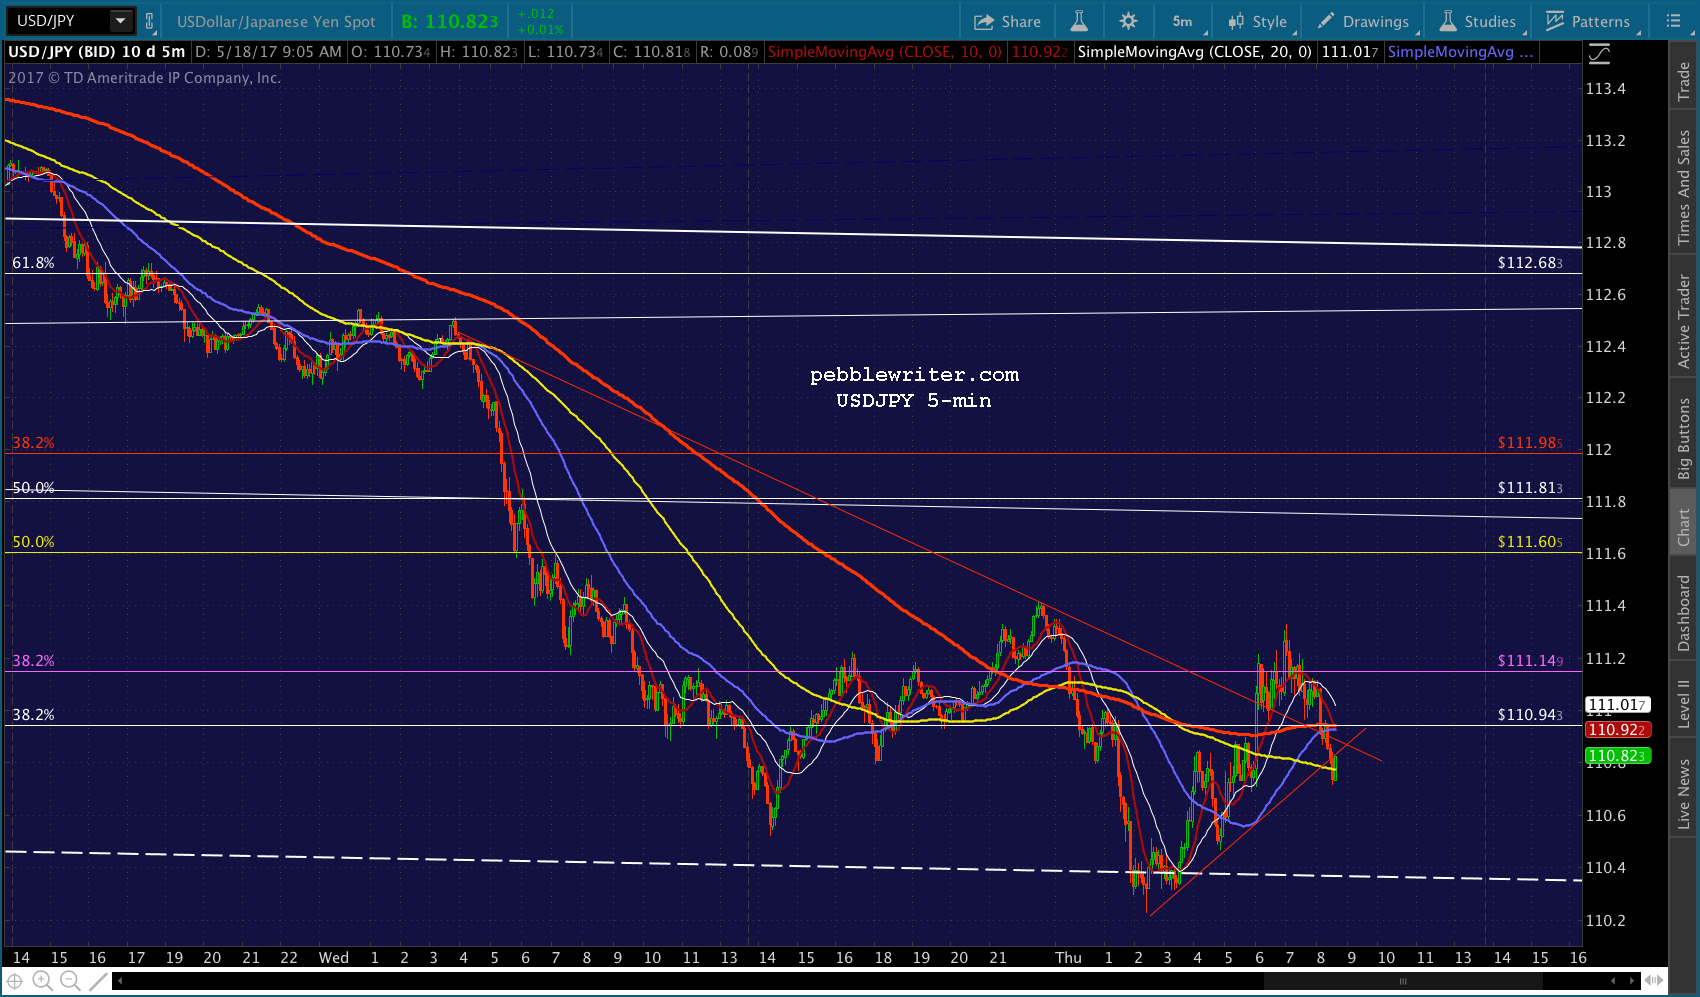 If they can pull it off, though, the target is right where the red TL was — what would have been a neckline had they not busted the right shoulder.
 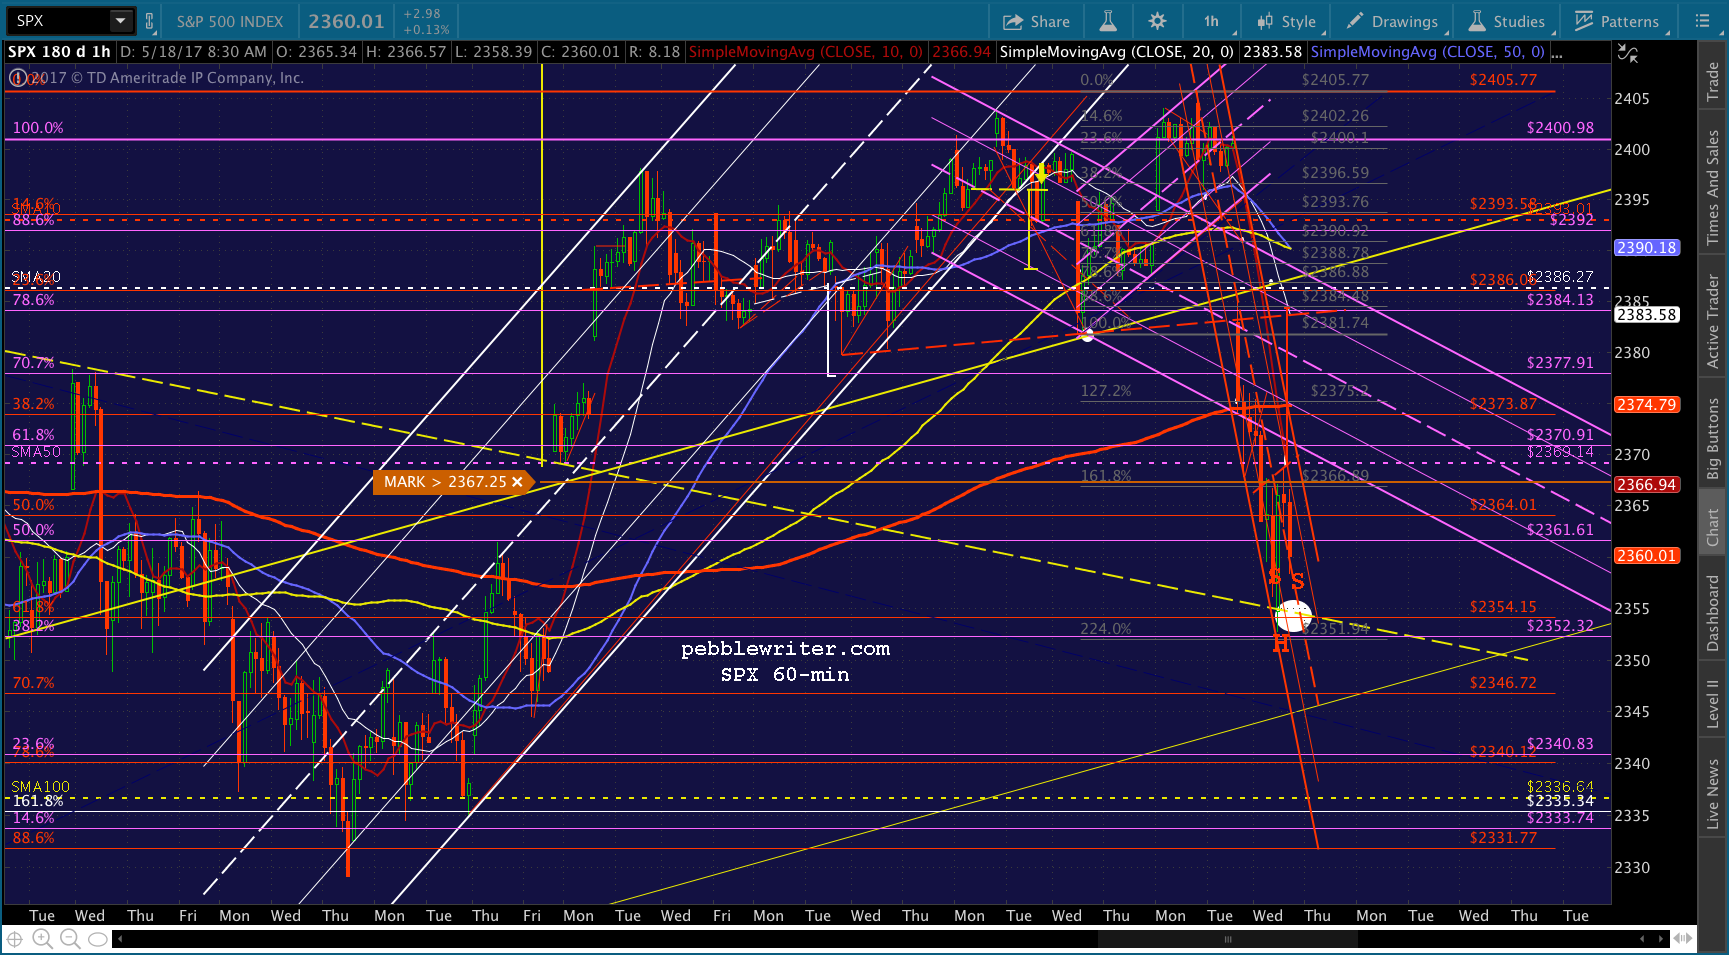 At the moment, though, it sure feels like momentum is dying.
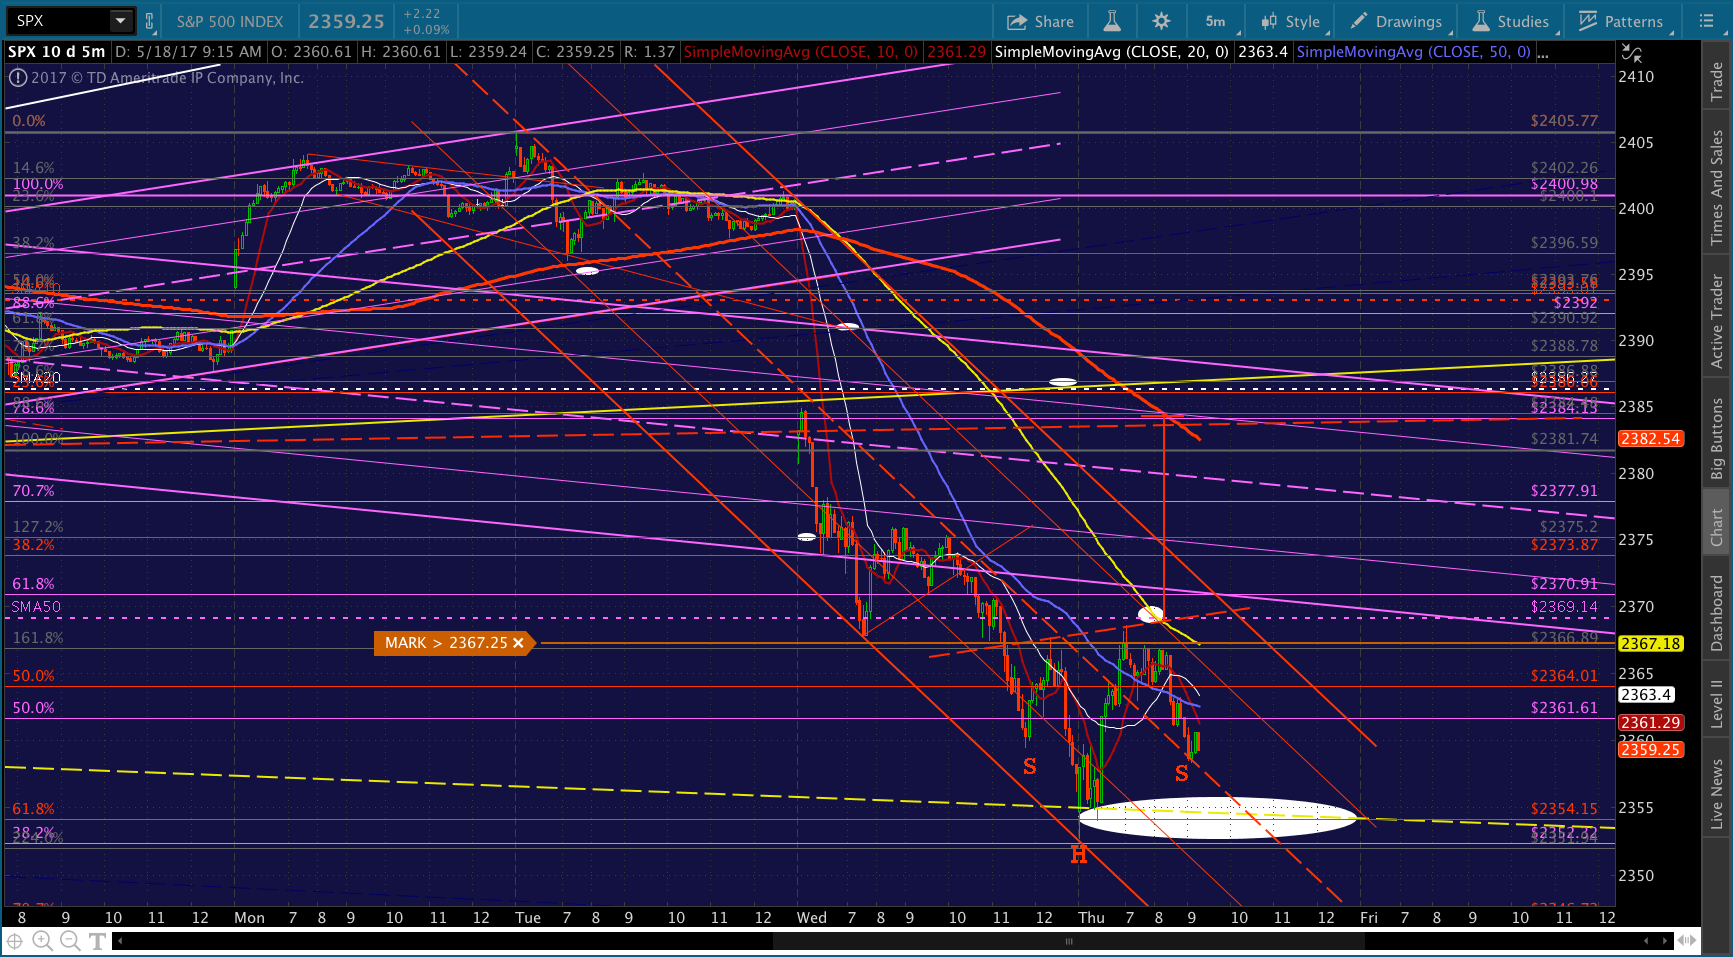 I can’t see how they effect a recovery unless VIX starts tanking very soon. That’s the problem with algos: they’ve been taught to pay attention to VIX’s every little twitch. Now, it’s making a bounce more difficult.
UPDATE: 1:08 PM
Talk about climbing a wall… VIX is breaking above the SMA5 100, and USDJPY is barely helping at all. I think this red TL is about to break down and SPX puts in another leg lower to 2354.53. I’d be prepared to go to cash on any sustained drop through the TL, currently at 2360.69 (ES, the SMA5 200 at 2358.75.)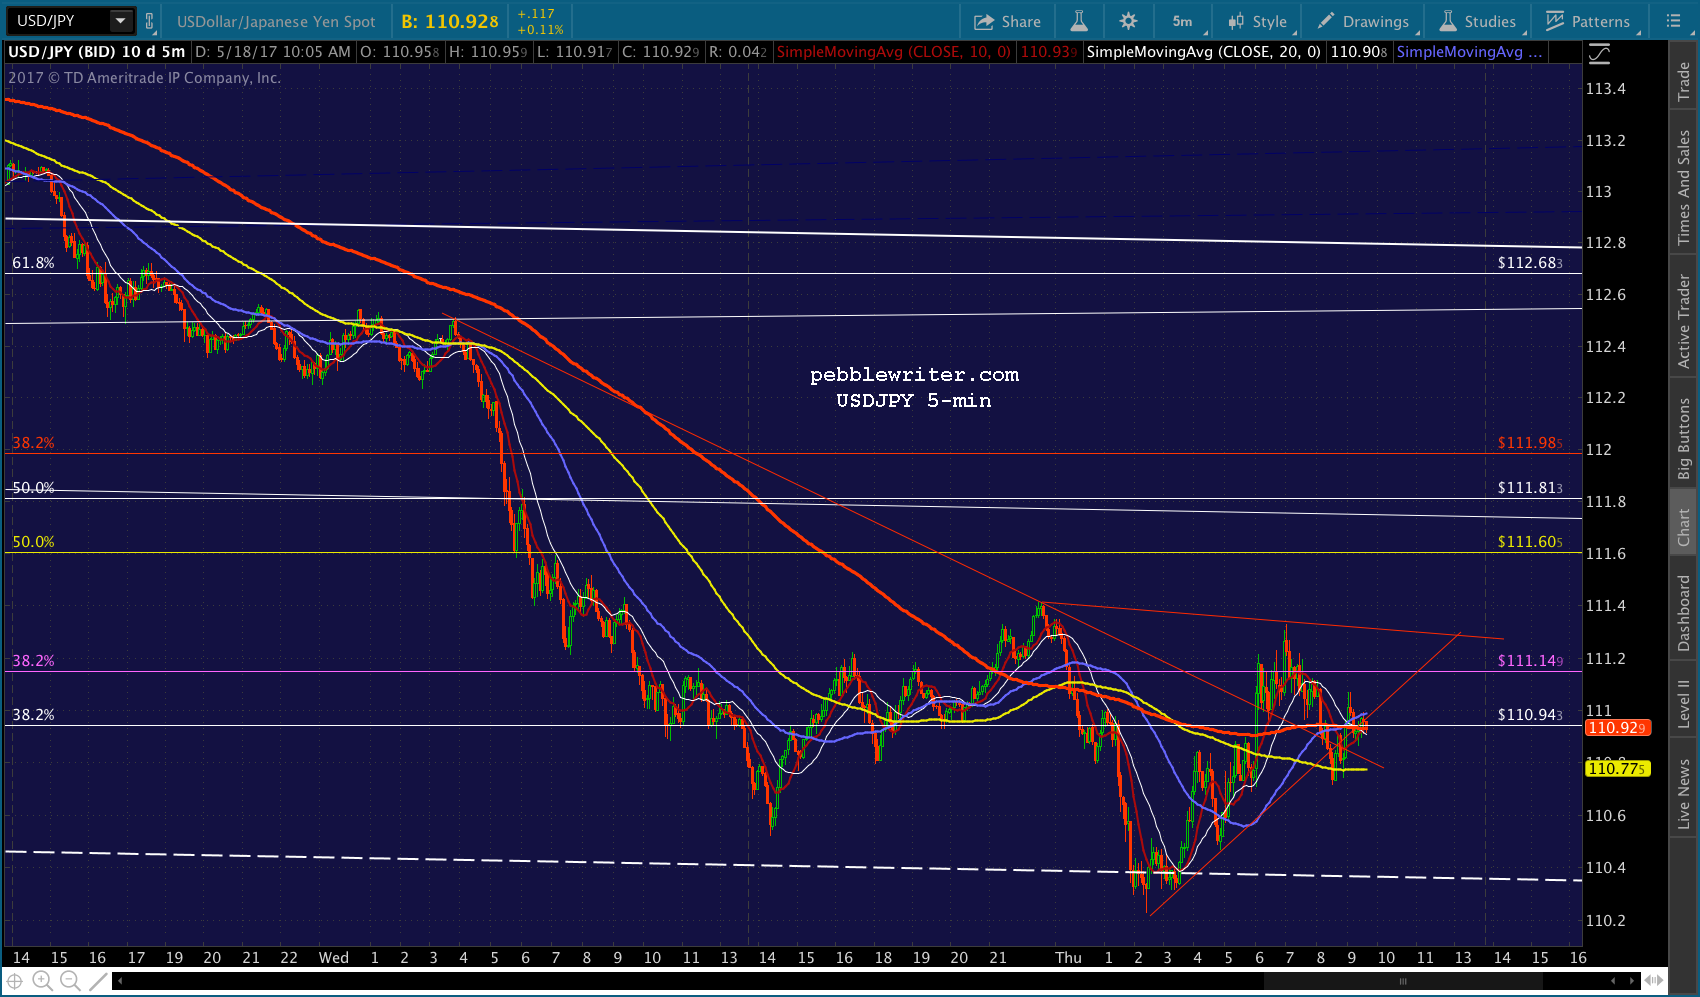
 UPDATE: 1:32 PM
A breakdown and backtest, followed by…a failure to break down! As long as ES can remain above its SMA5 200, I think we’re okay. As I’m typing this, USDJPY just shot higher — so that will help.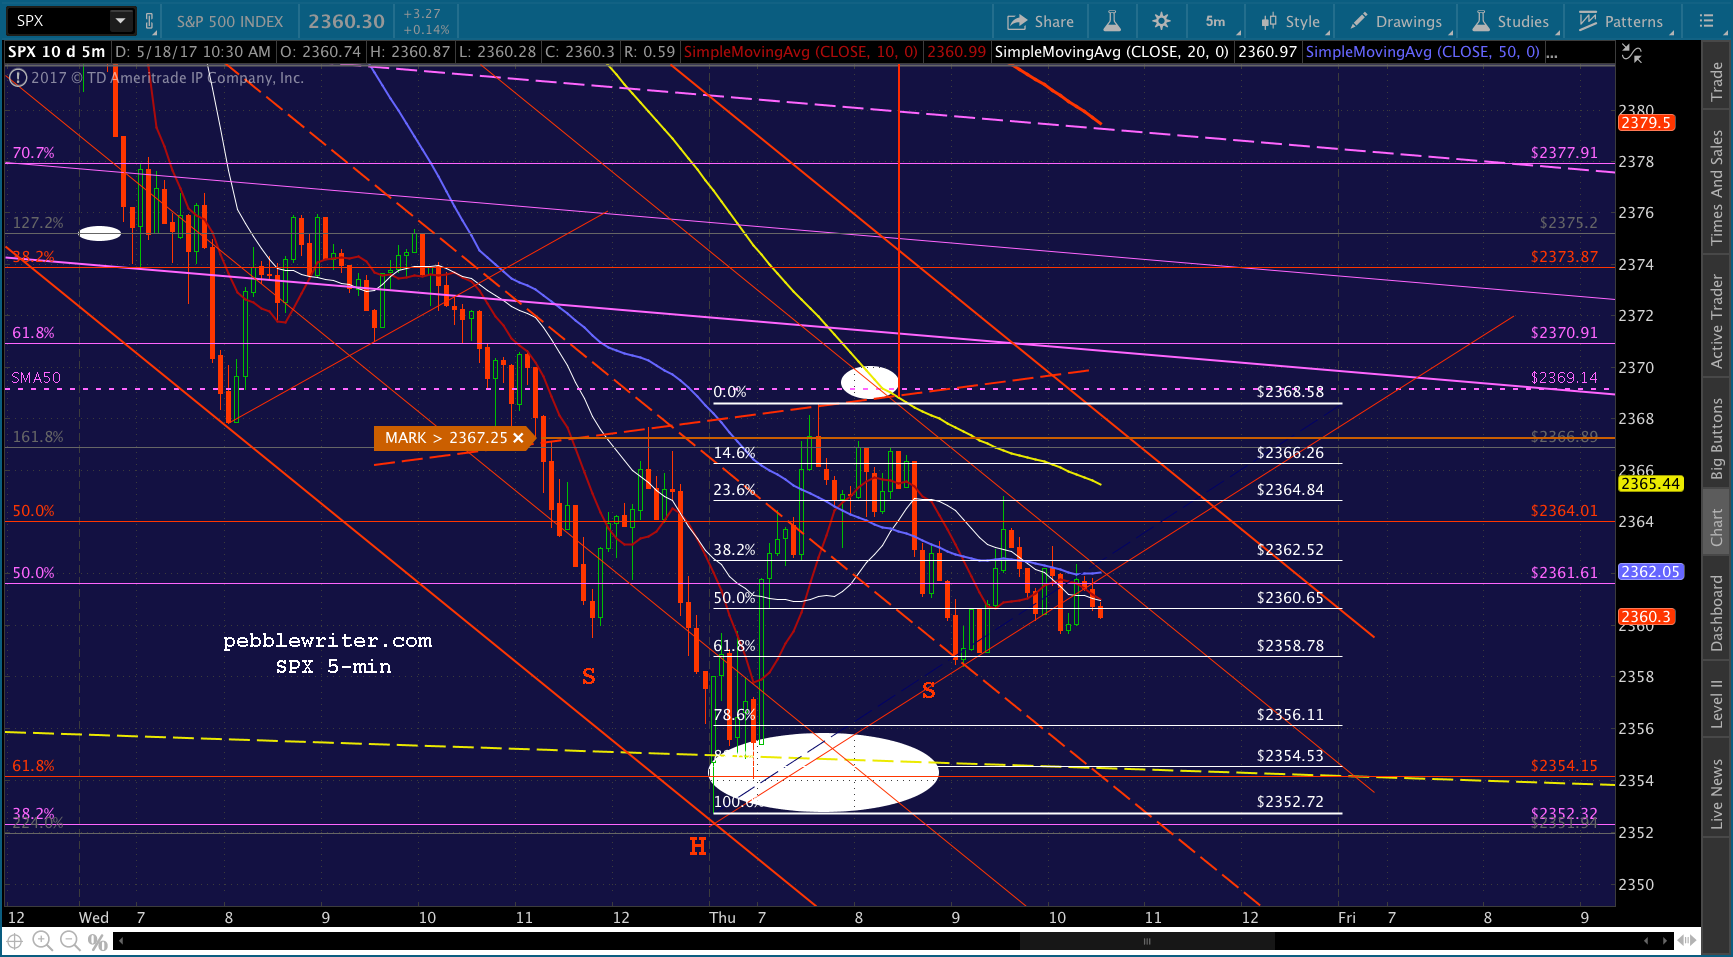
 This is really incredibly impressive. VIX has climbed 11% since its morning lows, but SPX is off only 6 points (0.2%) from its morning’s highs.
UPDATE: 1:47 PM
Feels like an important test for VIX and, therefore, SPX. It would be smart for VIX to backtest the rising SMA5 200 as it tops the white midline at 14.63. Then SPX could break above the red TL and, potentially, the SMA5 100 too. At some point, they probably have in mind to backtest VIX’s SMA10 at 13ish.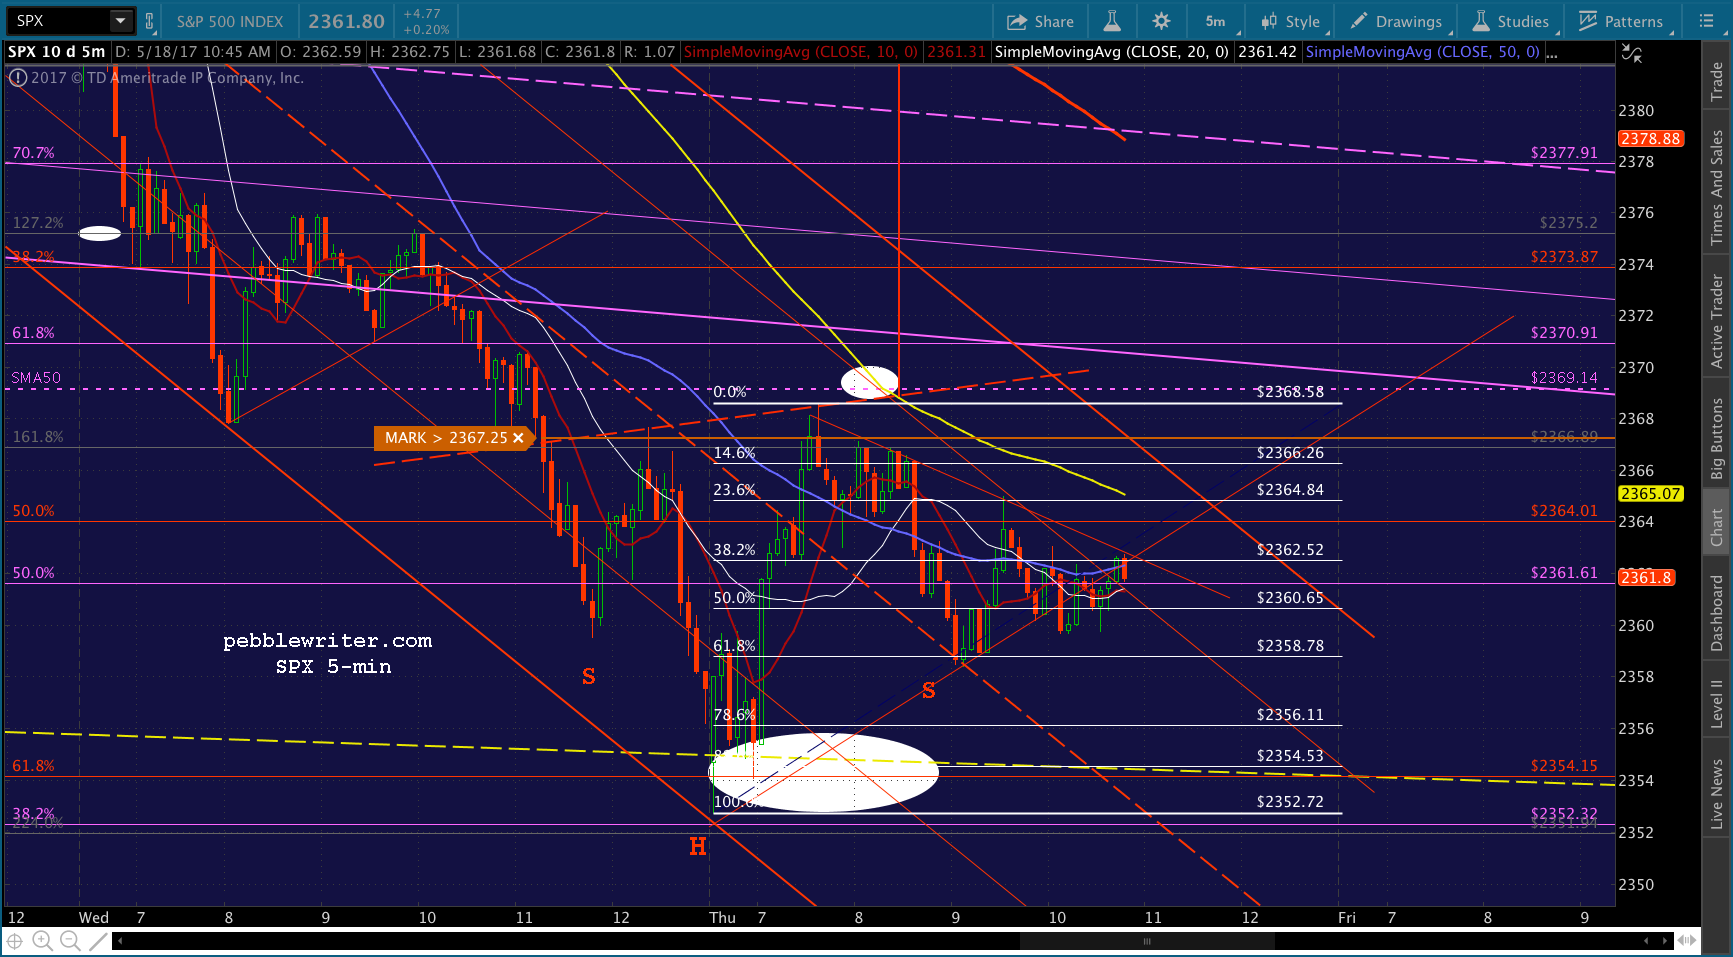
 Okay, and USDJPY to the rescue, too.
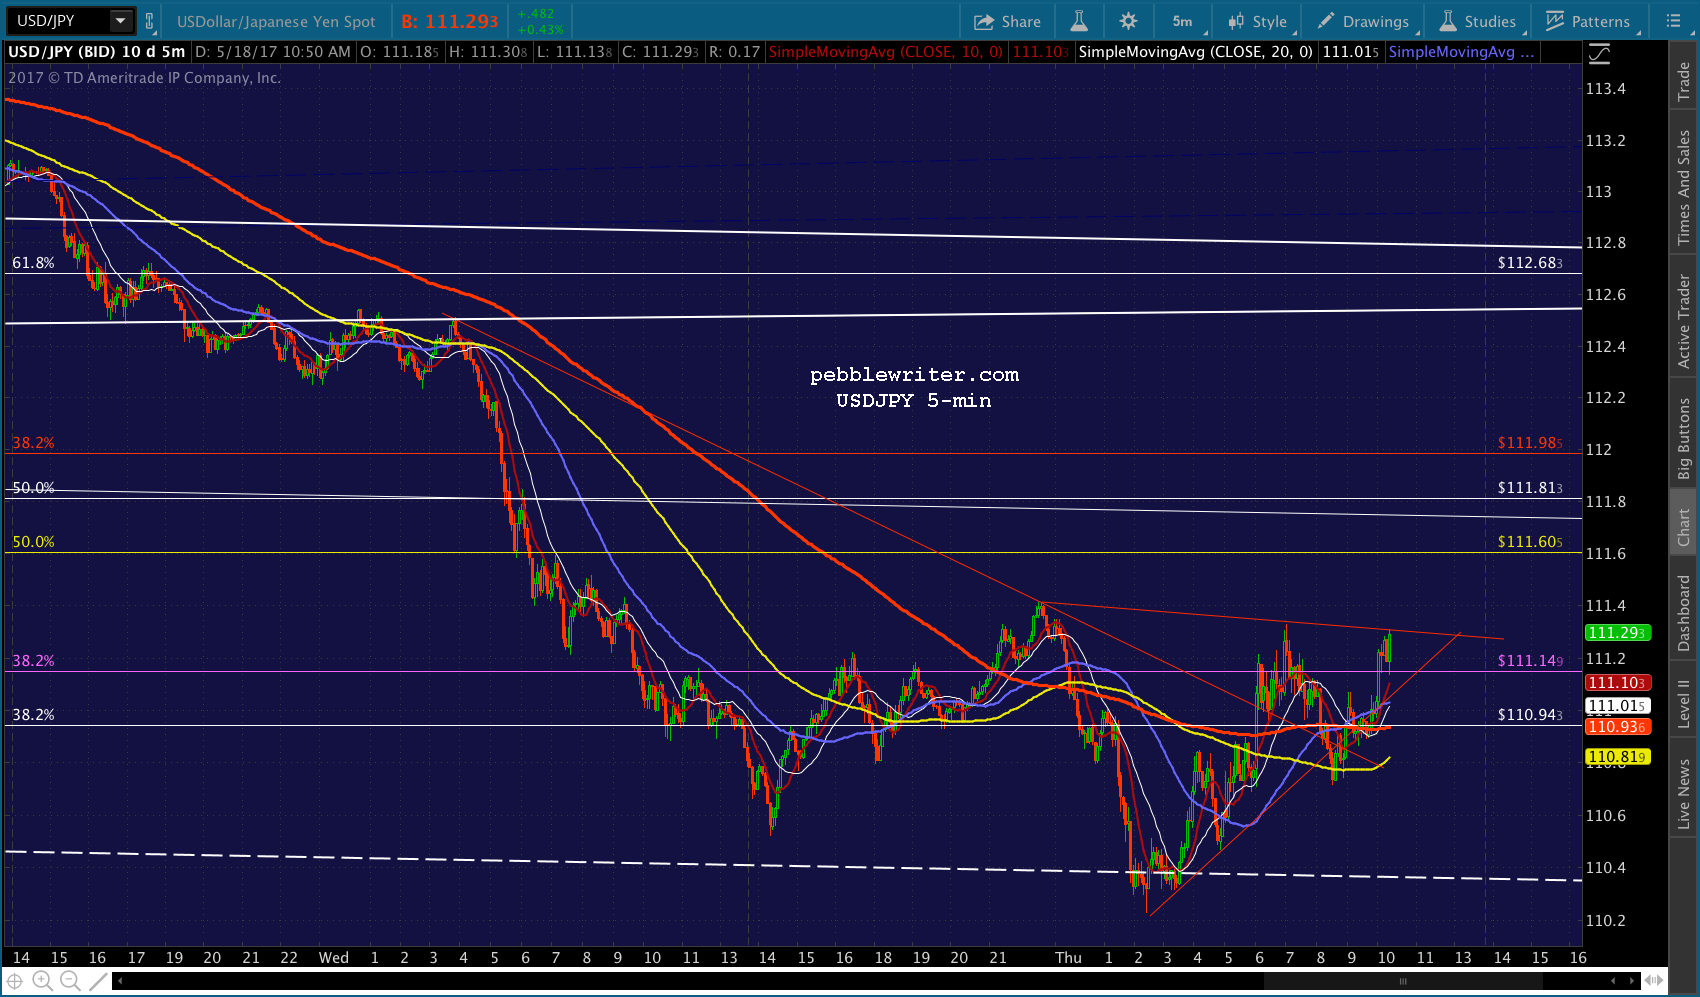 UPDATE: 1:55 PM
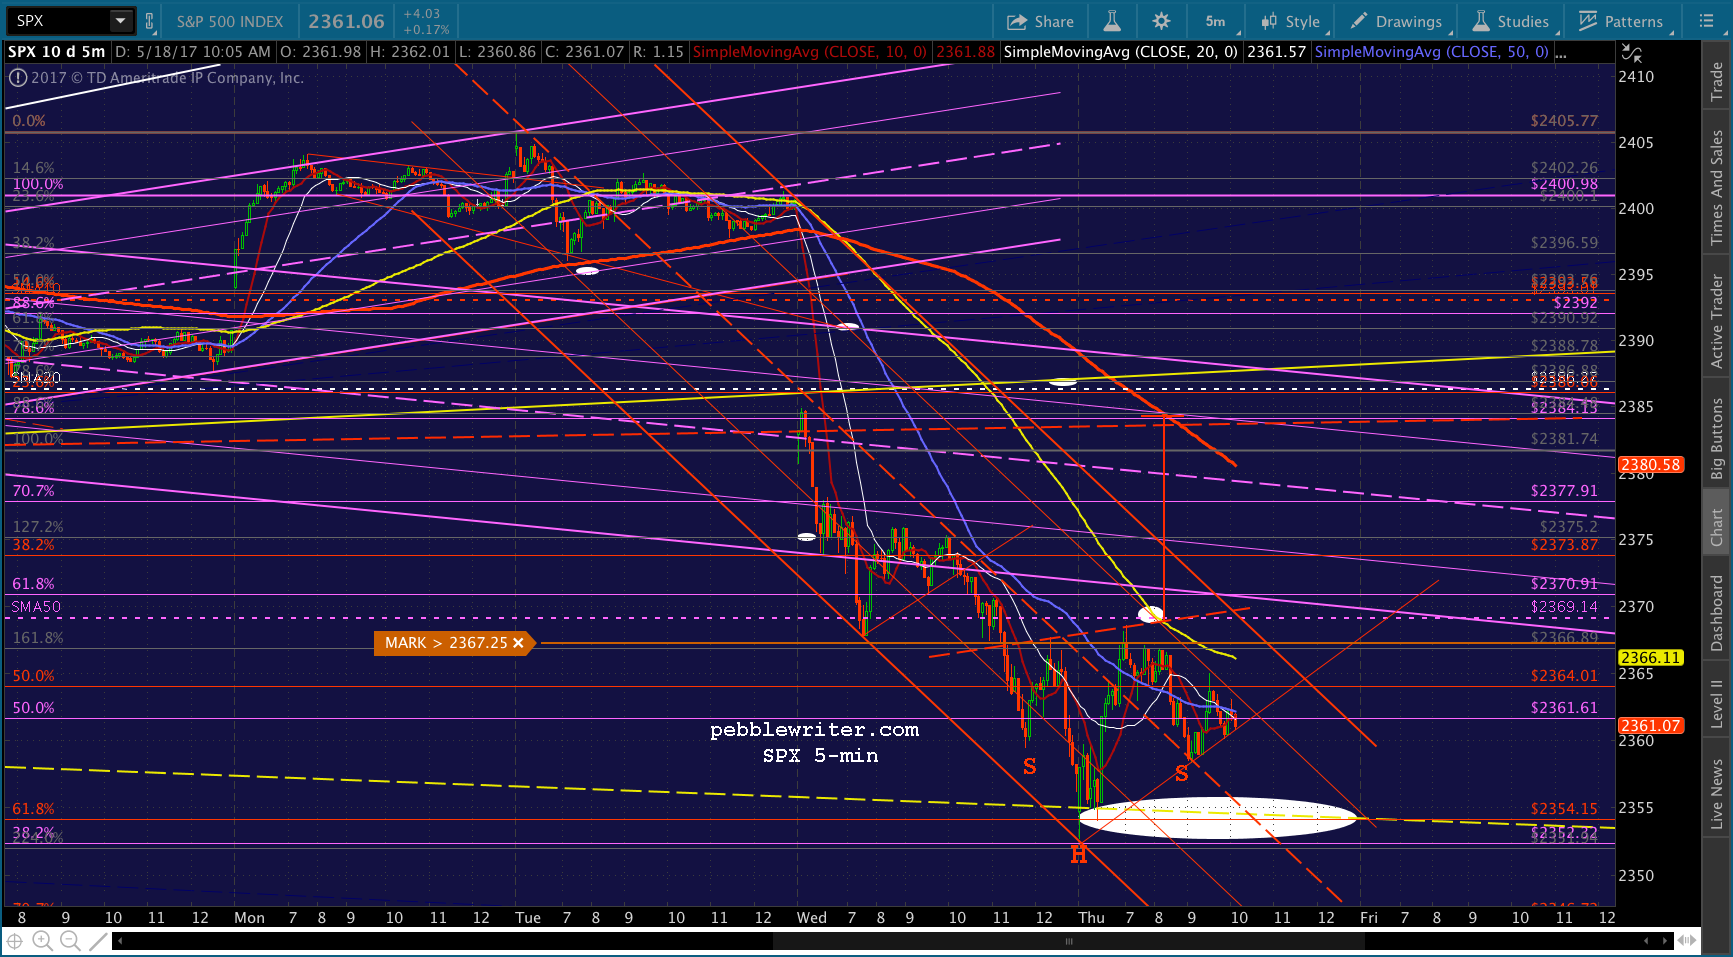
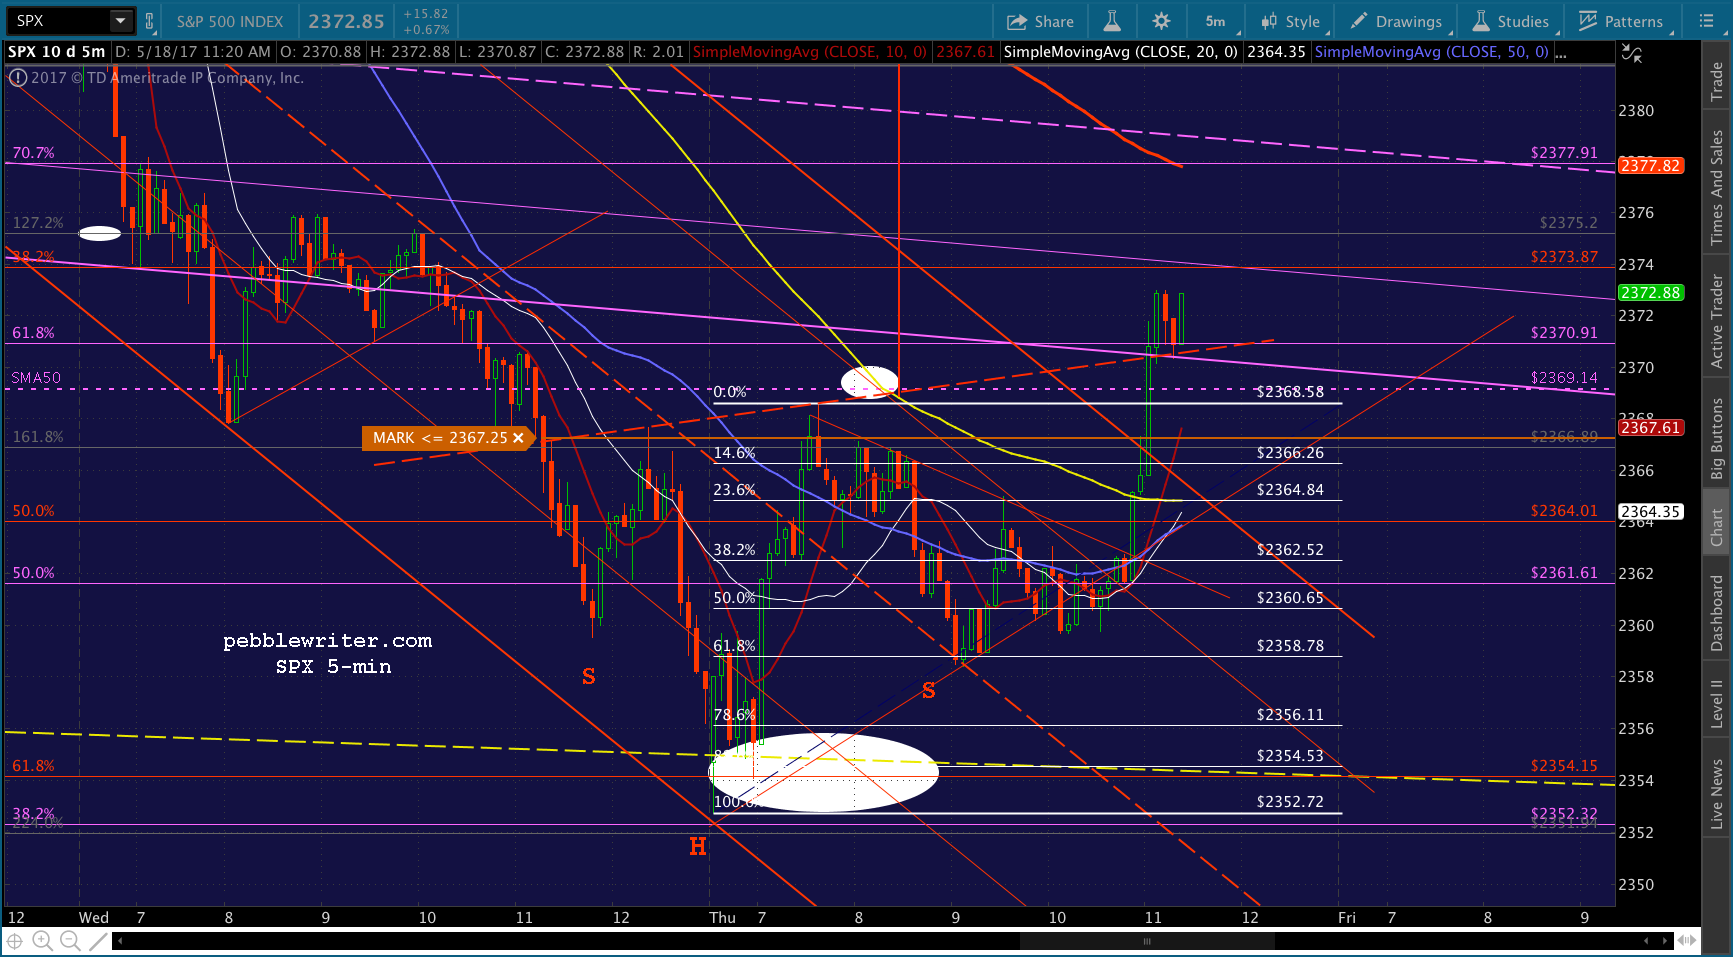
Pretty strong move — thanks BoJ! VIX is now doing the backtest discussed above. SPX coming up on the red channel top at 2367.25ish, and VIX has more to go if needed. From here, it’s just a matter of limping into the close with VIX 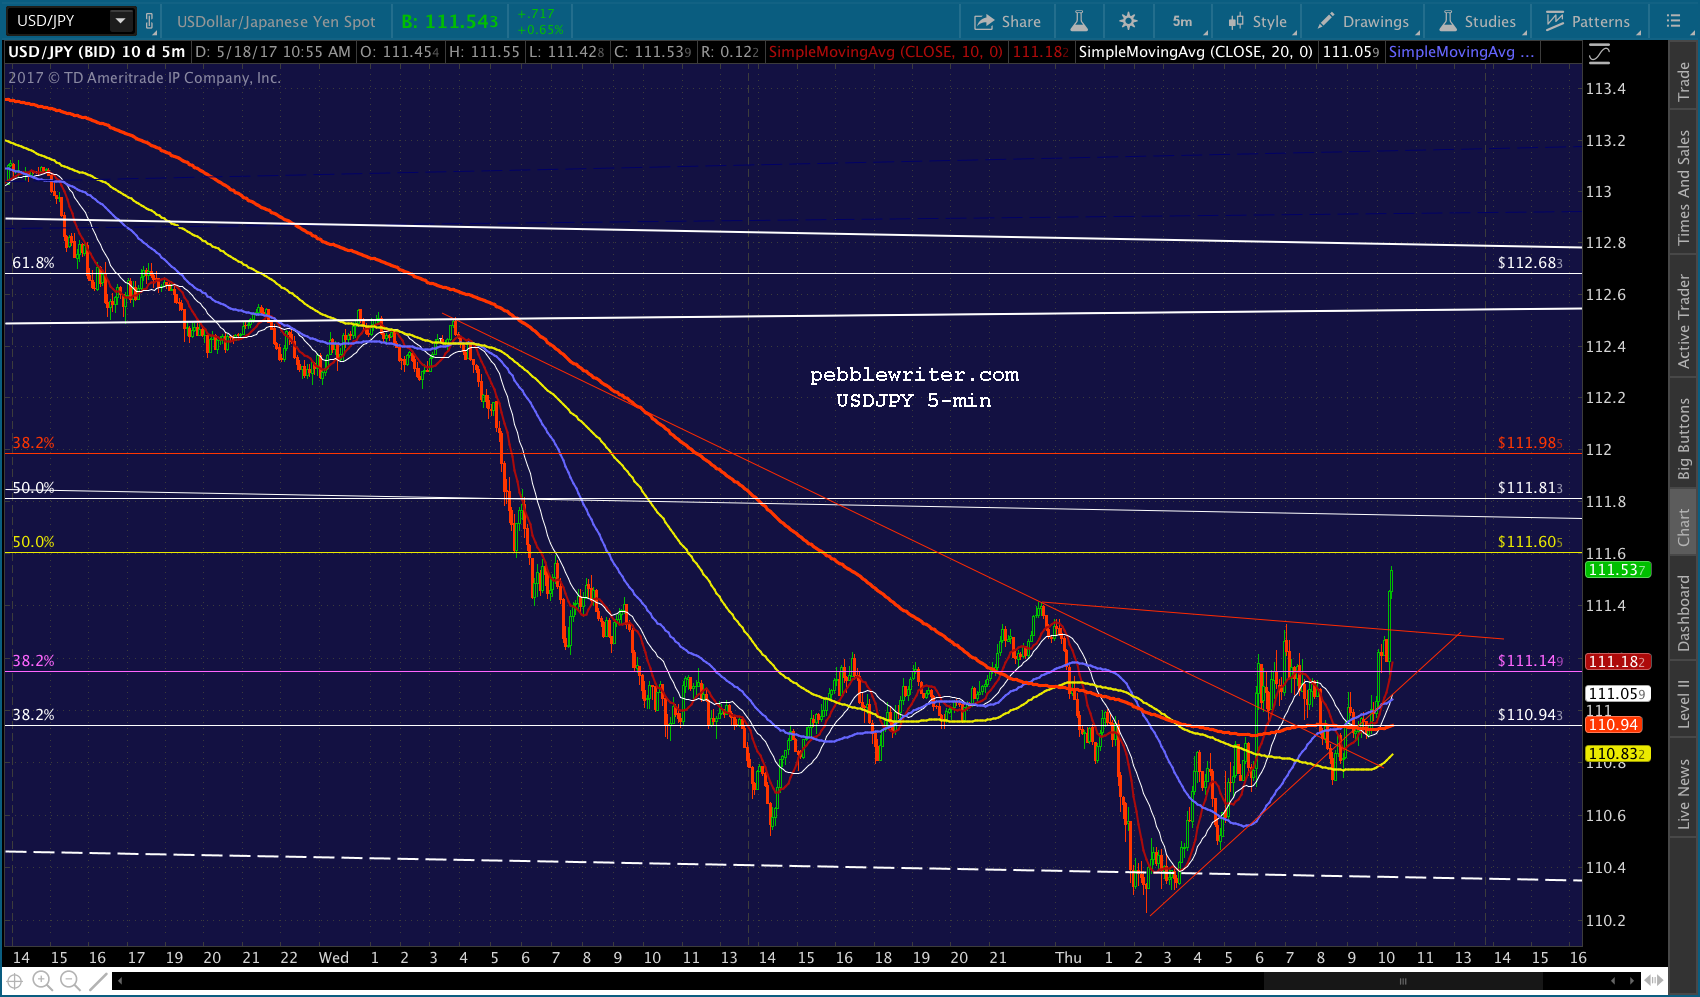
 UPDATE: 2:04 PM
Through the necklines…and VIX still has further to go if needed.

 UPDATE: 2:11 PM
VIX at SMA5 200 and TL and midline. If it bounces here, SPX goes into backtest mode. If it drops through, SPX gets a free pass to top the SMA5 200. I’m guessing it backtests the neckline here, and tries to limp into the close on top of it. After the close, VIX can rally up to 18.12-18.50 without any effect on stocks, then use the drop from there to fuel the next leg up tomorrow. For traders, this is probably as good as it gets today — unless they drive VIX beneath support (14.64) here. So, not a bad place to go to cash for the time being, but you’d want to be long again if VIX drops through.

 UPDATE: 2:23 PM
VIX indicating a break down — probably just enough to keep SPX aloft, but clearly trying to avoid SPX slipping back down. Note that the SMA5 10 is rising rapidly, will be there for support pretty soon.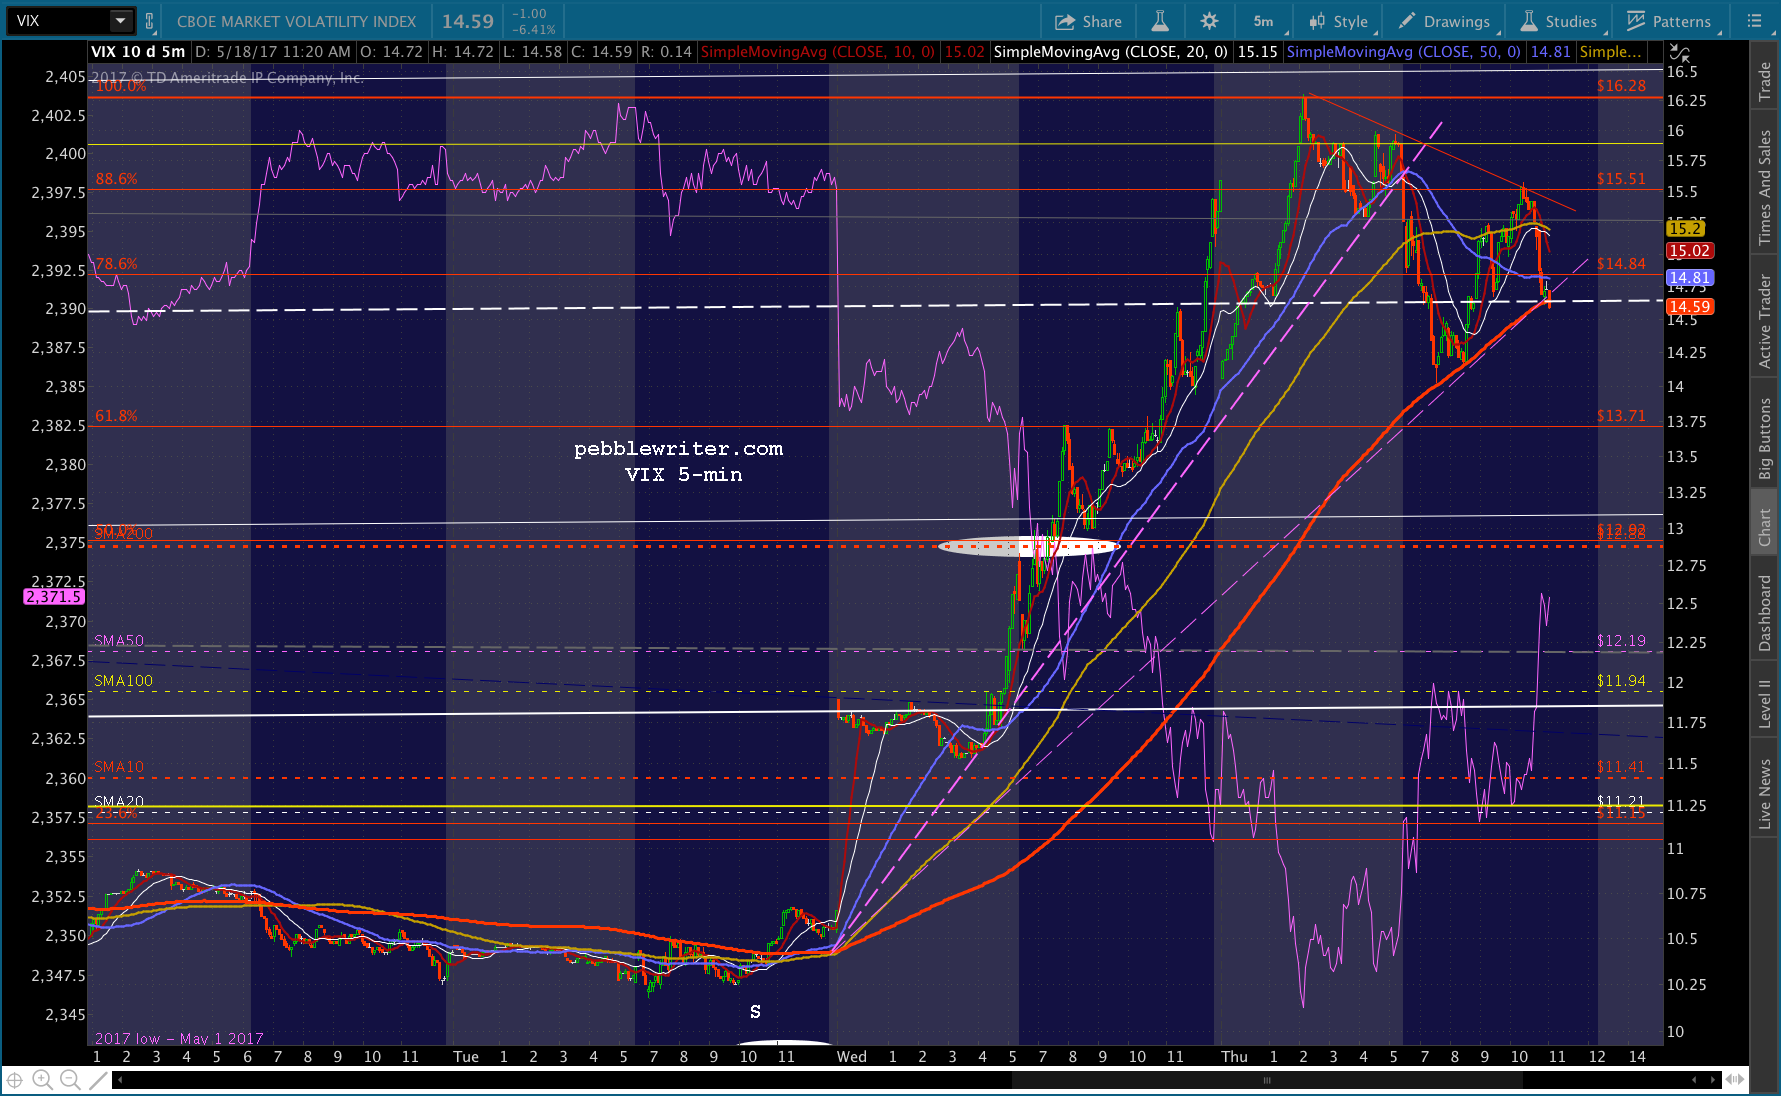
 UPDATE: 2:55 PM
Backtests complete for SPX and VIX…
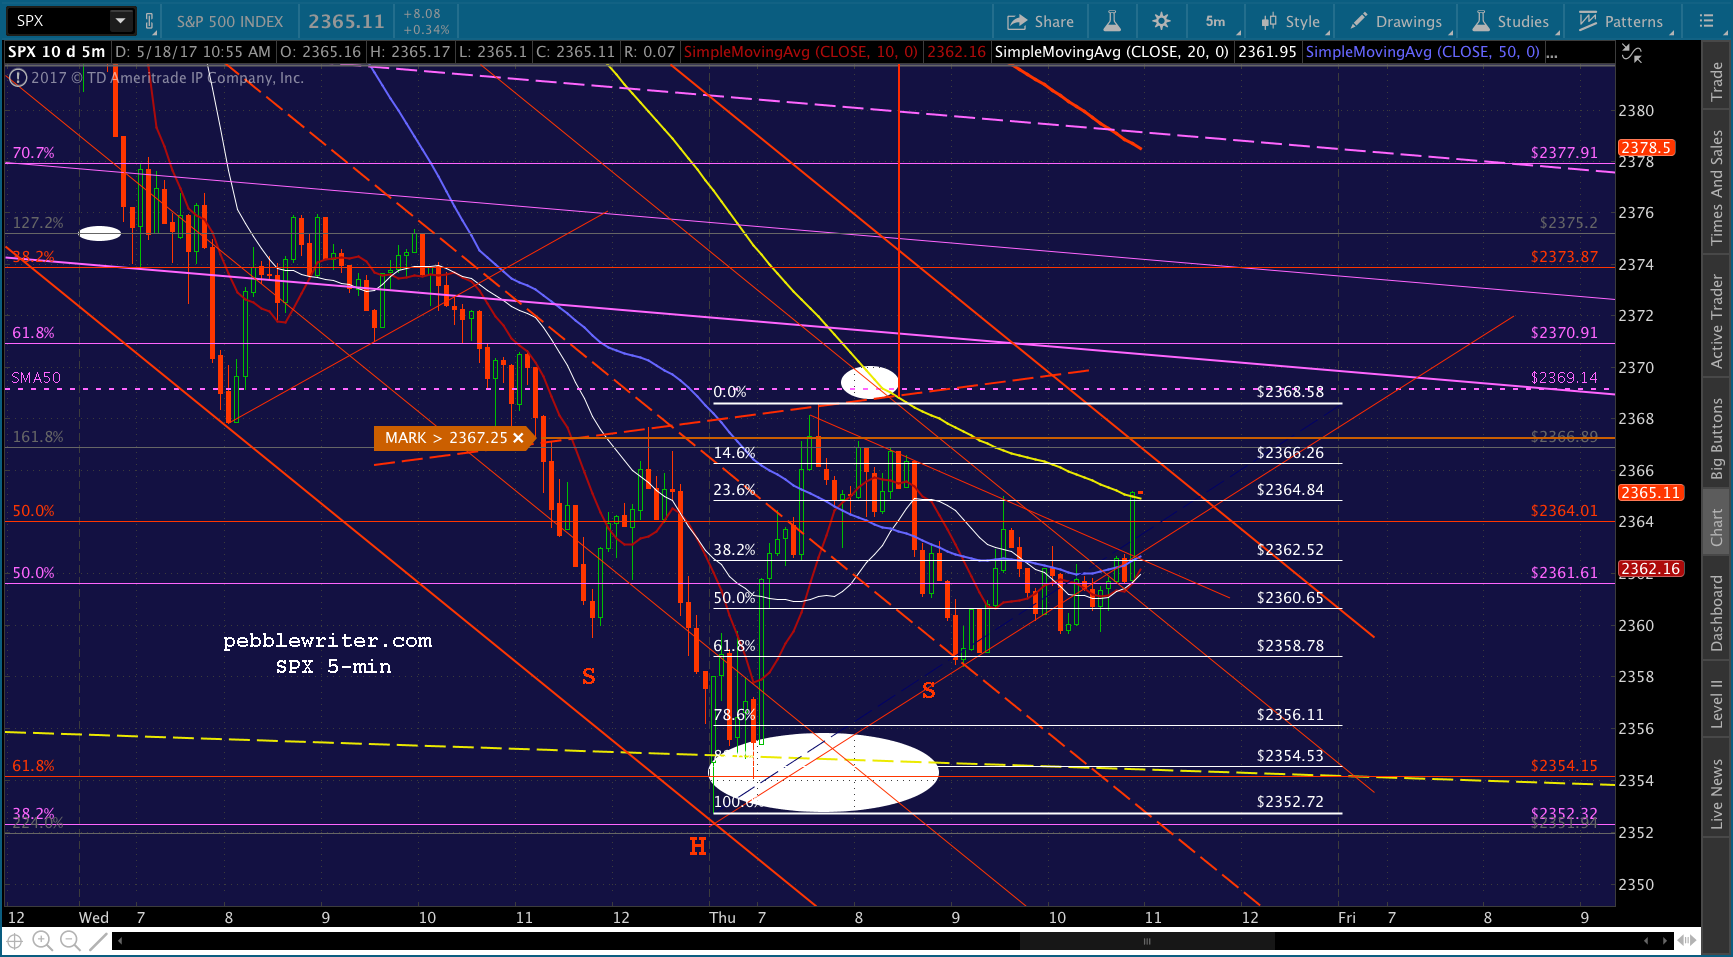
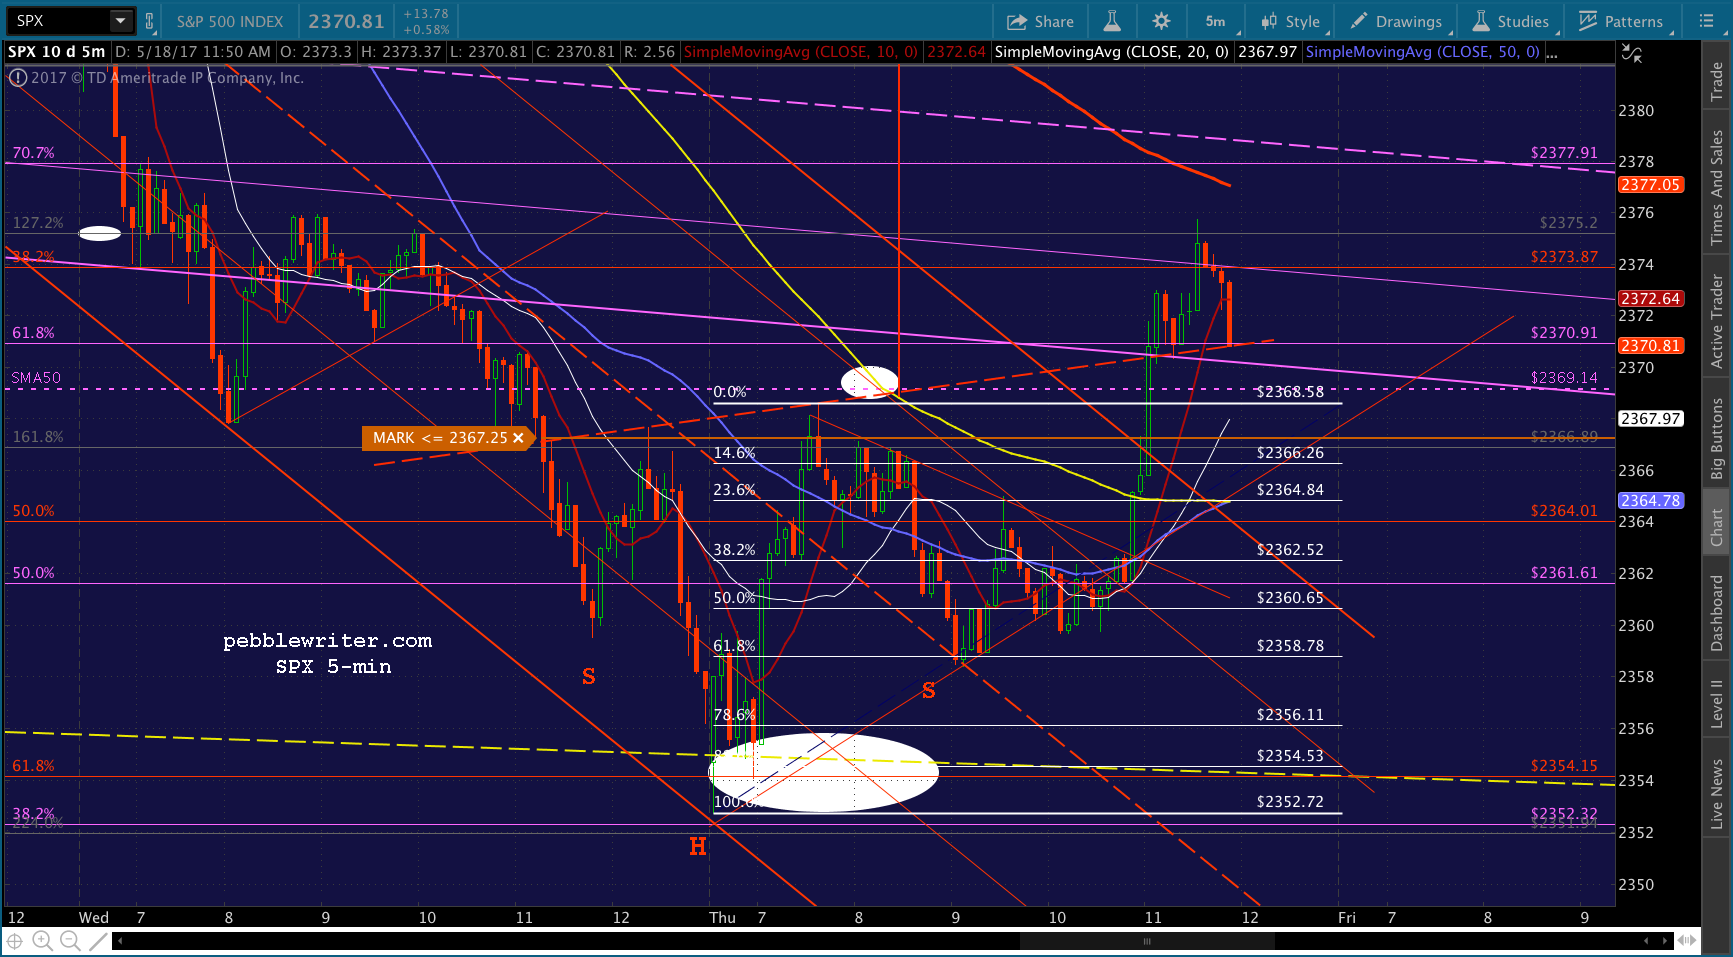 …though ES has a little further to go, about 2367.50. This should enable SPX to backtest the SMA50 at 2369.14.
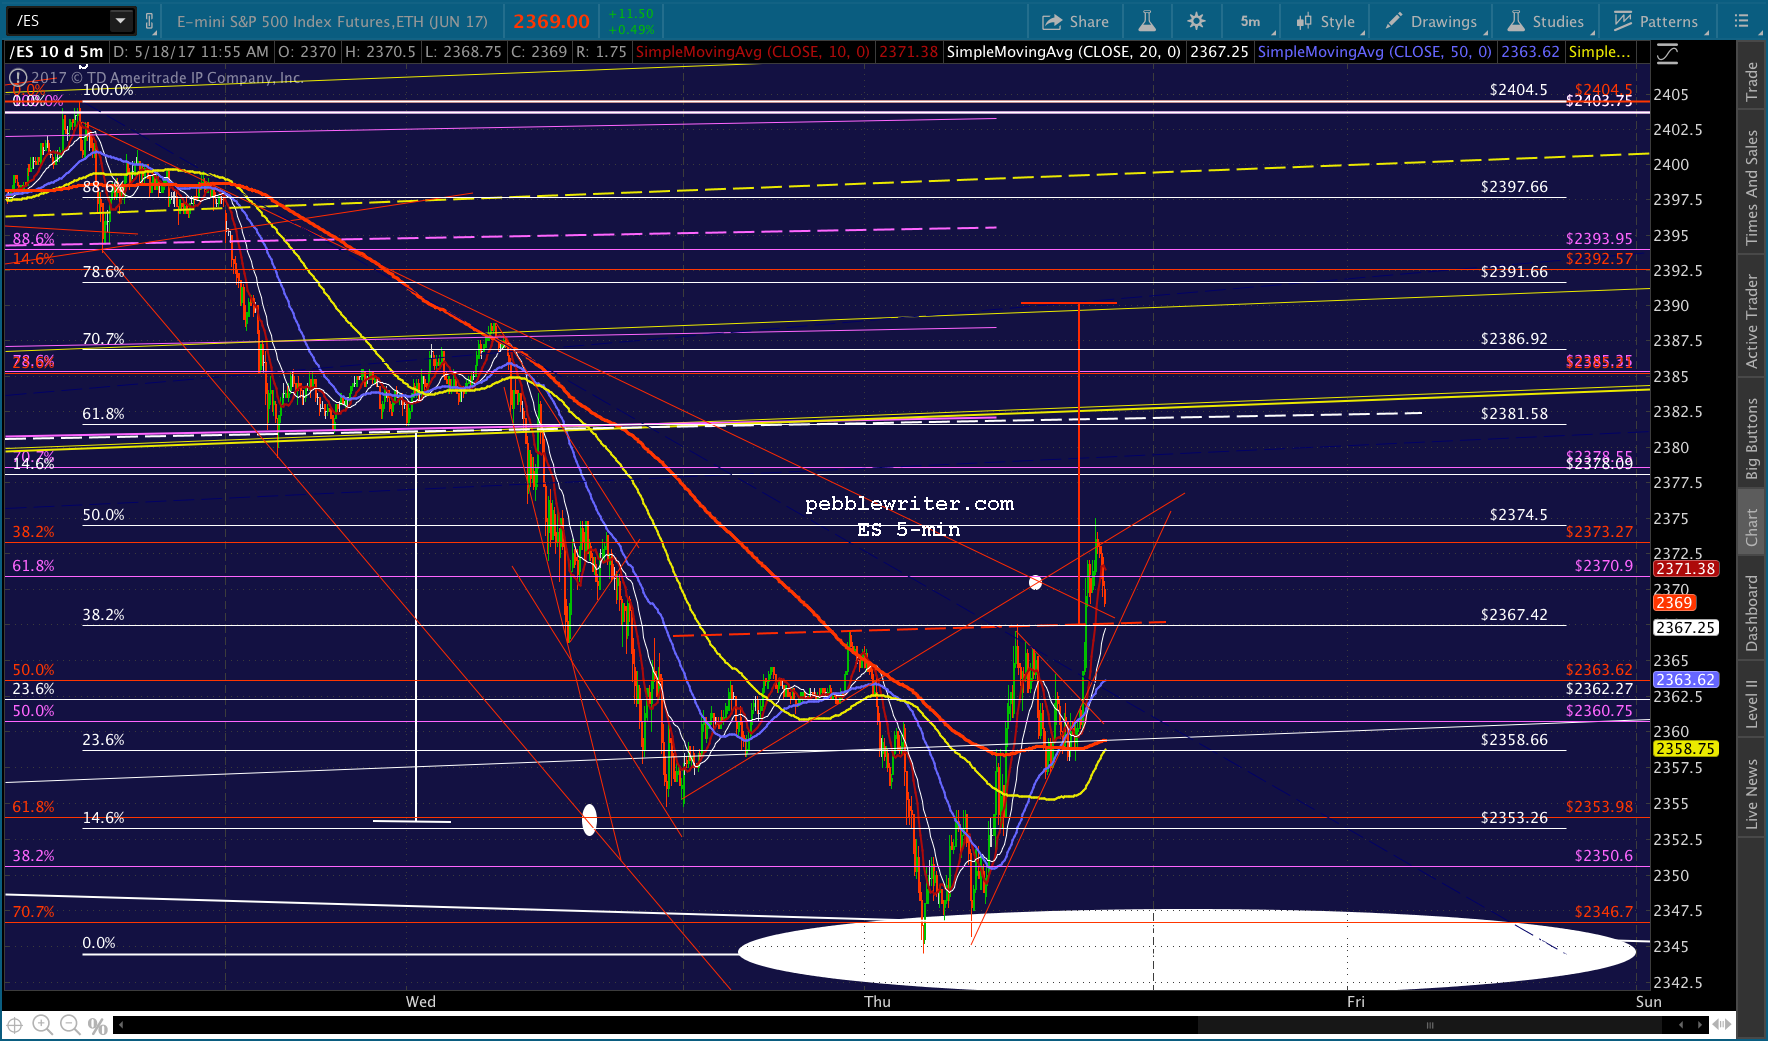 It’s important to note that SPX is back within the falling purple channel, and that the IH&S targets the top of the channel where the “neckline” intersects it at 2384 on Monday.
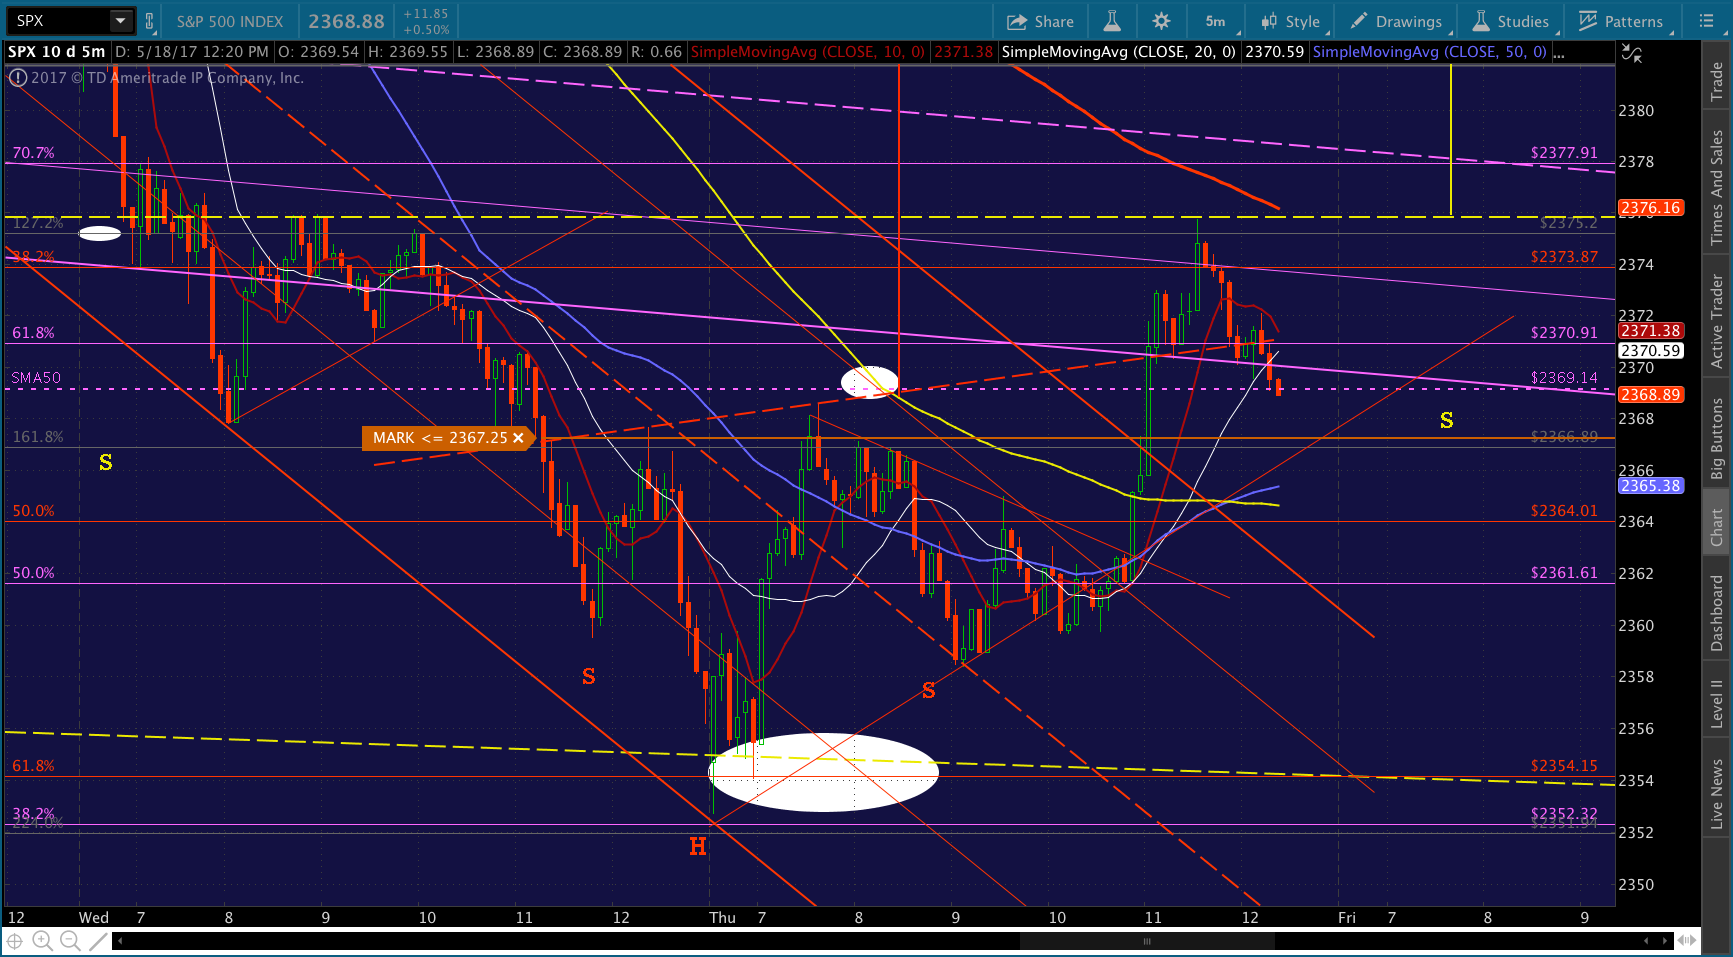
And, if 2375 is topped, it will have completed another IH&S targeting 2400 – below in yellow. There’s obviously a lot of resistance between here and there, and potentially many more headlines to digest. But, I’m fairly confident that’s the plan.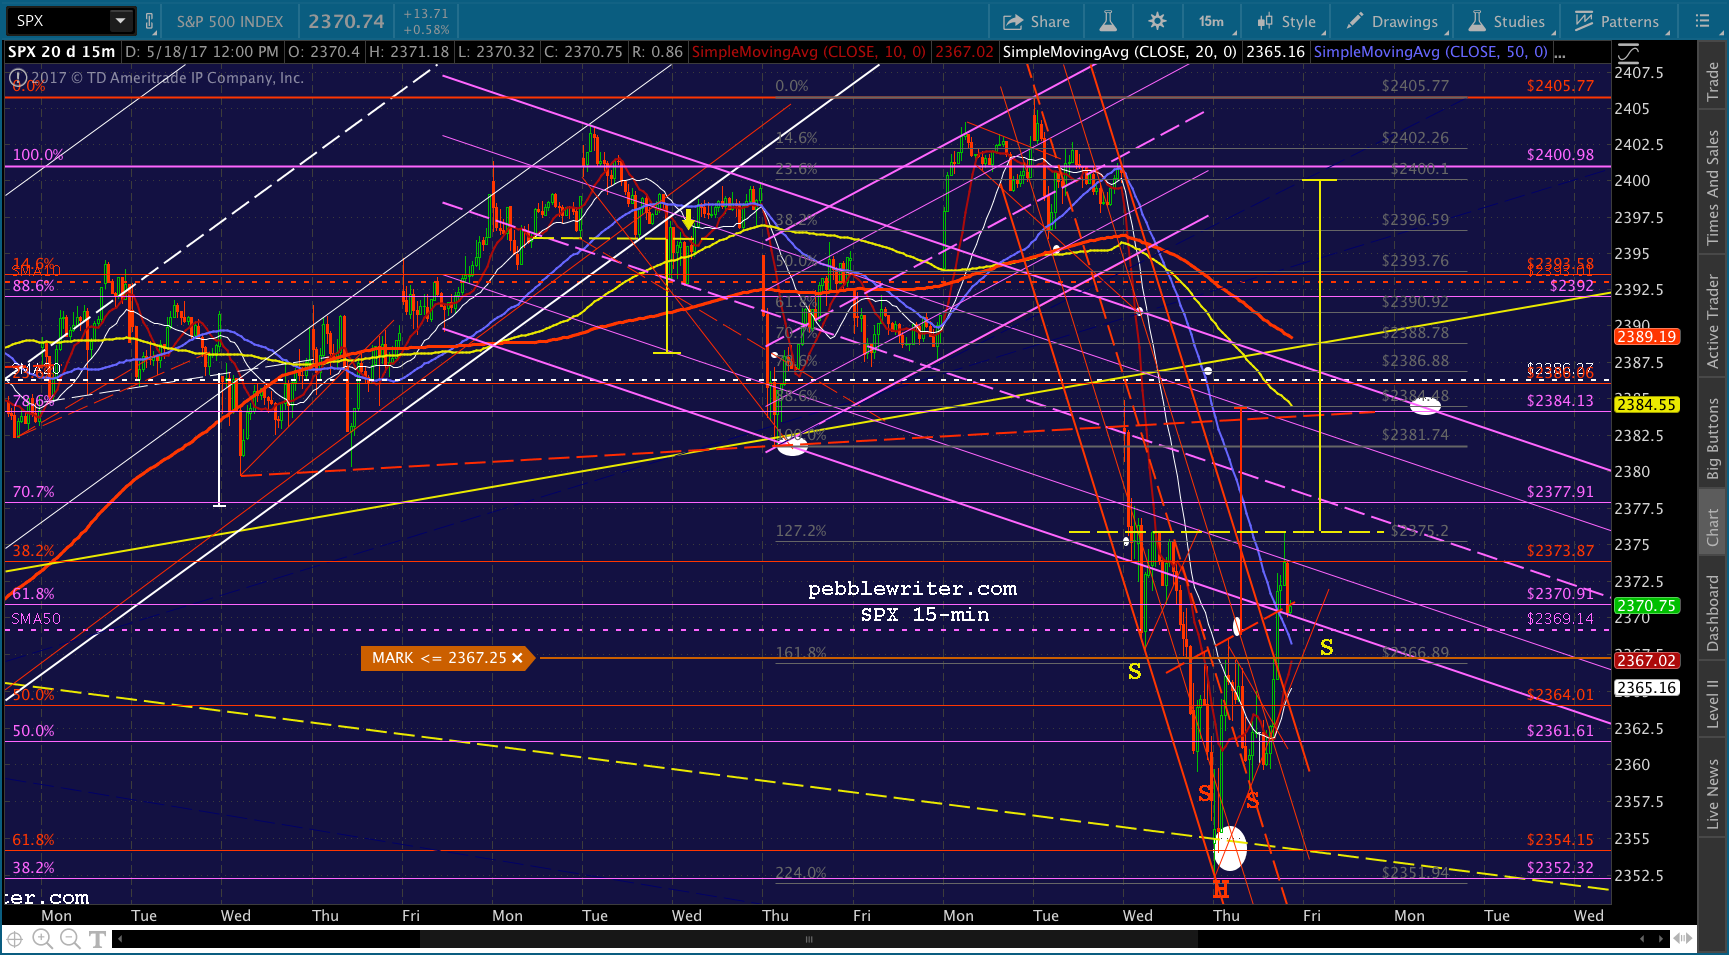 UPDATE: 3:21 PM
SPX’s SMA50 and ES’s neckline tagged. Might be the last chance to go long for the next leg up. As always, keep a close eye on stops. 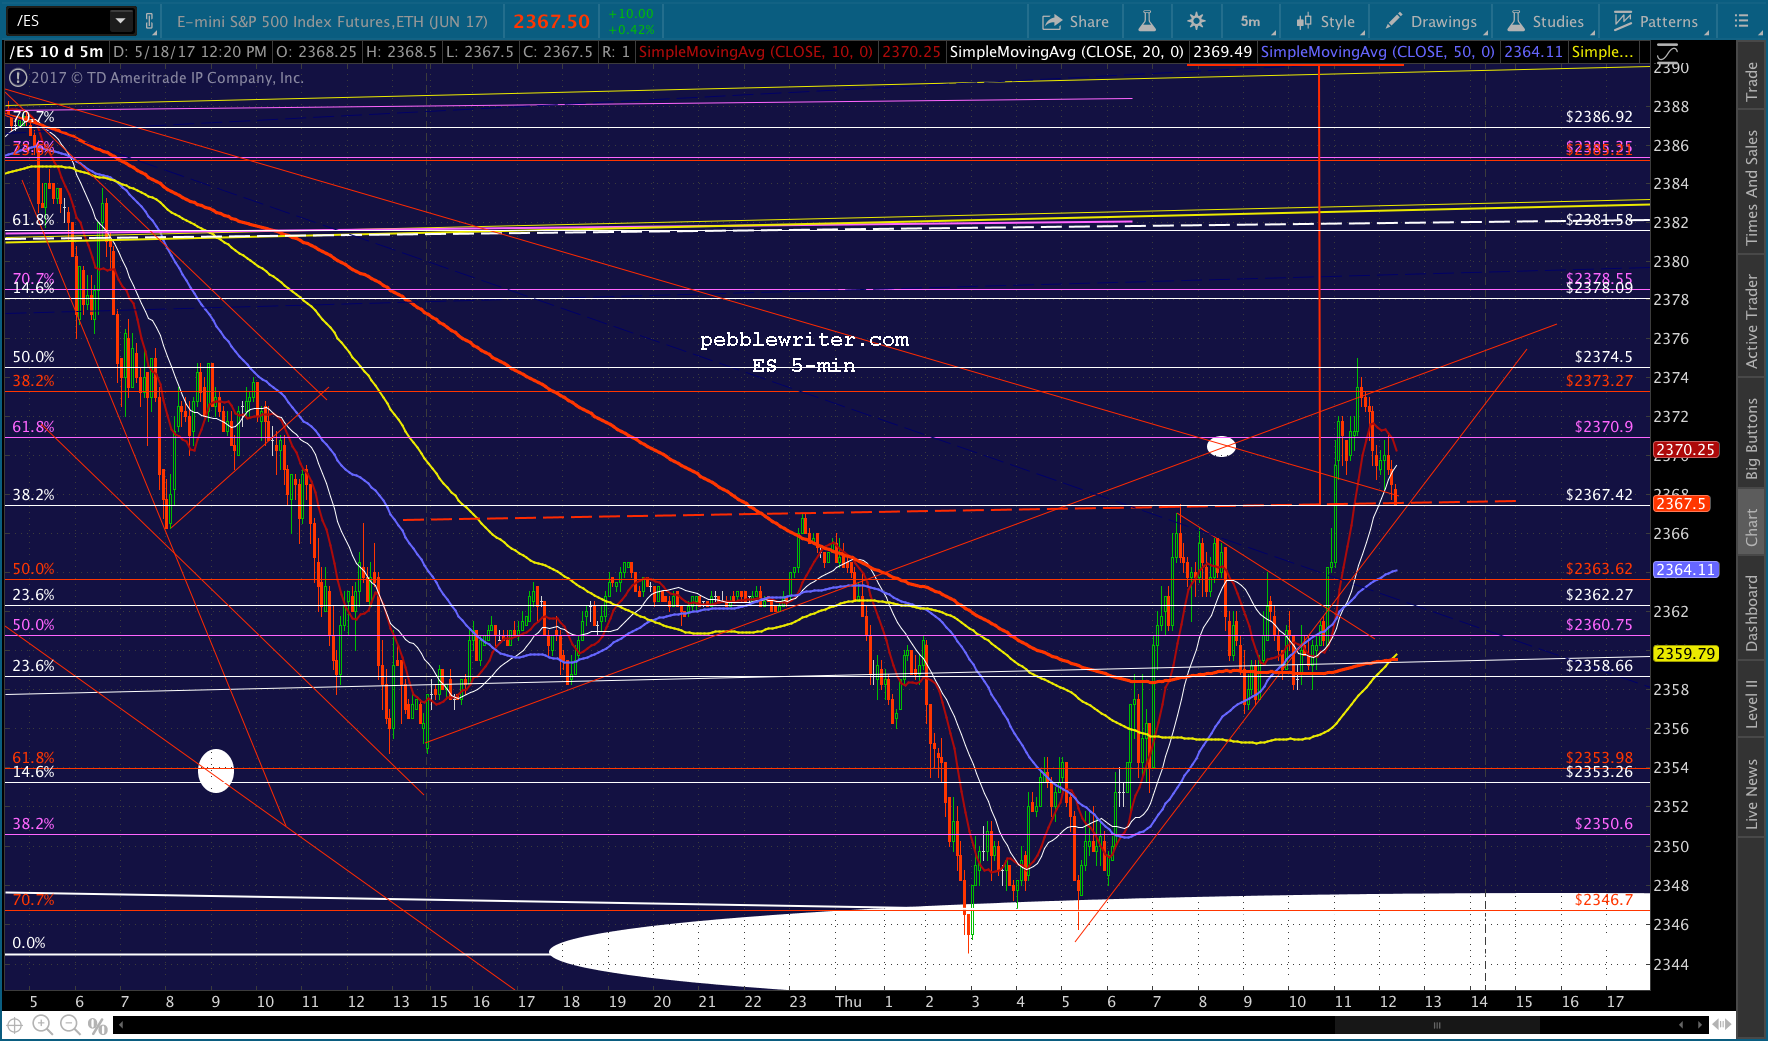
 UPDATE: 3:32 PM
Unless someone does/tweets/leaks something really troubling in the next 30 minutes, this should be the extent of the right shoulder and a pretty solid entry point. Note: doesn’t mean there won’t be any head fakes, etc. And, there have been plenty of troubling headlines lately! We’ll wrap with the usual caveat not to hold long unless you can hedge or deal with the potential for a gap lower overnight. This feels pretty solid. But, there have been many IH&S that didn’t work out for one reason or another. Almost all of them failed to get back to the neckline due to overriding fundamental issues [see: Ten Lousy Points.] Don’t think it can’t happen again.