

I spend a lot of time and energy trying to spot potential downturns. I think the average buy-and-hold investor needs to know when downside risk is elevated and when events occur that could trigger a substantial drop. Even when things are apparently going well, I always post support levels just in case. While there’s a cost to missing the best rallies, there’s also a cost to getting caught in the biggest plunges.
Traders, of course, see big downside plunges as potential opportunities. Whether they short the market or merely step aside, turning points are vitally important to their success. This leads us to the current setup.
Stocks broke out of a falling channel two months ago when Trump held a big press conference in the Oval Office to announce the Phase One deal (it wasn’t) with China [see: Melting Up.] Since then, the market has been, well, melting up — paying little attention to overhead resistance and making higher highs seemingly every other day.

The rising red channel above ran into the top of the (less aggressively) rising purple channel on Nov 19. It wasn’t until Dec 12 that it finally punched through – a breakout which leads to 3300 by year-end. In the process, it reached our ES 3175 target well ahead of schedule.
The downside risks certainly haven’t gone away. From all appearances, though, they have been back-burnered for the remainder of 2019 – 10 more sessions. We’ll review our upside targets and see if we can spot any potential bumps in the road.
continued for members…
There are important differences between the ES and SPX charts. But, they both agree on the potential importance of certain price levels.  Having ignored the yellow 2.618 and white 1.272, SPX’s next major Fib targets are the white 1.618 at 3306.51 and the white 2.24 at 3675.53. It’s perhaps significant that the yellow IH&S targets 3673 – right on top of the 2.24 Fib.
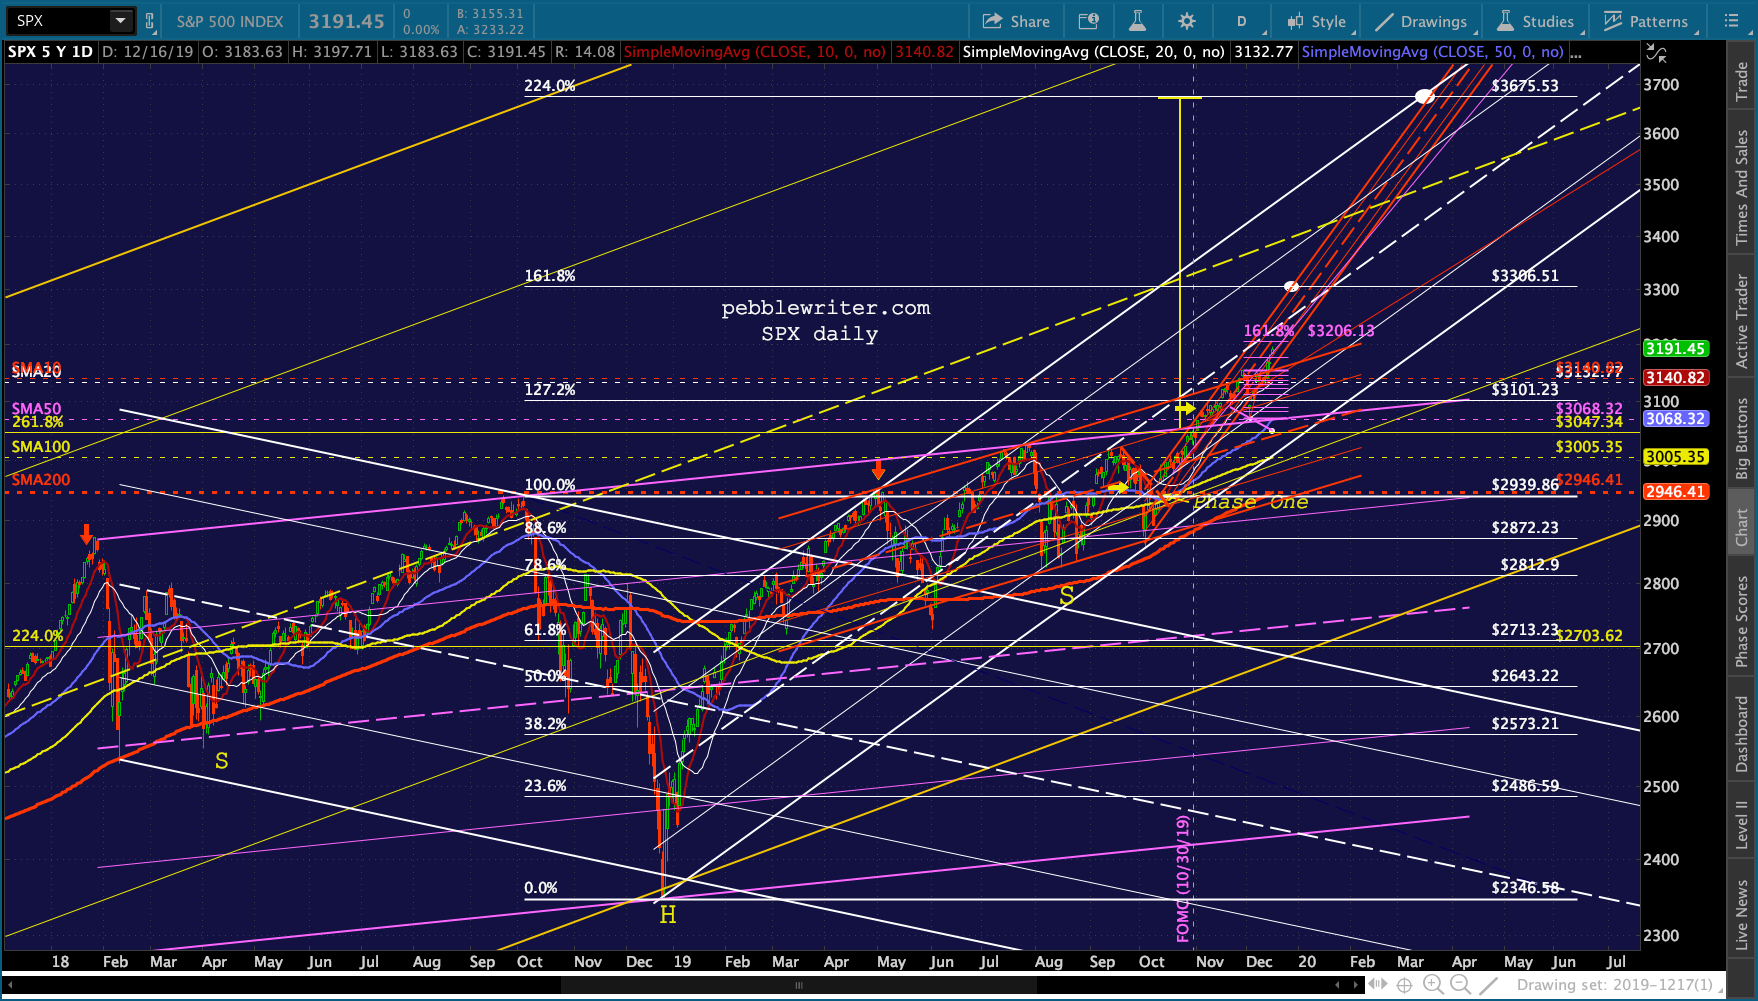 Having rejoined the rising red channel after the Dec 2-3 hiccup, SPX first must contend with the purple 1.618 at 3206.13. After that, it’s just a matter of timing. The red channel top reaches 3306.51 on Dec 26 while the white midline reaches it on Jan 22. Should SPX lose momentum again, a backtest of the 2.618 at 3047.34 remains a possibility.
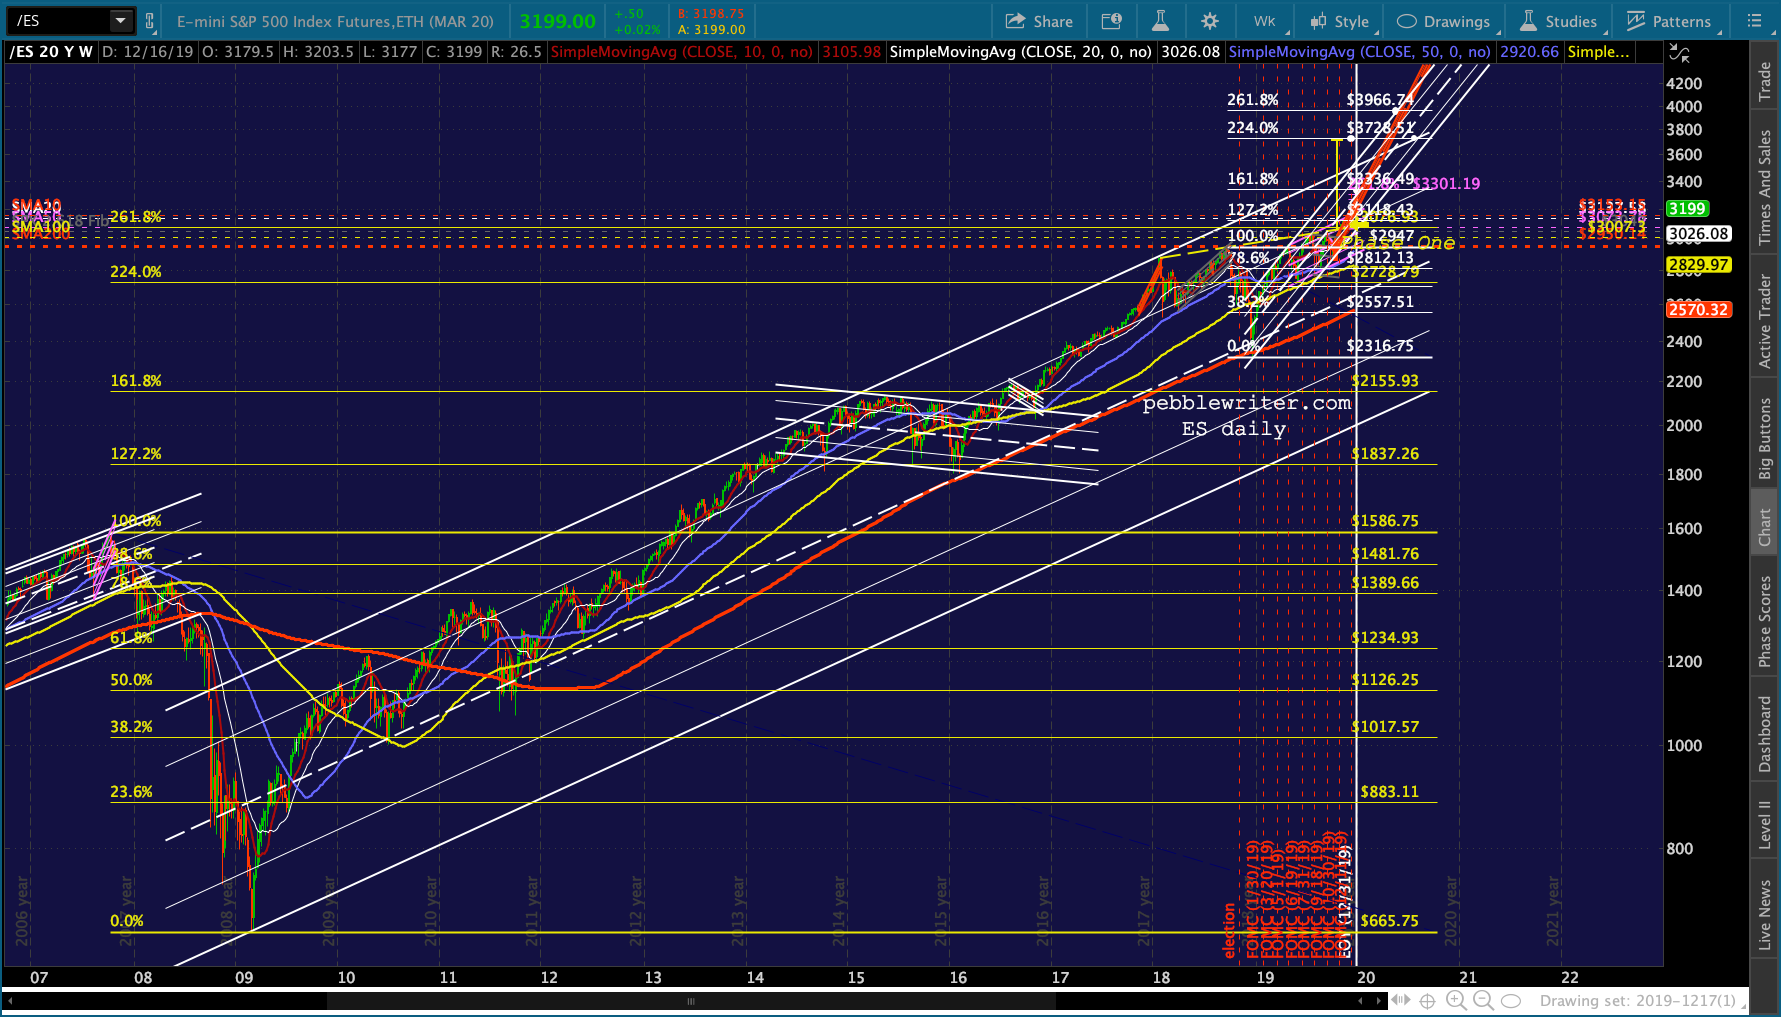
The white channel bottom reaches it on Jan 6, so we could conceivably see 3306 on Dec 26 and 3047 on Jan 6 — but a 7.8% decline in 5 sessions would be rather extreme and would defeat the implicit goal of “as high as possibly by 12/31.” The ES version argues for 3212.69 as early as today and 3301.19 by Dec 31 in a steady ascent of the rising white channel which intersects with the larger white channel midline and the yellow channel .786.


 Its IH&S target is 3716, which is fairly close to the white 2.24 Fib at 3728.
  The ES chart has always been a little confusing because we have three major channels competing for legitimacy. FWIW, the purple is my favorite. But, time will tell. Here’s a look at all three…
 The individual channels are shown below.


 How to get to 3300? The usual suspects. In addition to breaking below the red TL from 2017, VIX has pushed below its latest .886 and the bottom of the falling purple channel.


USDJPY is still inching higher… …and CL has yet to reverse.
 I need to run out for an appointment but will be back by 1pm to finish up this post.
UPDATE: 2:40 PM
Not much to report yet. Stocks are in a holding pattern and will likely remain so for the rest of the session. More after the close.


 UPDATE: 8:00 PM
RB reversed at a small grid .886 today after pushing up into the channel it’s been backtesting since 12/6. Its staying power has surprised me. Doing a lot of thinking about the dynamics of the inflation puzzle. Throughout 2019, CPI has relied on a YoY drop in gas prices to offset higher inflation from other categories. Unless gas tanks, it will be additional fuel for the fire (puns…simplest form of humor but I love ’em.)
Given the extraordinary sums of liquidity being thrown into the financial system, is it any wonder that we’re starting to see real inflation? A few of the charts that tell the story… 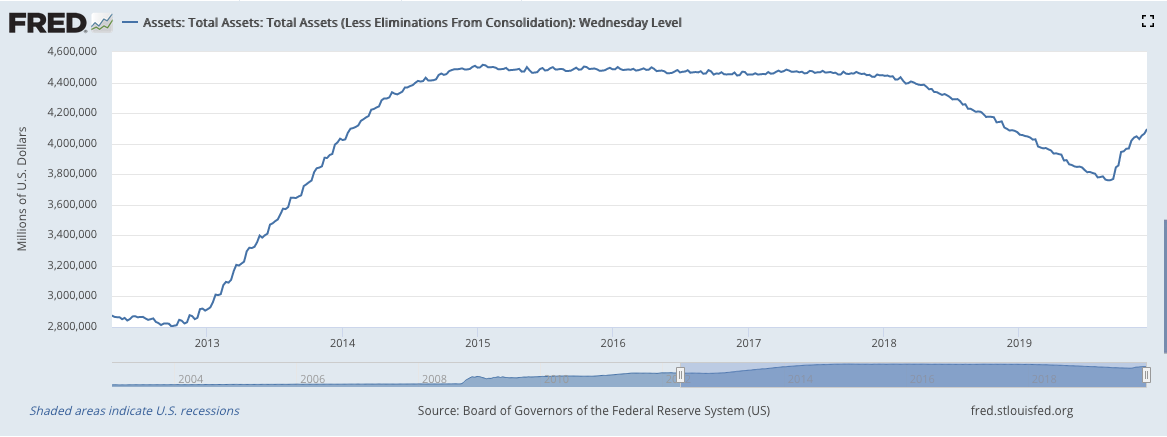

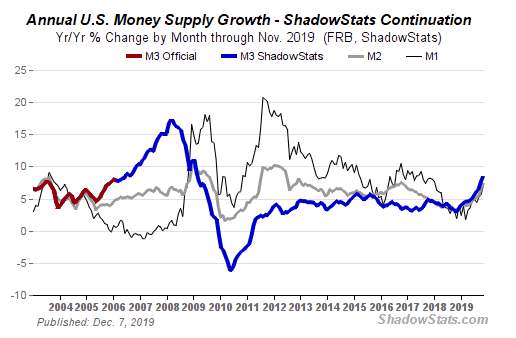 Based on the past 10 years, I’ve always assumed that central banks would stop short of reigniting inflation when trying to stimulate markets. What if they’re not allowing core and headline CPI to top 2%, but are stuck in a position where they have no choice? What if, for instance, they’re giving up on trying to keep the economy humming and inflation low at the same time? Which would they choose? Will they even have a choice?
On CNBC this morning, Alan Greenspan threw his hat into the stagnation/stagflation ring – a scenario I’ve felt is a real risk for many years given the debt/deficit threat. In fact, I have a hard time seeing how it can be avoided unless major declines occur in oil and gas prices. Food for thought…