

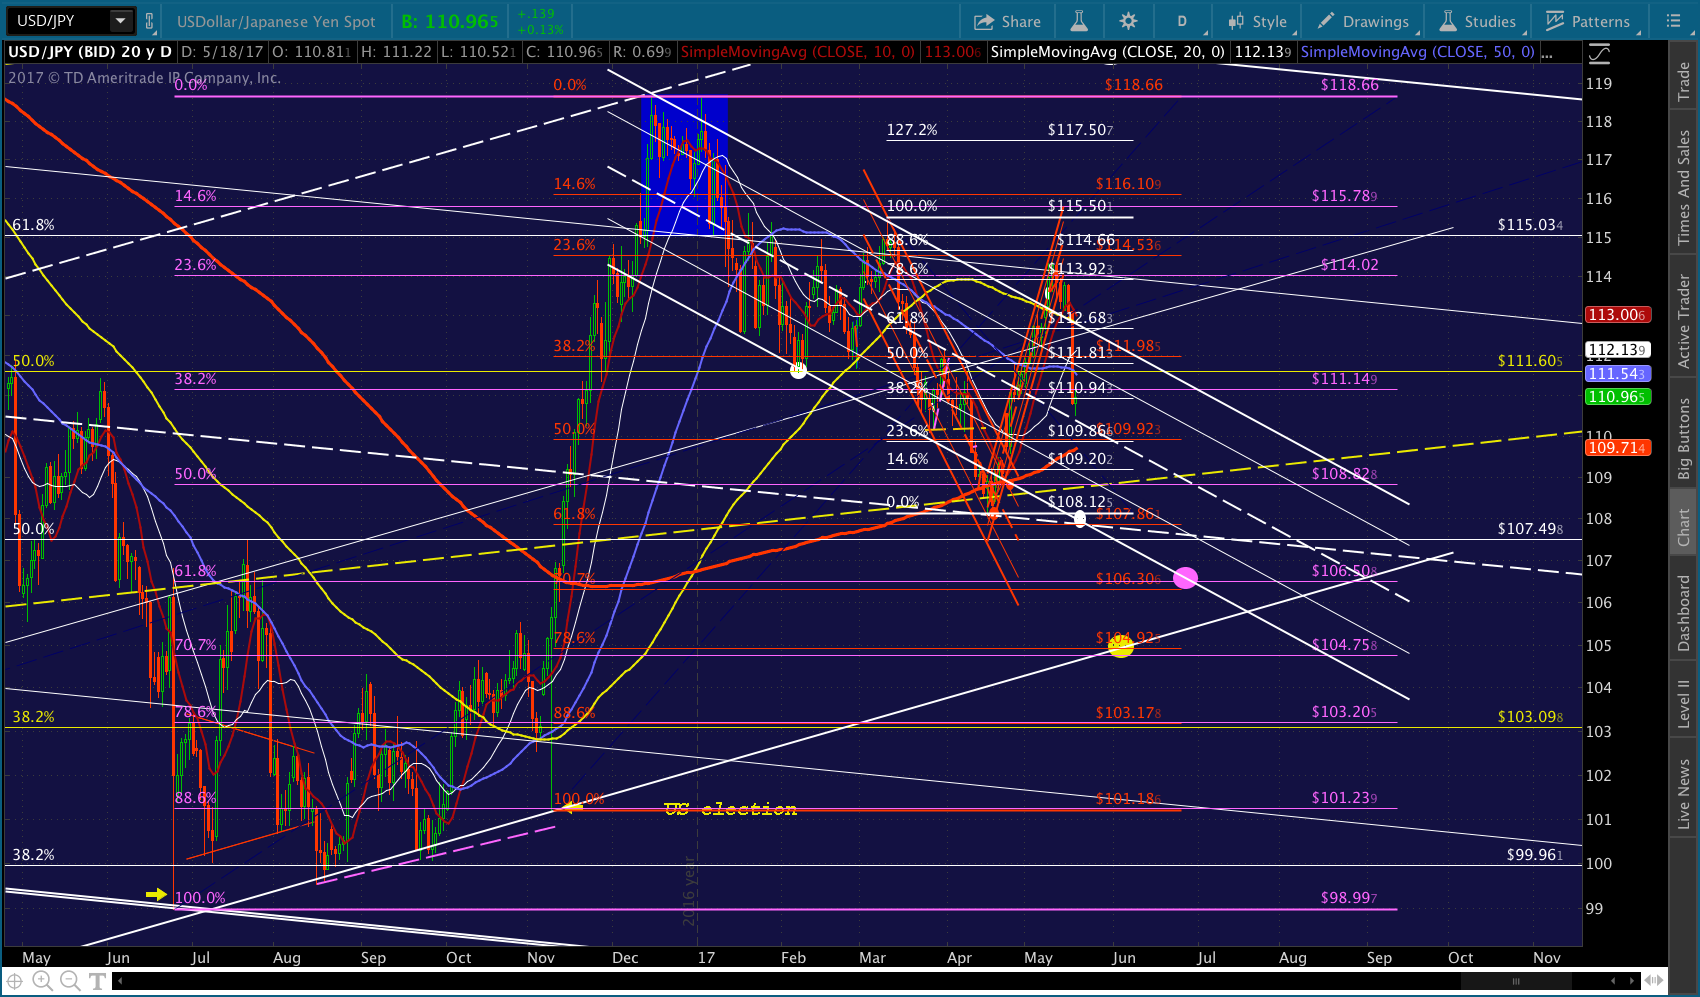
As DXY closes in on our next downside target, it seems like a good time to check in on USDJPY. In our last major update [see: April 3 Update on USDJPY] I tried to reconcile two slightly incompatible targets: the .618 Fib at 107.86 and the SMA200 (then) at 108.41.
There was a third potential attraction: a channel midline about halfway between them at 108.08. And, there was another complicating factor: the falling channel USDJPY had been in since December didn’t reach any of those targets until later in the month, when their divergence would be even greater.
Sometimes, in charting, you have to squint your eyes and plop a target down where it comes closest to satisfying multiple, divergent objectives. That’s what I did.
Either way, I expect it continue selling off to at least 108-109 with an eventual goal of the channel bottom around 105.33 – 105.60.
It turned out to be a nice call. USDJPY reached 108.11 on Apr 17, meaning it tagged both the SMA200 and the white channel midline before reversing. It spent two more sessions trying to regain the SMA200, finally doing so on Apr 20 and, then, breaking out on Apr 24. I put an upside target of 113.50 on it, which it reached on May 9.
But, a funny thing happened at 113.50 — or, rather, didn’t happen. USDJPY kept going, breaking out of the falling white channel and reaching 114.36 before it finally ran out of steam.
That was interesting; but, what was even more interesting is that the break out didn’t hold. On May 11, with USDJPY at 113.808, we noted that it had started to break down. It bounced sideways for a few days, then plunged over 2% today. With DXY having reached our next downside target, is USDJPY done? Or, does it have further to drop?
continued for members…I must confess I thought the breakout on May 9 would keep going. With SPX back above the yellow channel top and all the algos working in conjunction, it seemed as though equities were in the clear.
But, DX had broken down in late April. Momentum was lost, and turned negative when a string of economic data point fails suggested (to me, at least) that additional rate hikes were unlikely. It tagged our 97.583 target today, and is still easing lower — suggesting that our 96.789 target won’t be far behind. It could bounce there, or continue down to the purple midline and horizontal support at 95.885.
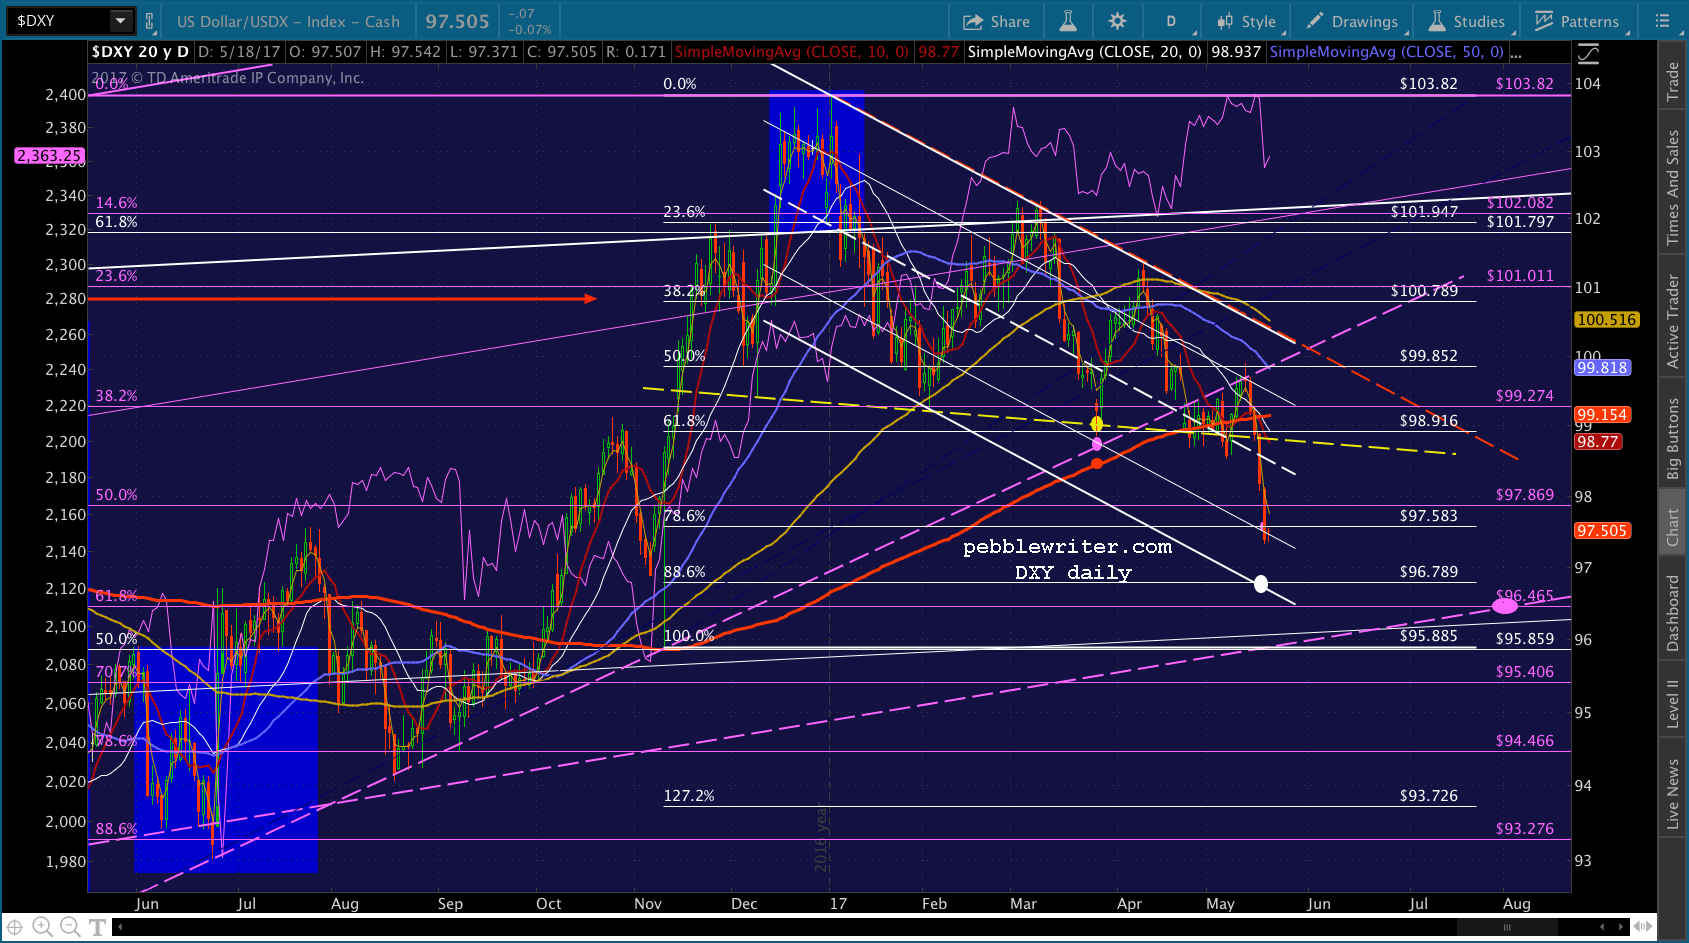 Regardless, additional DXY weakness means additional USDJPY weakness. If the SMA200 holds at the red .500 and/or falling white channel midline, then we could get another leg up to 120.11. Otherwise, the downside targets originally contemplated are all in play: the red .618 at 107.86, the purple .618 at 106.50 and the red .786 at 104.92.
 My best guess is that the SMA200 will hold for now, and will coincide with EURUSD reaching our 1.1210 target. But, that will depend on how SPX, which nearly reached TL support earlier today, behaves over the next day or two.
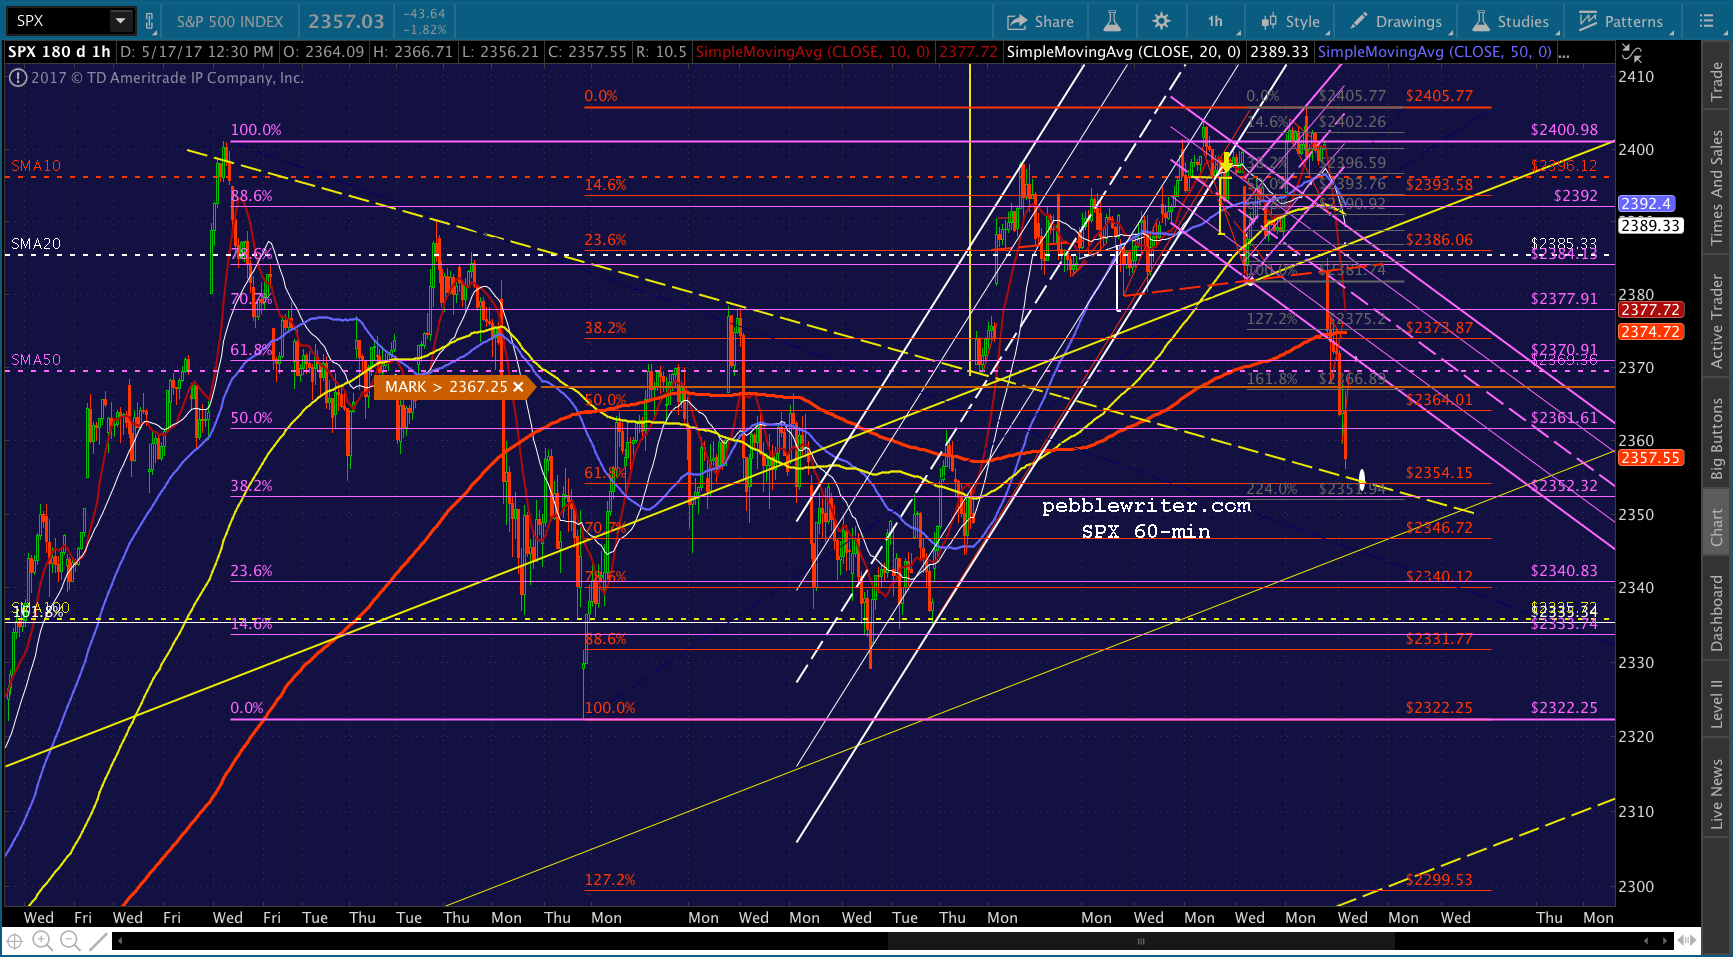
Stay tuned.