

The past two days of inflation data make it abundantly clear that inflation’s slump is slumping. But, don’t take our word for it. Just ask the bond market, where the 10Y has soared from 3.6% to 4.5% in less than two months.
 Headline CPI, which had dipped as low as 2.44% in September, jumped to 2.60% in October. And, the components of the print were problematic. Energy is in the final stages of its YoY decline and, in the absence of peace breaking out in the Middle East, will soon show YoY gains. Shelter, at nearly 5% YoY, remains quite sticky and unlikely to trend lower unless we enter a full blown recession.
 And, this morning’s PPI print reminds us that neither goods nor services are trending lower.
 With nearly every economist on the planet agreeing that Trump’s tariffs will stoke further inflation, what does this mean for the economy and the markets?
NOTE: Powell will speak on “Global Perspectives” at 3pm ET. Catch it HERE.
continued for members…
We’ll start with the oil and gas aspect of inflation, as it’s the horse that got us here. CL’s big picture shows a well-formed channel dating back to 2001…
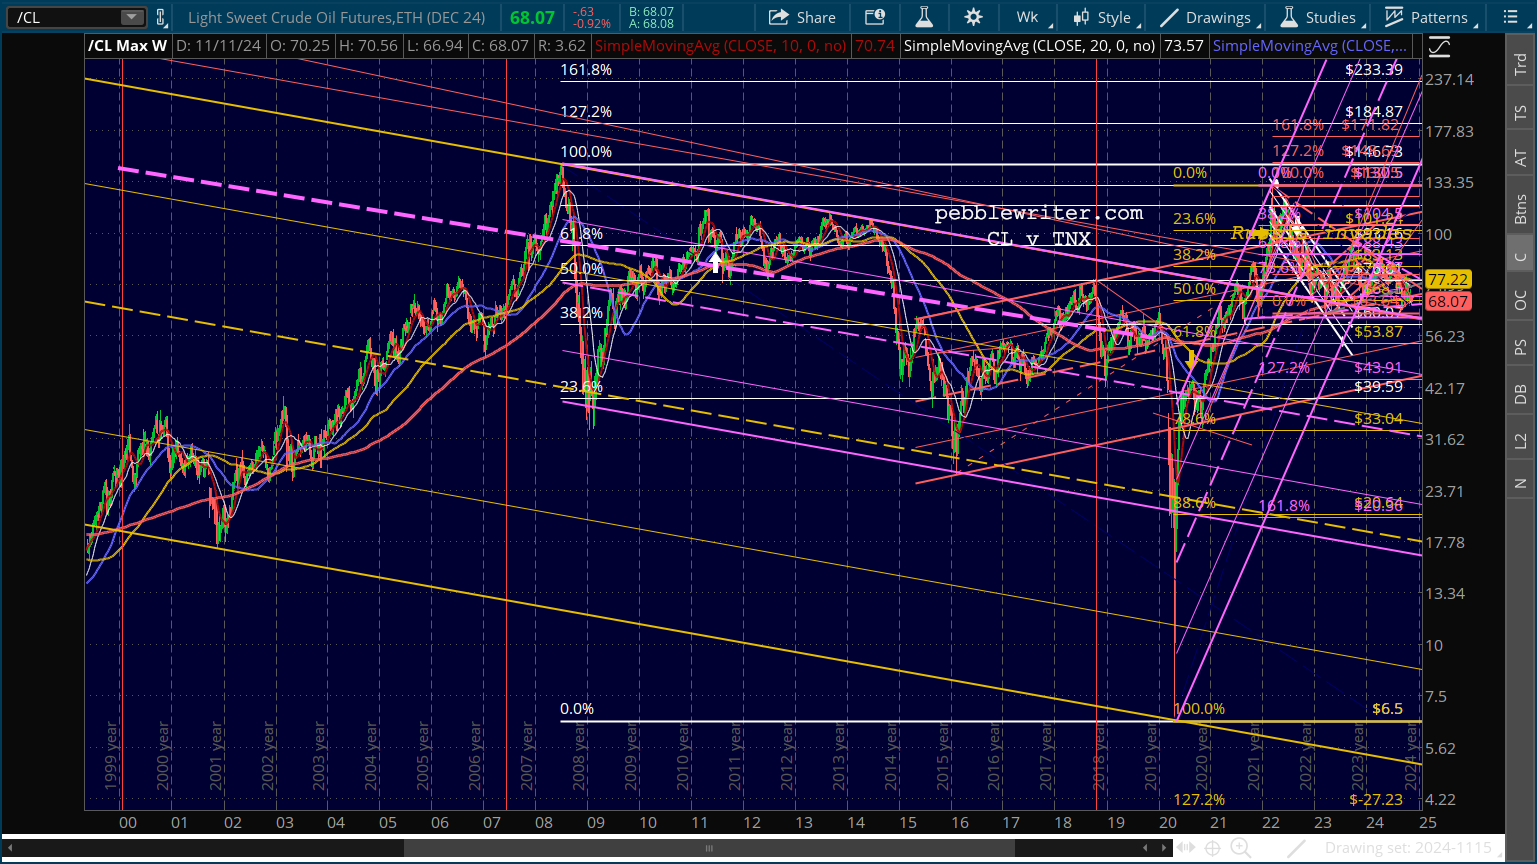 …which was broken out of in late 2021 with help from Russia’s invasion of Ukraine (some coincidence, huh?) Since then, it has returned to backtest the yellow channel top several times, forming a huge triangle which will of necessity either break out or break down by May 2025.
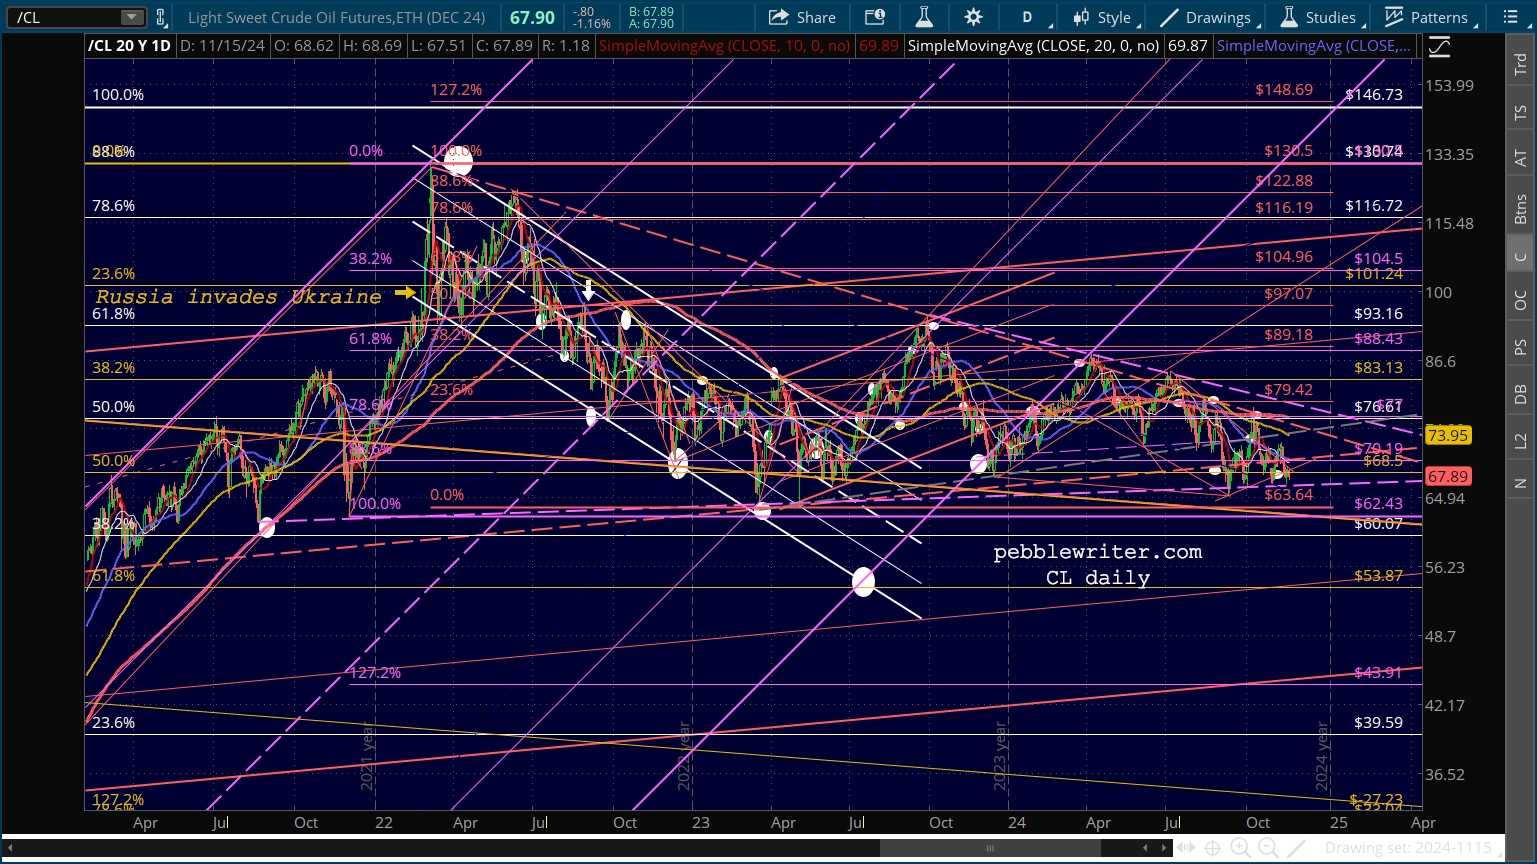 Oil prices are set by quite a few factors: OPEC’s control of output and pricing, US production, the value of the US dollar, global demand, etc. But, it seems pretty clear that TPTB are making quite the effort to prevent a breakdown below the yellow channel top, currently around 62.45.
If so, the periodic breakdowns of these little, red TLs will become less and less important. And, all that will matter is the MoM and YoY changes in prices and how they impact inflation.
Gas prices, likewise, pushed above long term resistance (in early 2022) but, unlike CL, have repeatedly broken back down below that red TL of resistance.
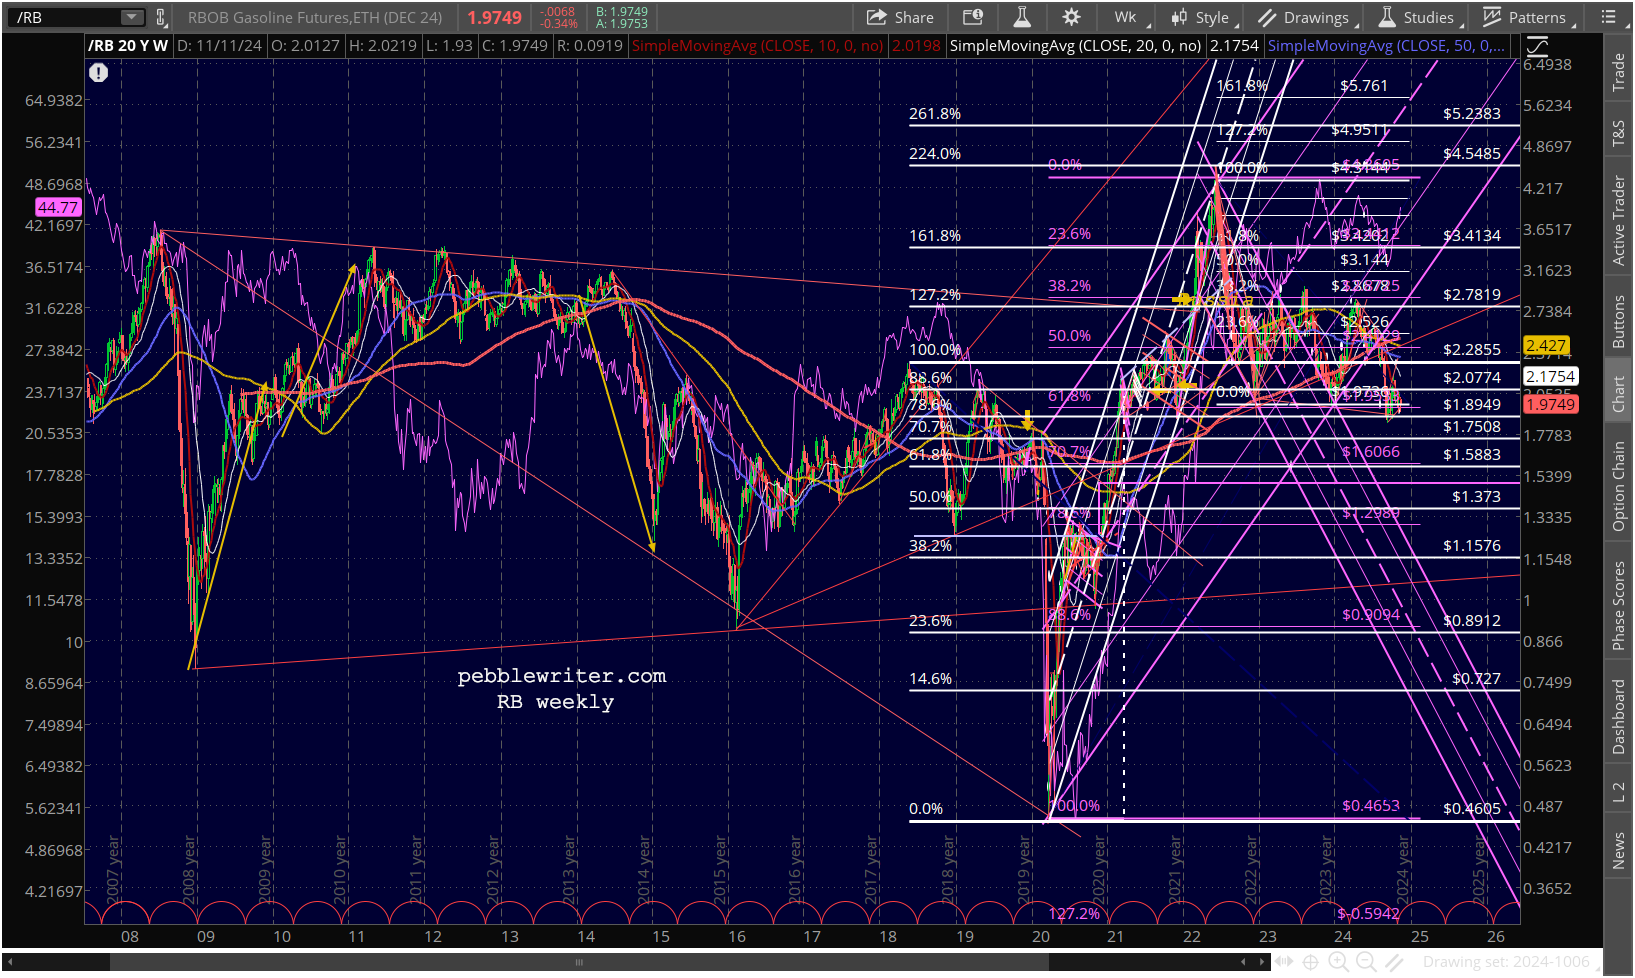 A closeup of the past few years shows a breakdown of both the initial rebound (from 2020) channels…
 …and evolution into a very sloppy triangle pattern which recently made new 4-year lows before rebounding again.
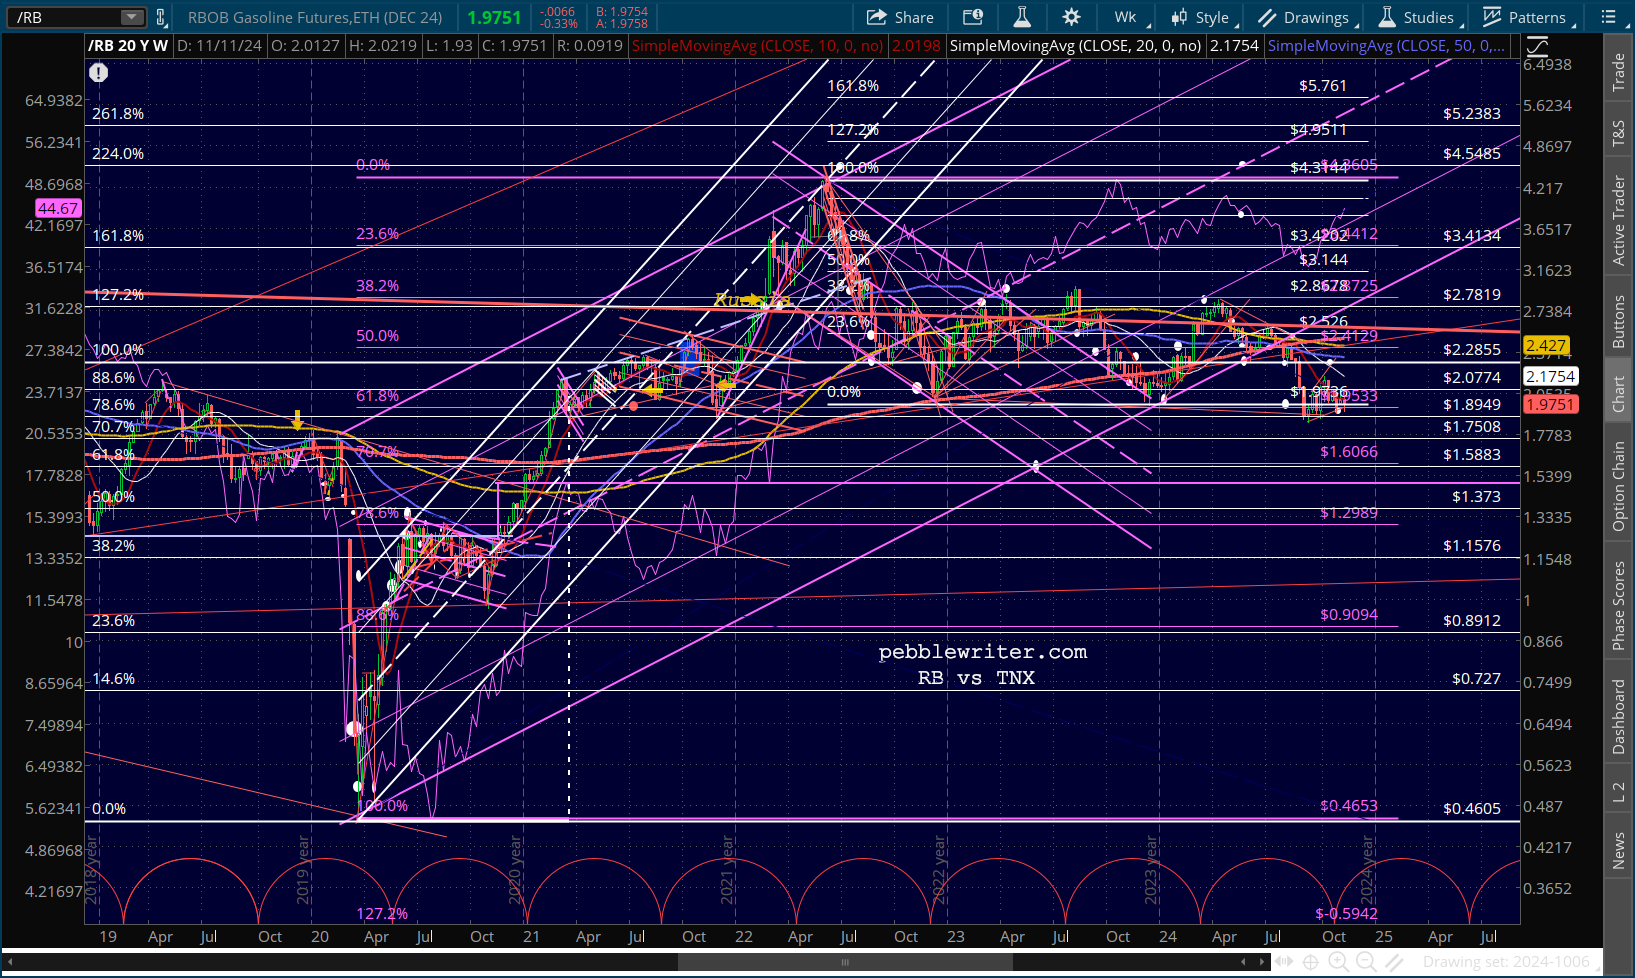
 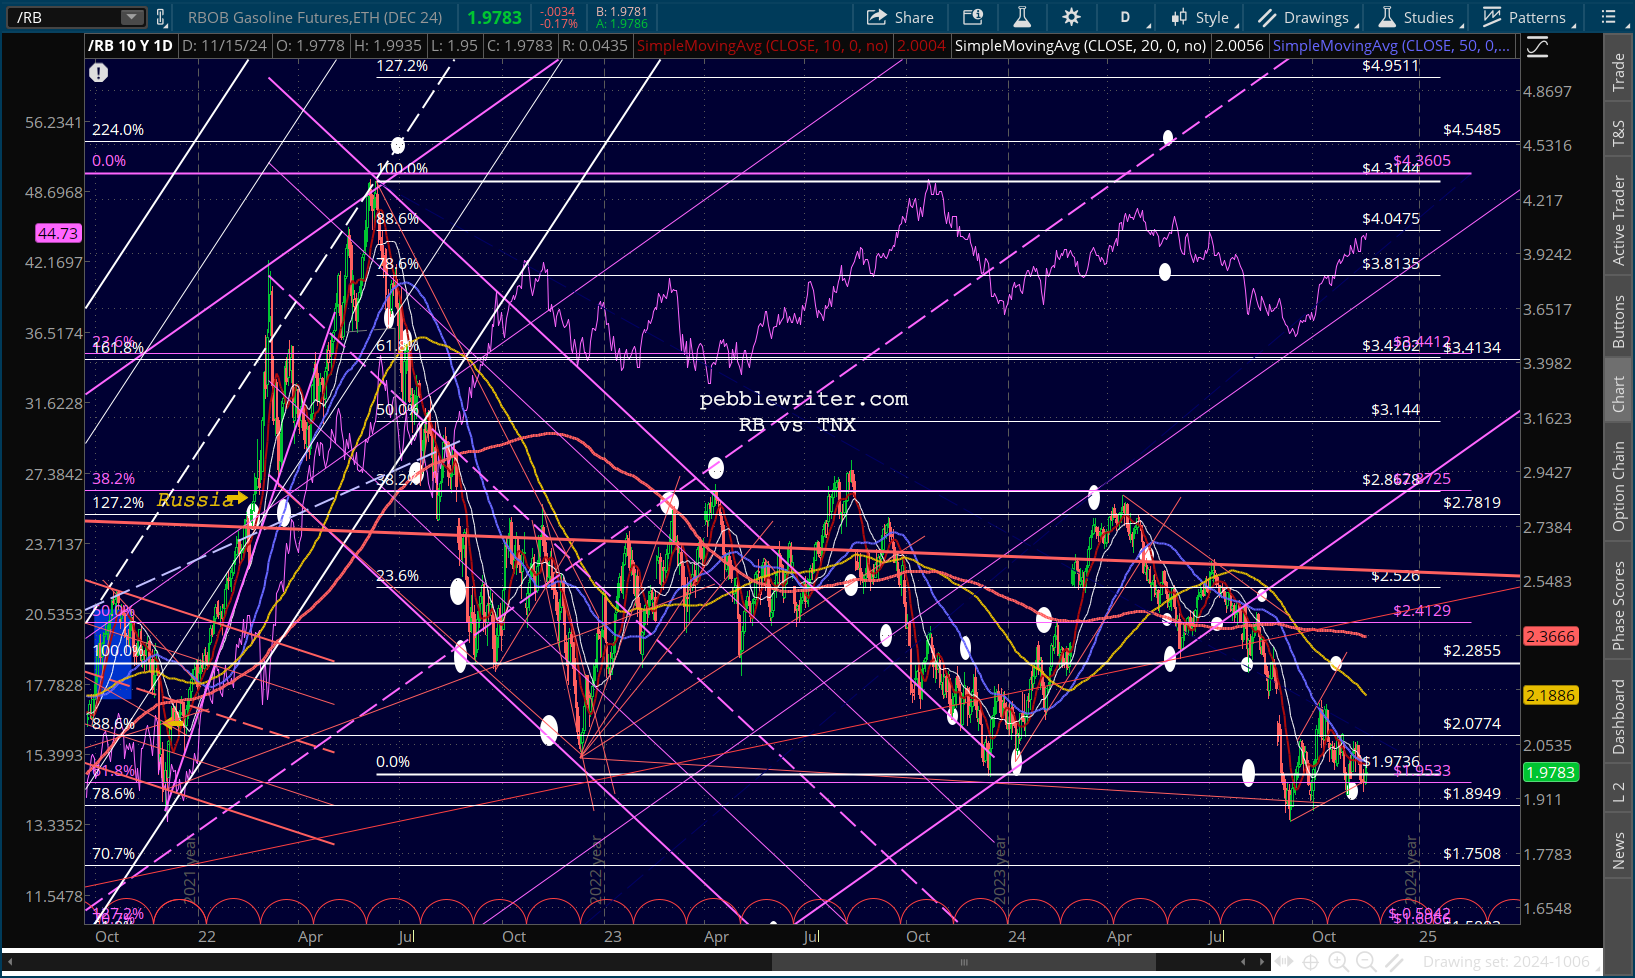 It’s the gas prices that we’ll zoom in on, as the correlation to inflation has been so reliable over the years.
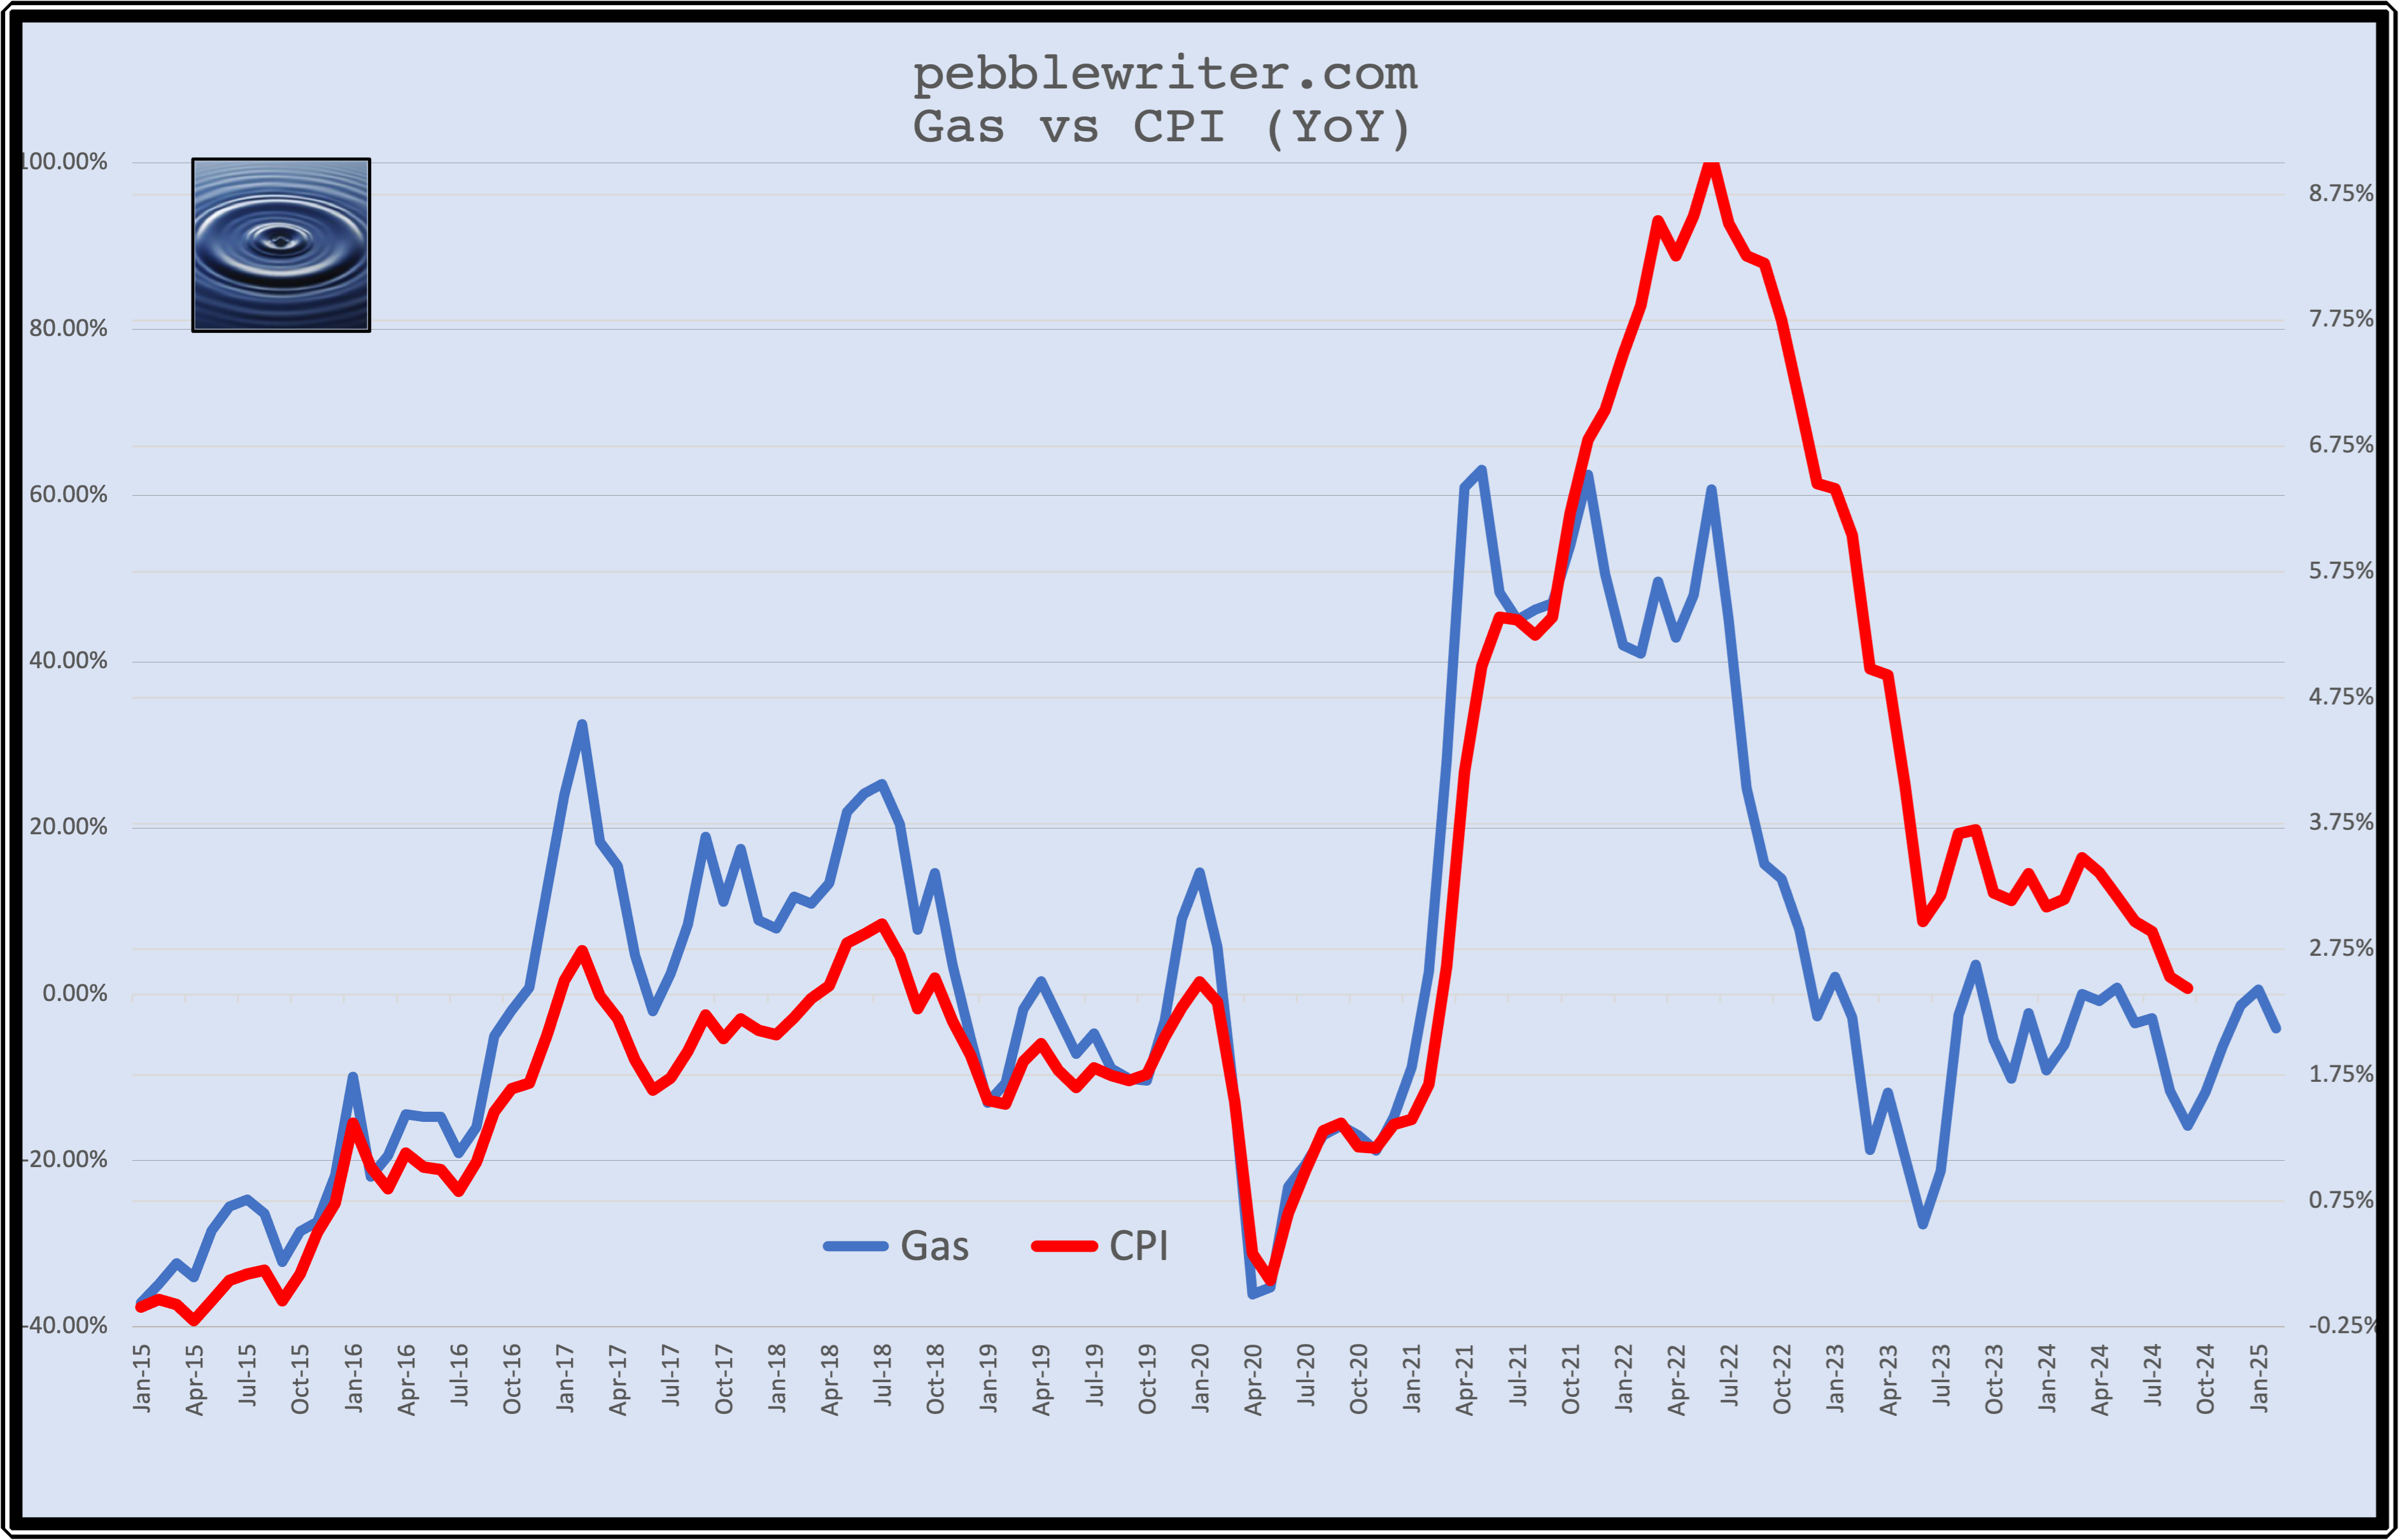 We saw the runup to 5% CPI almost entirely correlated with the increase in the YoY change in gas prices from -36% in Apr 2020 to +63% in May 2021.
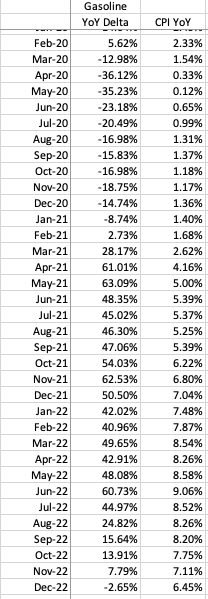 Instead of backing off as gas prices did (mostly leveling off) other CPI price categories jumped into the fray, driving CPI up to 9.1% by Jun 2022 – the last peak of YoY gas price changes.
As gas prices tumbled from that peak, so did inflation. Gas prices hit a low in Jun 2023 and came back for a second plunge in Sep 2024. The impact is still very clear, though the correlation has been strained a bit as other price categories have not declined to the same extent.
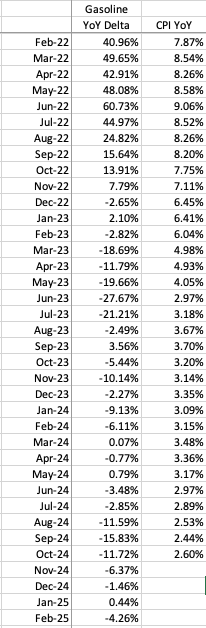 If gas prices remain at current levels, the YoY change will rise from the -11.72% in October to -6.37% in November and -1.46% in December. By January, we’d see a positive number at about the same level as May 24 when CPI was 3.17%. Needless to say, going from the current 2.60% to 3.17% would not bode well for stocks.
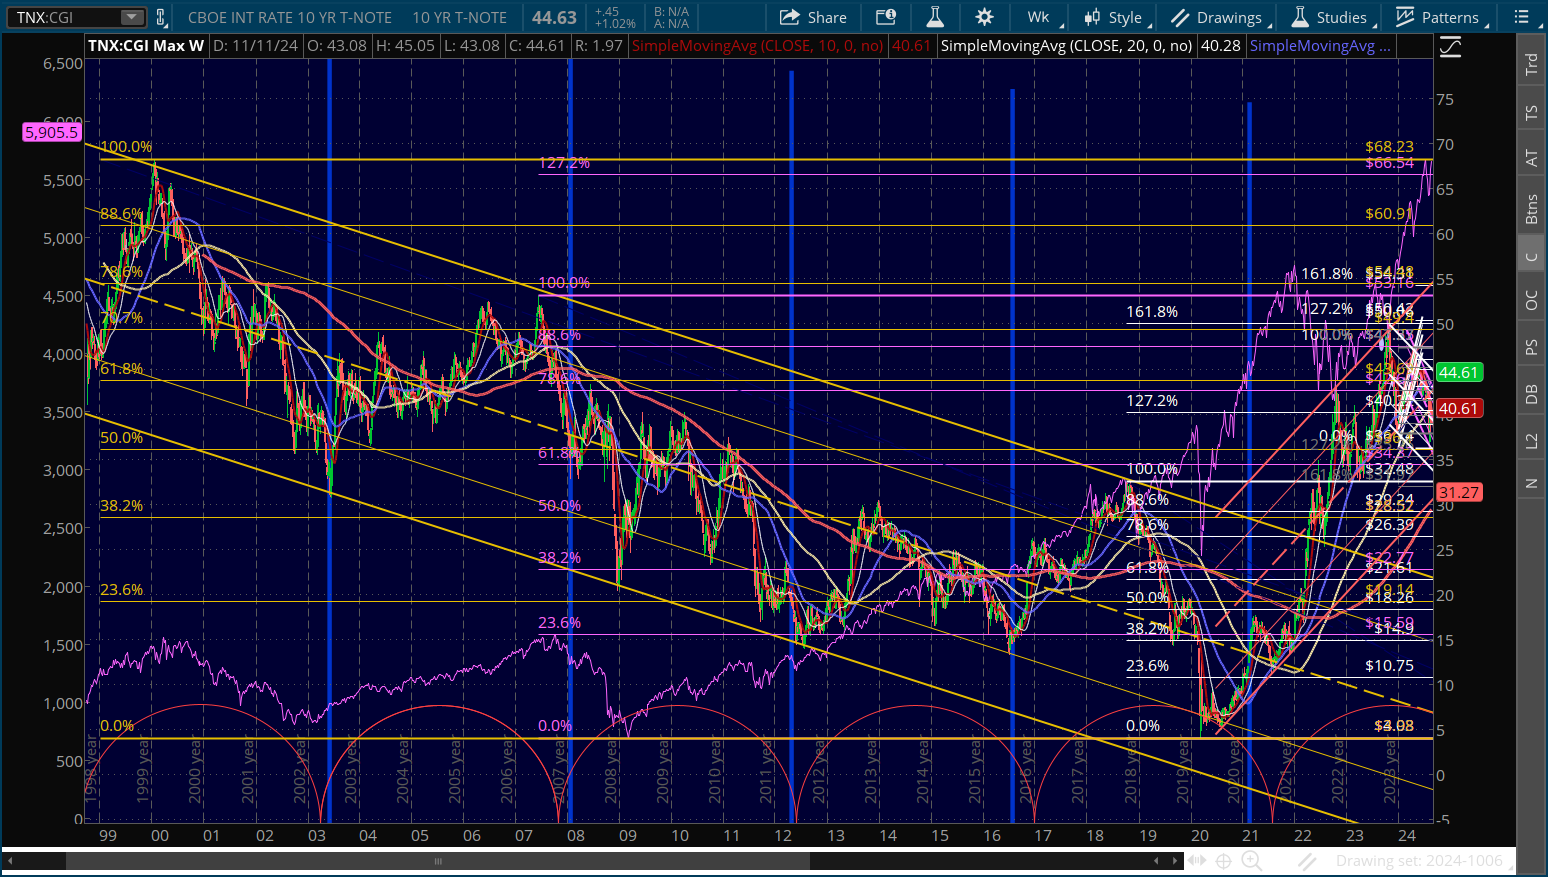
It’s not so much that rising interest rates will necessarily hurt valuations in and of themselves. It’s the breakout above the falling white channel which is likely to matter – just like it did when TNX broke above the falling purple channel, prompting a nearly 5% decline in SPX. This one would be more serious though, since the channel that TNX would break out of is much larger and has been going since Aug 2023.
It came after TNX reached the .886 Fib retracement of the 2007 highs and tagged the top of a channel from the 2020 lows. This, of course, followed the sharp breakout from the massive falling yellow channel from 1999 which caused a 27.5% decline in SPX.
 A close-up of the chart above shows the obvious target at 32.48 that would have been a great candidate if gas and other prices hadn’t put the brakes on further declines in September.
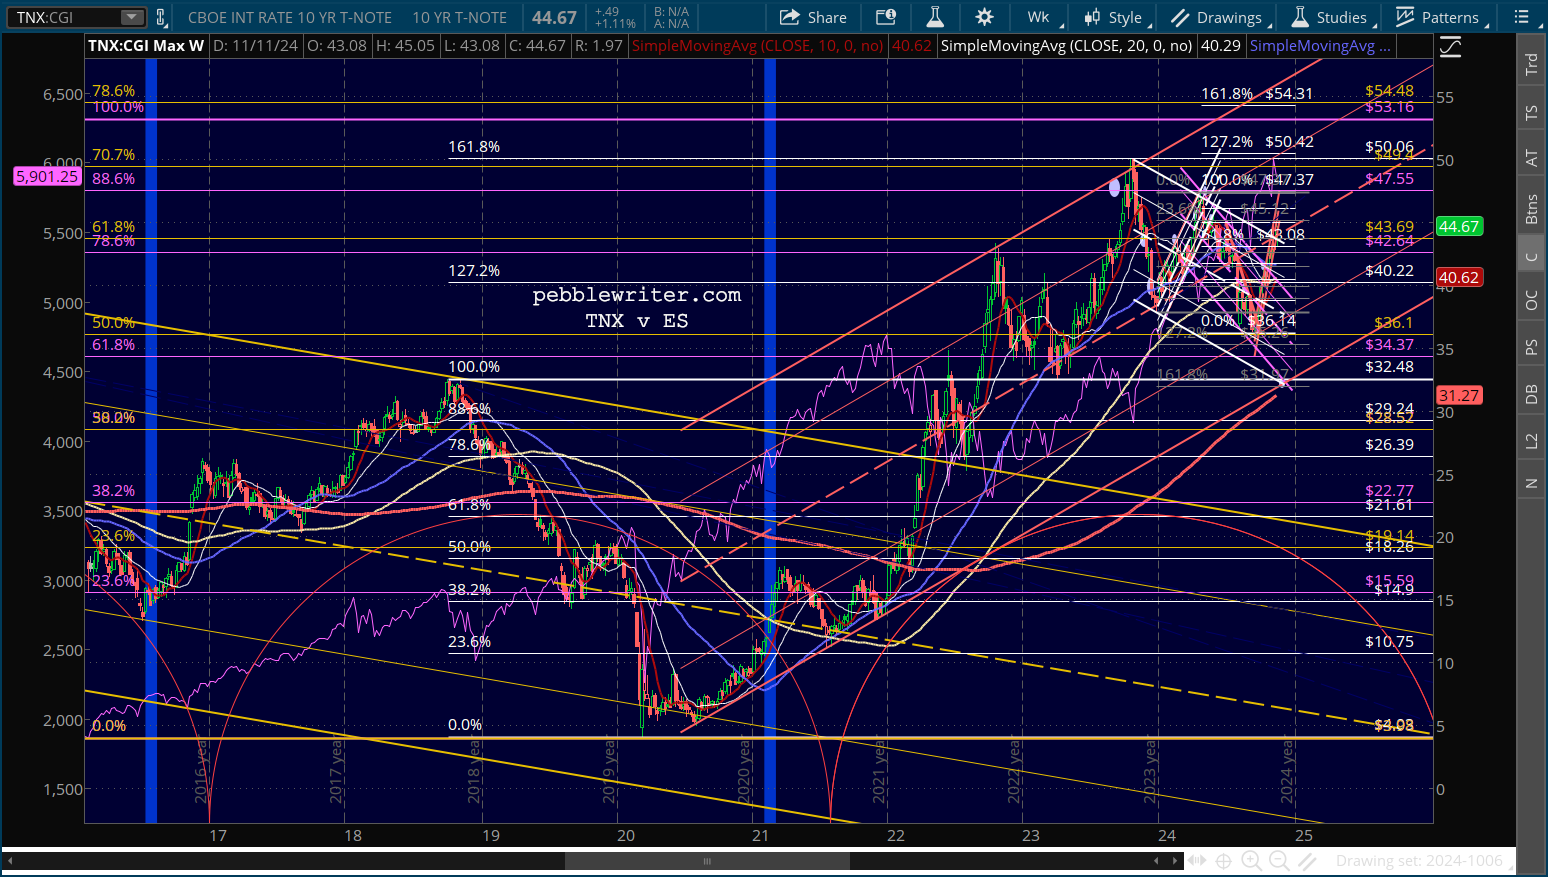 Our cycle study shows a good chance of a significant low around mid-2025 following the high which the model accurately predicted in 2023.
But, to get there without severe losses would mean an early tag at 3.25% – the intersection of the red channel bottom, the white channel bottom and the Oct 2018 highs – in the next 4-7 weeks.
This would mean a massive decline from the current 4.46% to 3.25%. It seems quite unlikely that signs of surging inflation would abate so dramatically. The other alternative would be a sharp equity downturn that resulted in a strong flow of funds into bonds.
In either case, as long as the 10Y remains above the white channel top at 4.37%, equities are quite vulnerable. The SMA20 at 5860, SMA50 at 5771 are easy pickings. The IH&S target at 5730 would then be all that stands in the way of the SMA200, currently at 5410 (and, 5500 by year end.)
Stay tuned…