

The flustercluck continues. As we discussed last week, silver is the new shiny object for the Reddit short-busters.
This morning SI decisively confirmed its channel breakout, topping the August 7 highs and forsaking the opportunity to backtest its 200-DMA. Unfortunately for gold bugs, GC has not tagged along.
 As SI closes in on our Nov 30 target, what lies ahead for the metals? Can GC keep up? And, how strong a backtest could we get today in equities?

continued for members…Silver has had some tasty upside targets for quite a while – but, the former attempt to break out of the falling white channel went nowhere.
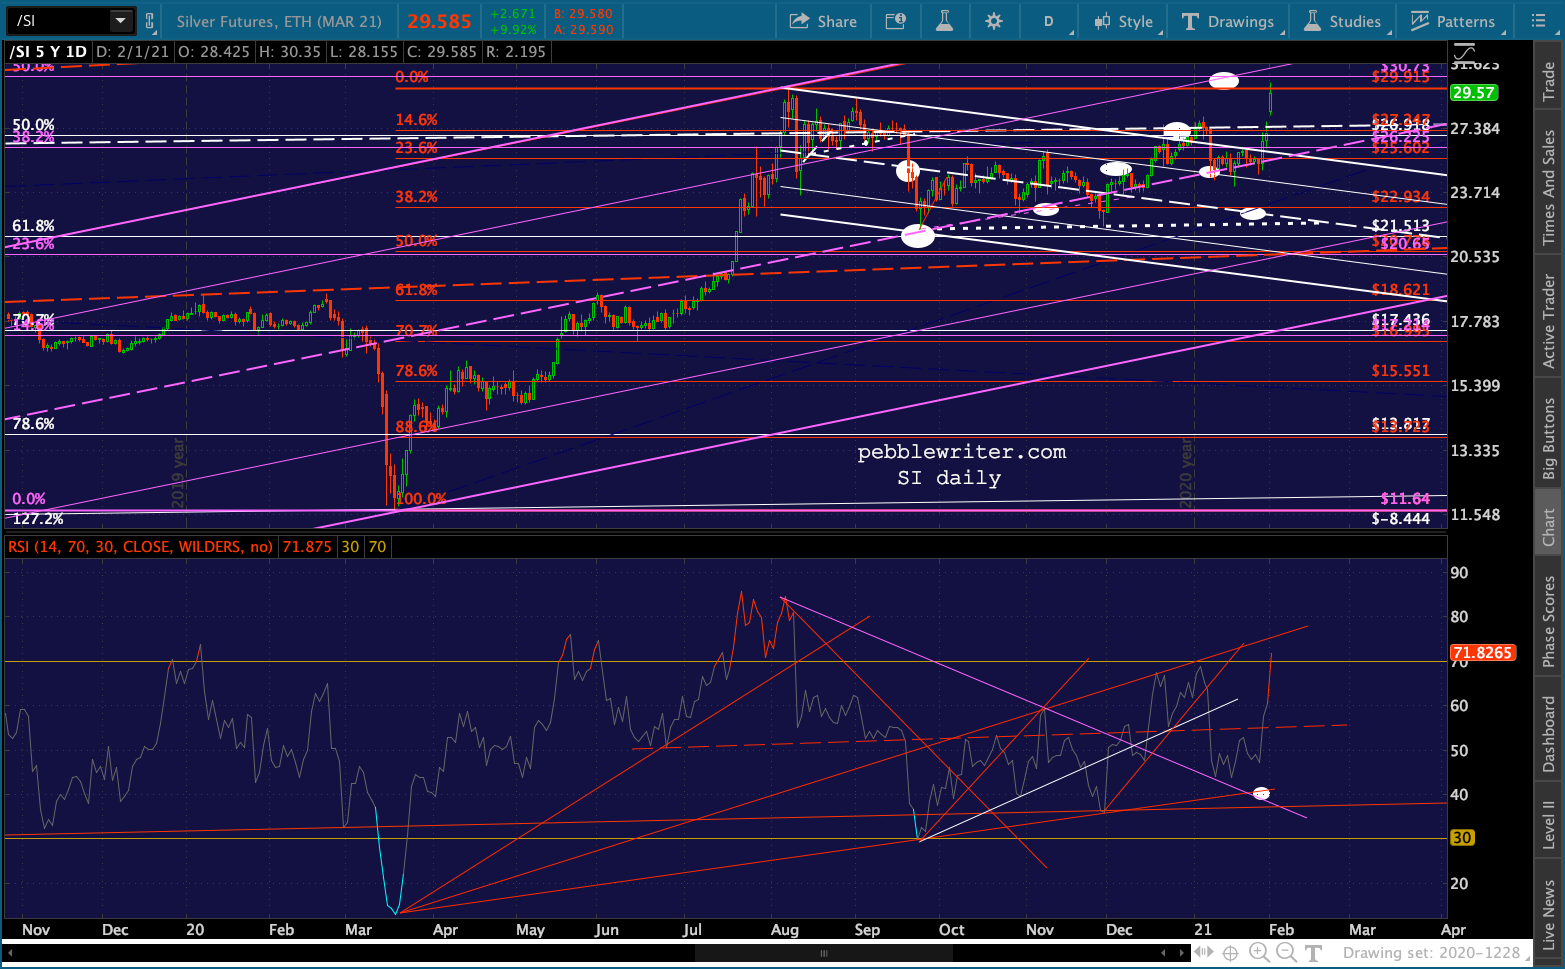
 Topping the white midline opens up the .382 backtest at 32.32 and, if that is broken, the purple .618 retracement where it intersects the red TL from 2003.
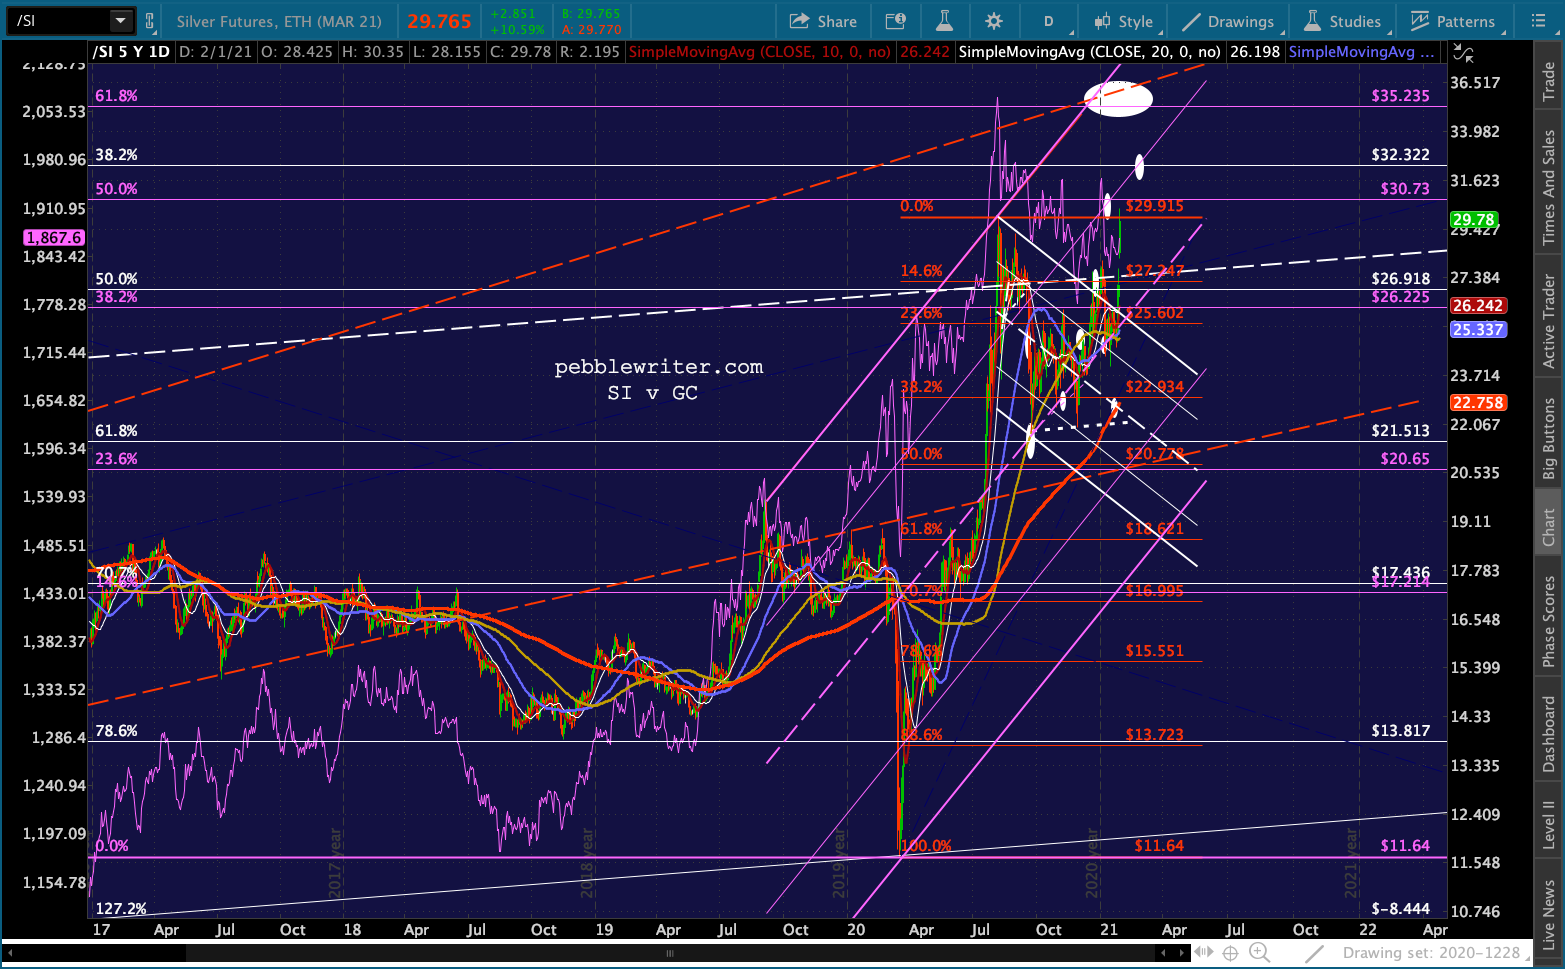 The RSI chart shows potential overhead TL resistance which presumably would align with the 32.32 Fib. A breakout above the RSI red TL would likely align with the 35.23 Fib. A failure to rise about this TL, on the other hand, would not bode well for SI’s breakout lasting.
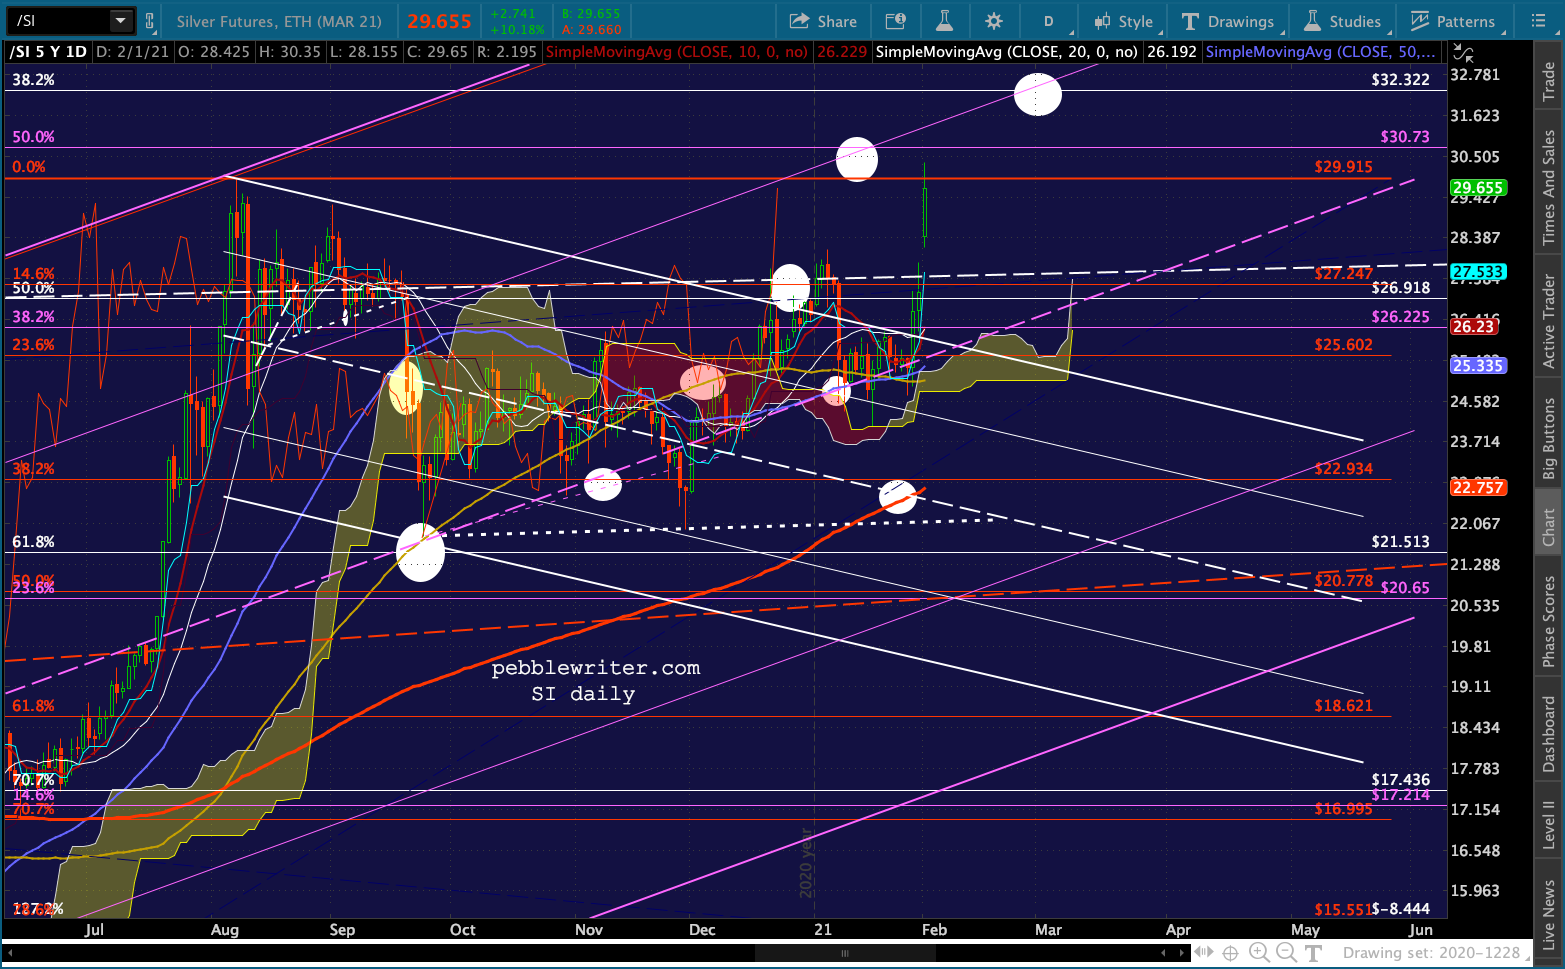
 As we’ve discussed recently, SI’s cloud chart was more bullish than GC’s, as the latest dip remained above the cloud following the December rally.
 Gold, on the other hand, has remained mired in its cloud ever since its Jan 4 breakout failed.
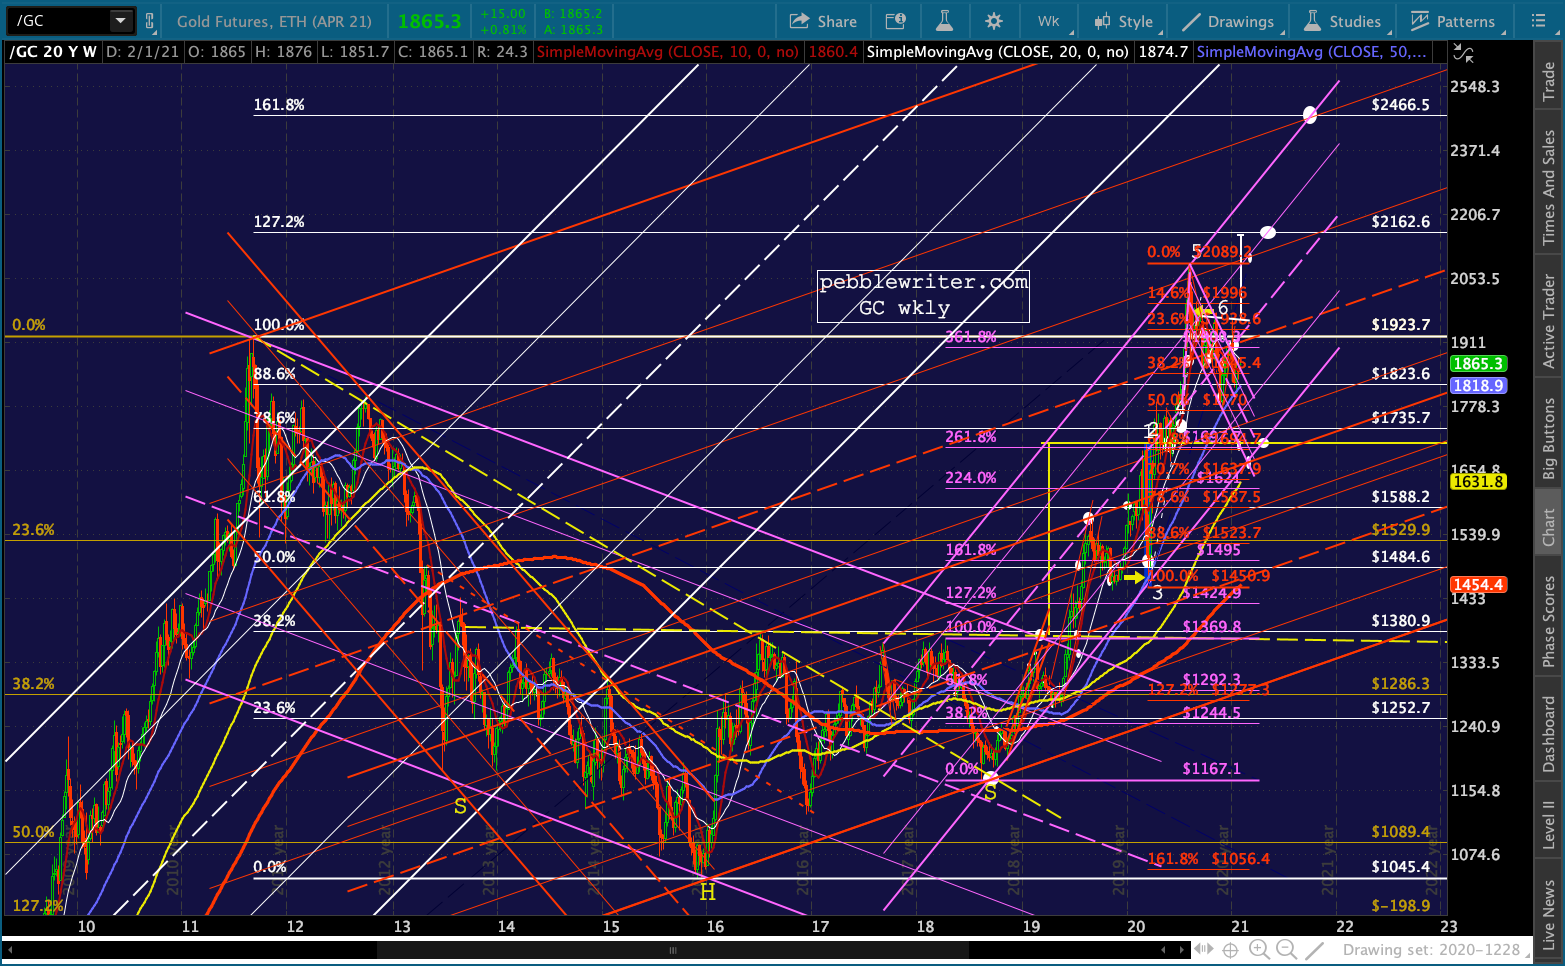
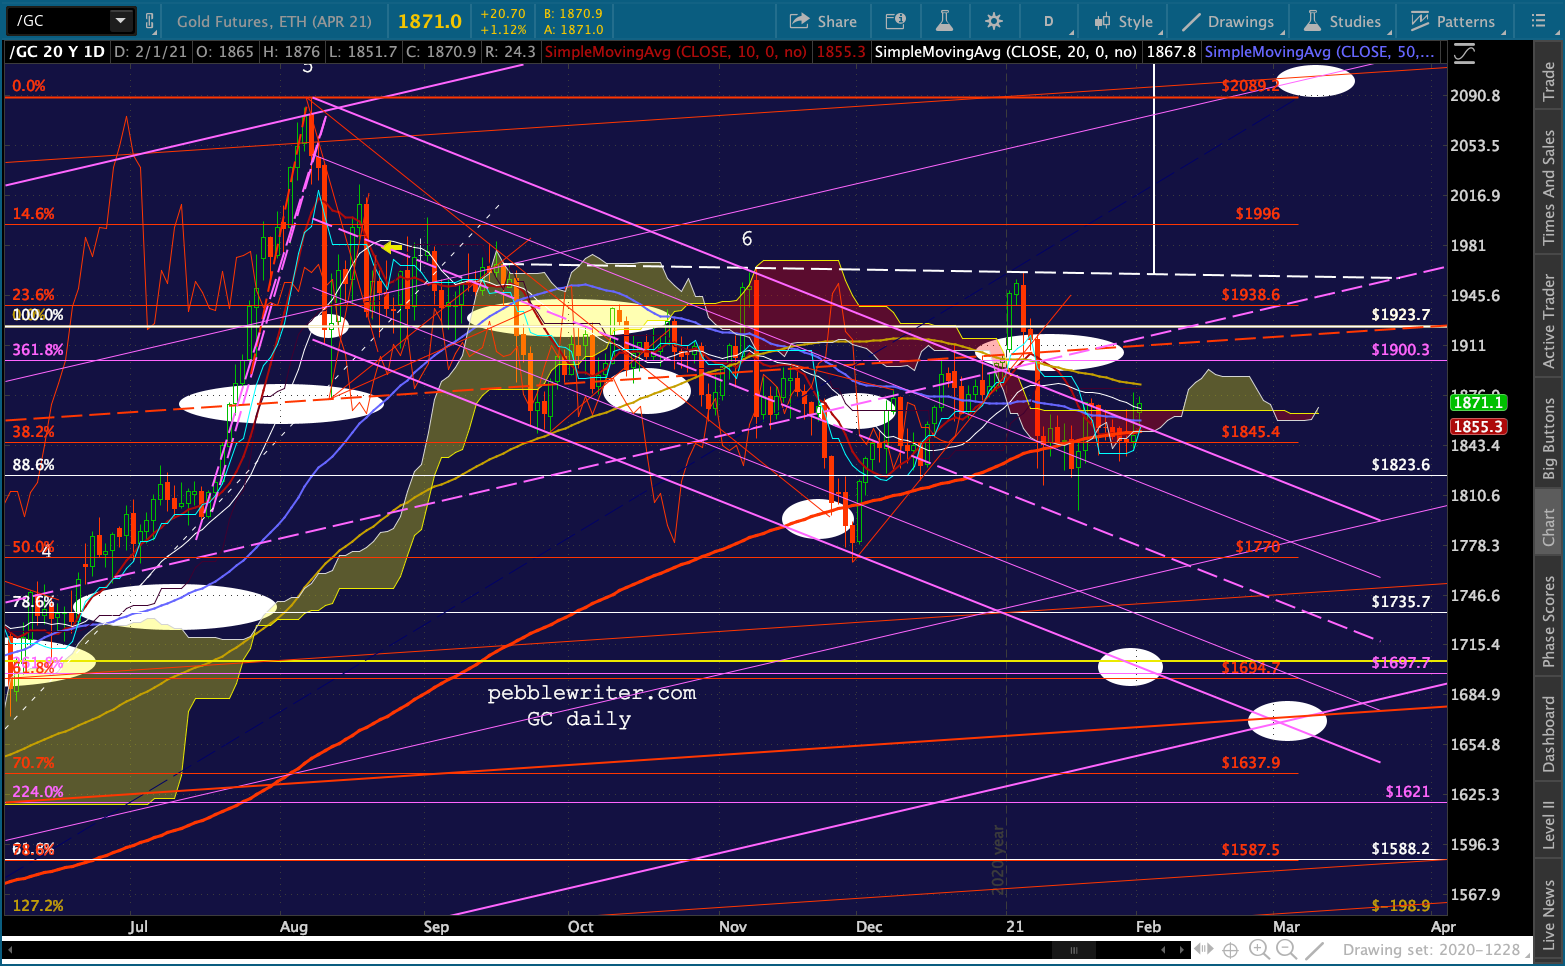 It’s trying again to break out, but the jury is still out. If it can hold today’s highs, it will have technically broken out after hugging its SMA100 for weeks. But, it still needs to push through the purple channel midline and the Aug 2011 highs at 1923 in order to even reach the white IH&S neckline which could propel it to its 1.272 Fib at 2162.60.
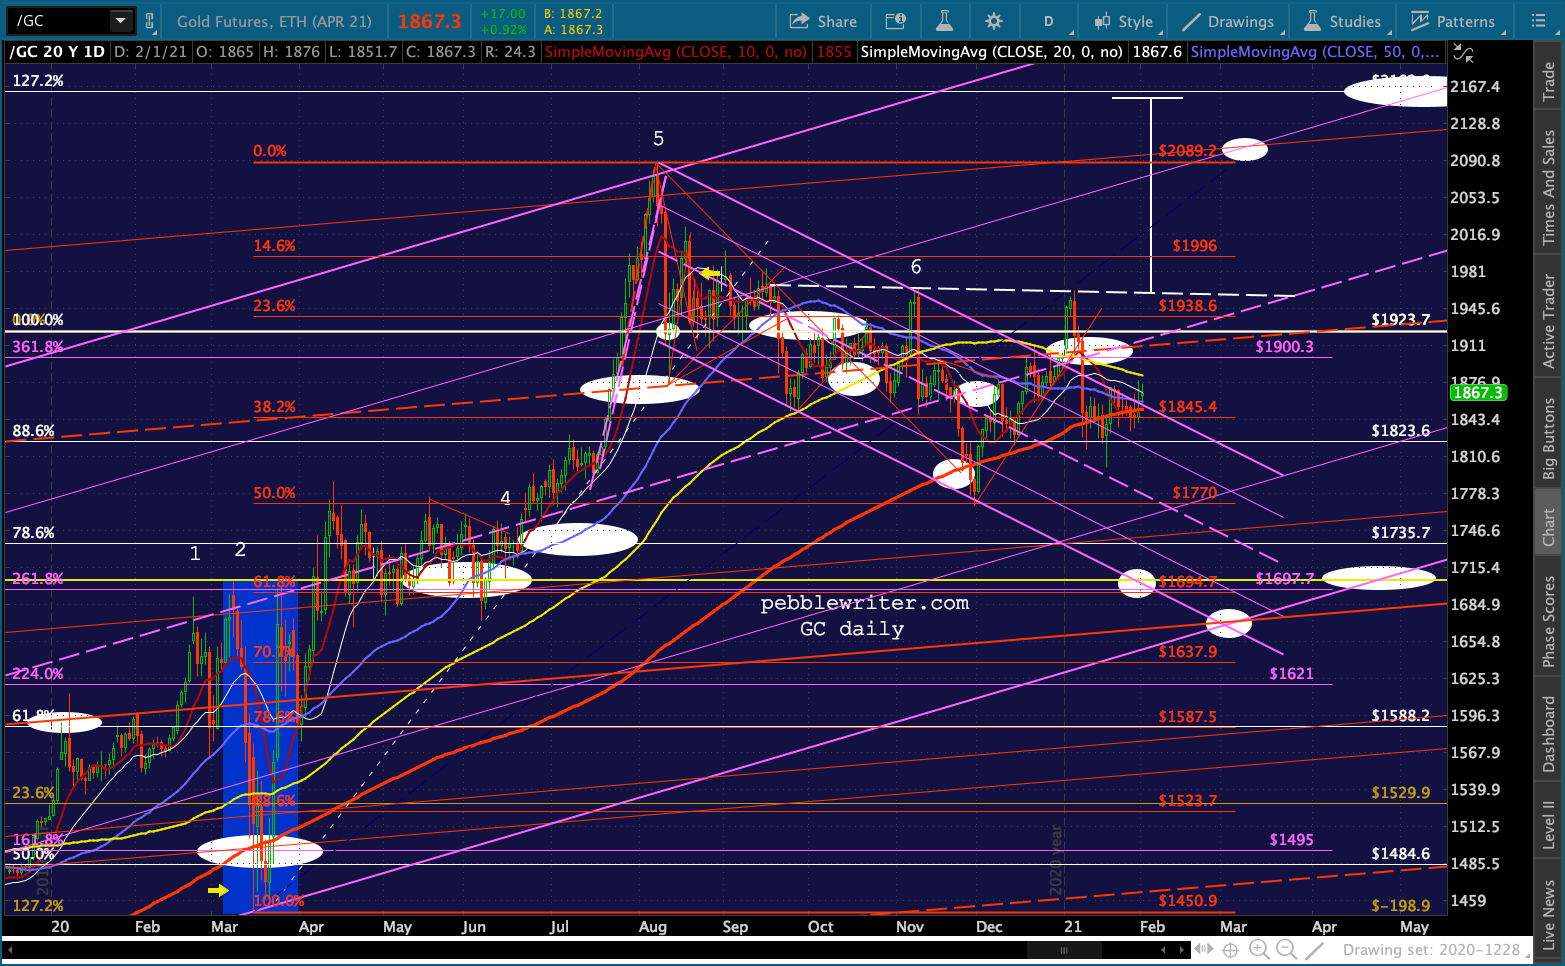 Its RSI has to break out past the rising white TL in order to make much headway. Then, it faces the falling purple TL.
  I probably don’t need to remind anyone that the previous IH&S Pattern took almost six years to finally crack its 1380 neckline.
Like SI, GC is heavily manipulated by both industry, financial service firms and central banks. The Fed is clearly not eager to see GC send up flares signalling massive inflation.
I advocate a “show me” approach. If it breaks out past a channel feature as it currently is doing, it’s cause to buy or hold long. If it drops back below it, one should sell.
Needless to say, this is true for SI as well. The Dec-Jan failed breakout is a reminder that there are numerous central banks which would object to an inflation-fear-stoking breakout at this point. With the SMA200 crawling along toward current prices, we can’t discount the potential for a long overdue backtest.
* * *
Elsewhere in the markets this morning, futures are riding the USDJPY ramp job back above the purple neckline.
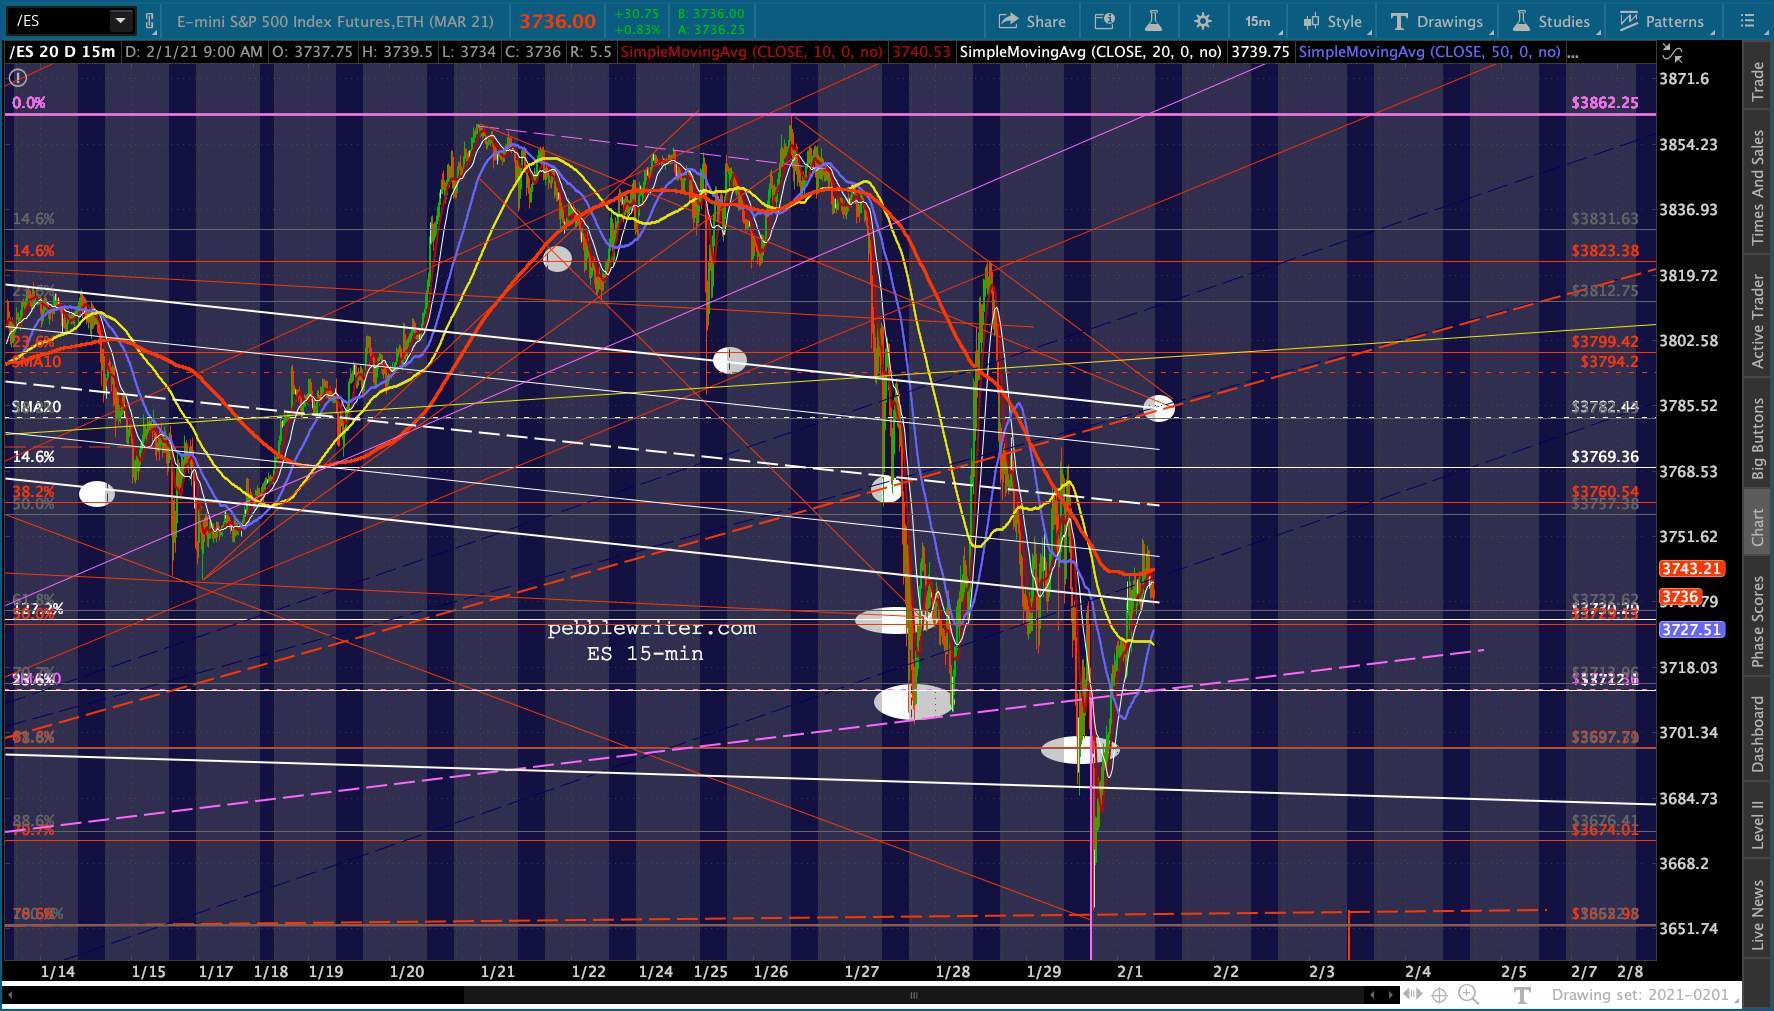 If the bounce doesn’t hold, however, it might have just put in a larger H&S Pattern show in red which targets 3449.
  Note that ES has yet to see a bearish 10/20 cross. This ramp job will put it off another day.
 This is a messy pattern for ES, but the key will be whether SPX is able to retake its purple TL from the Mar 2020 lows. It’s currently about 3761. Anything shy of that is merely a backtest.
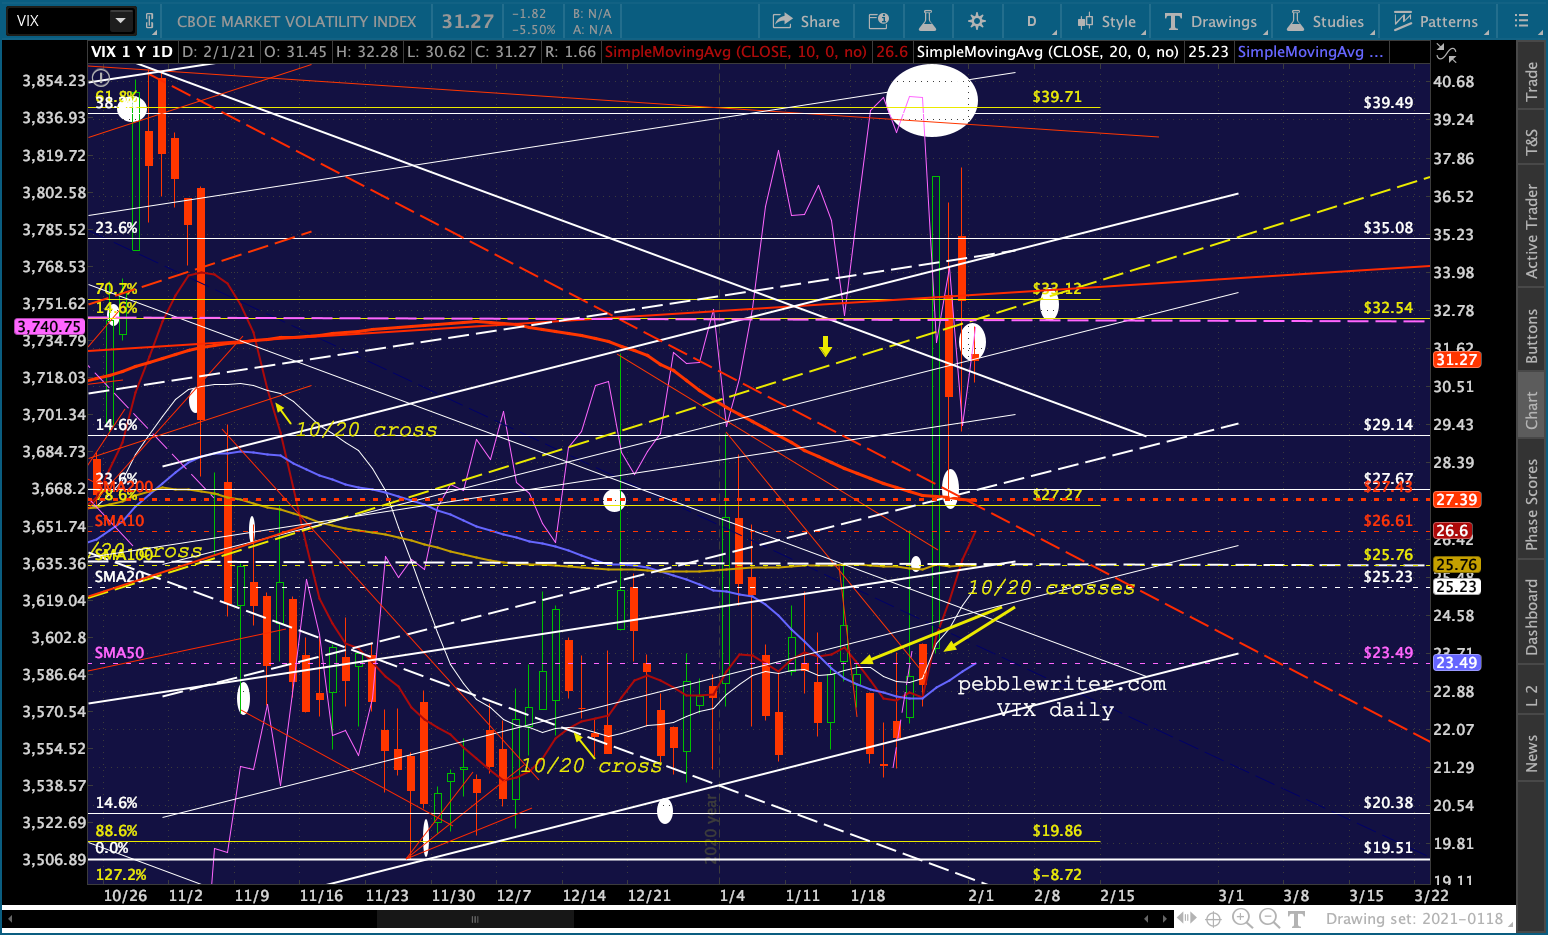
 VIX is backing off its breakout, and is back slightly below its white channel top.
 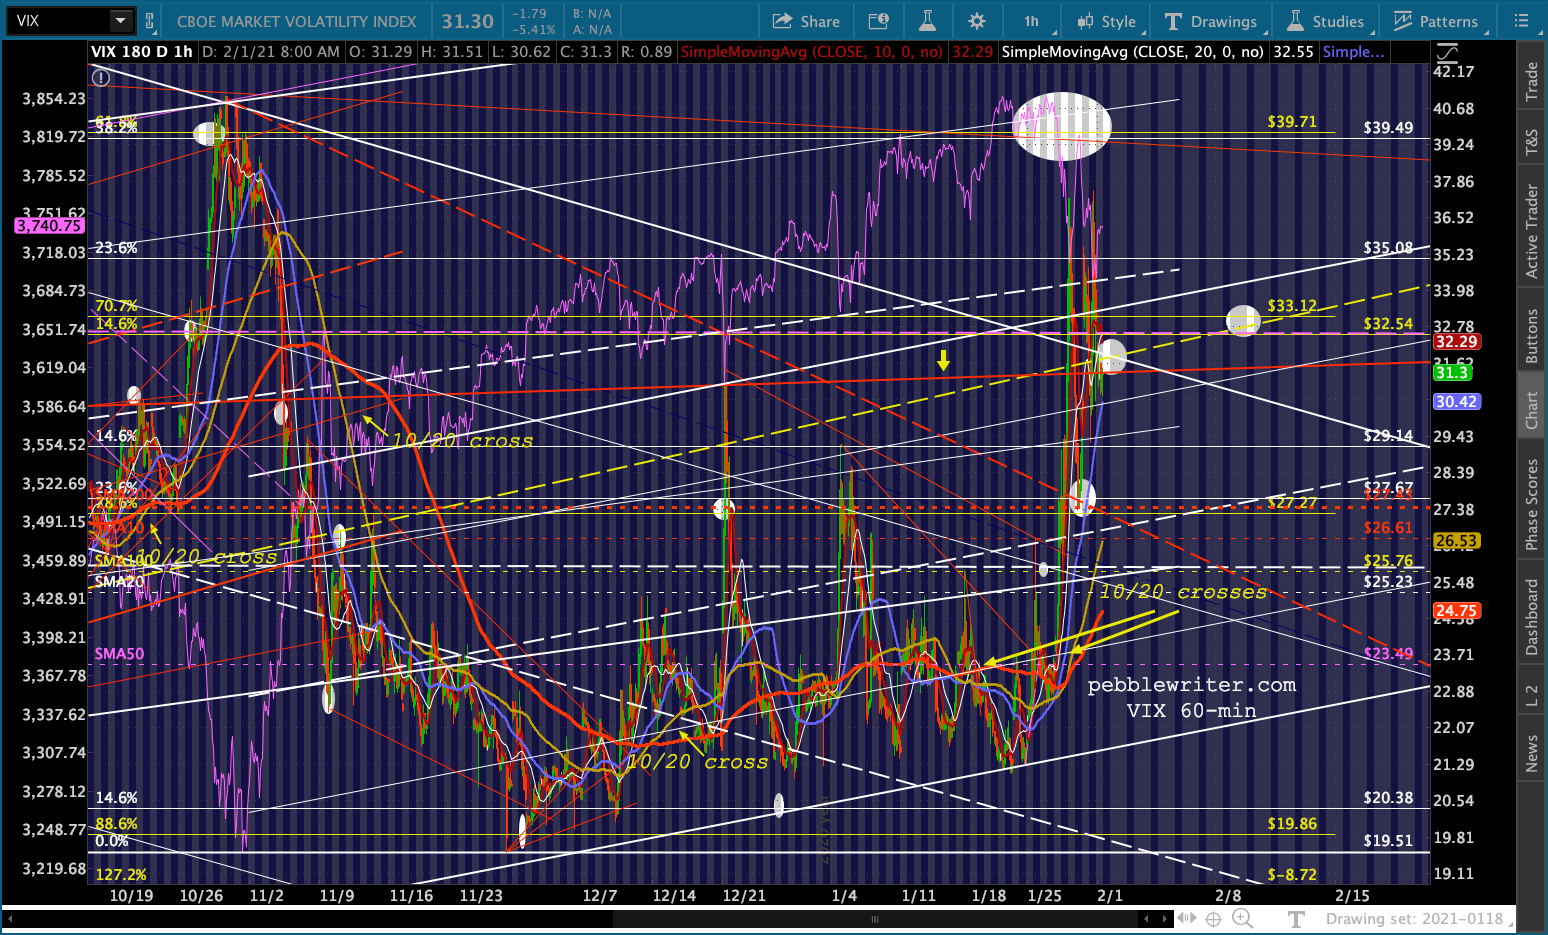 Though it remains in a bullish (bearish for stocks) 10/20 cross. The key is whether it can remain above the rising yellow TL at about 32.54.
  Most of the action, however, is coming from USDJPY – which looks likely to tag or exceed its SMA100 after breaking out of its falling purple channel as we expected.
 EURUSD is still sliding slightly lower…
  …which has boosted DXY somewhat. It still has a shot at a breakout.
 Oil and gas are rallying – enough to help stocks but not enough to make new highs.
