Silver, GME and AMC are all tumbling this morning as equity futures are responding to dramatic moves in VIX, oil and currencies. In short, things are getting back to normal. Or are they?
What if this was merely a backtest on steroids to stave off the bearish 10/20 SMA cross which would otherwise have occurred? ES reached our backtest target overnight, and now has some important decisions to make.
 continued for members…
The ES chart is admittedly somewhat jumbled. 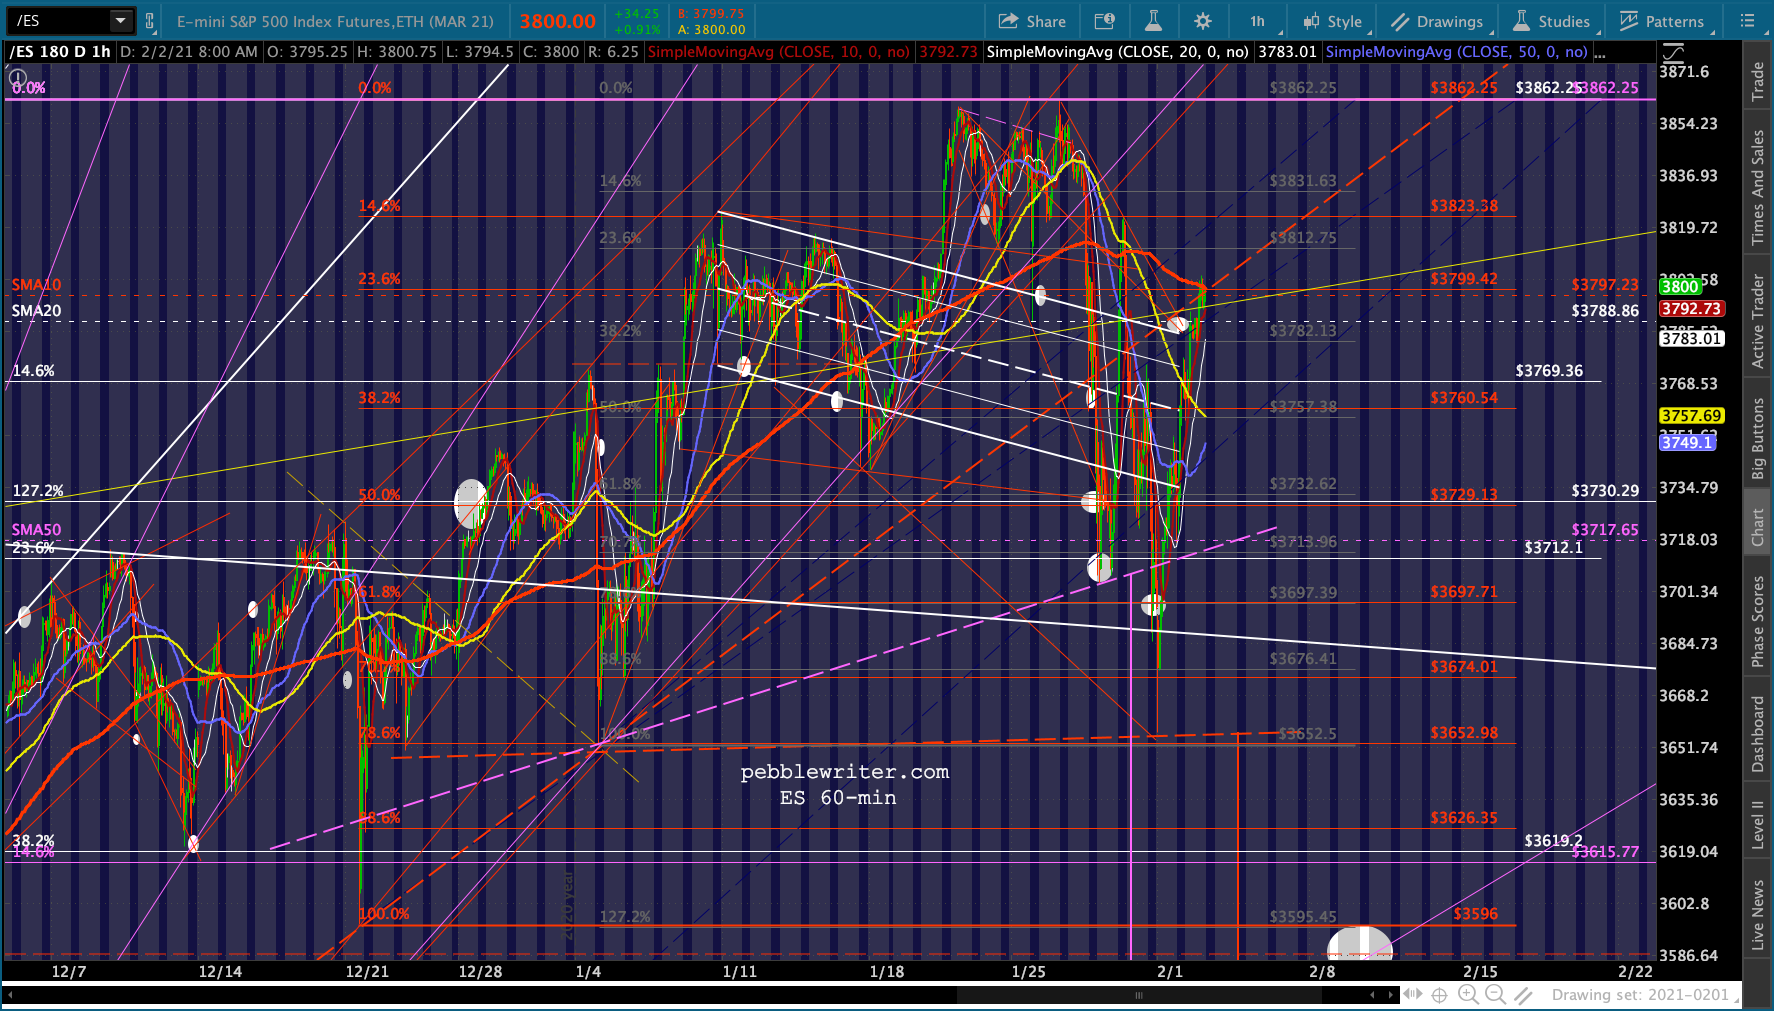
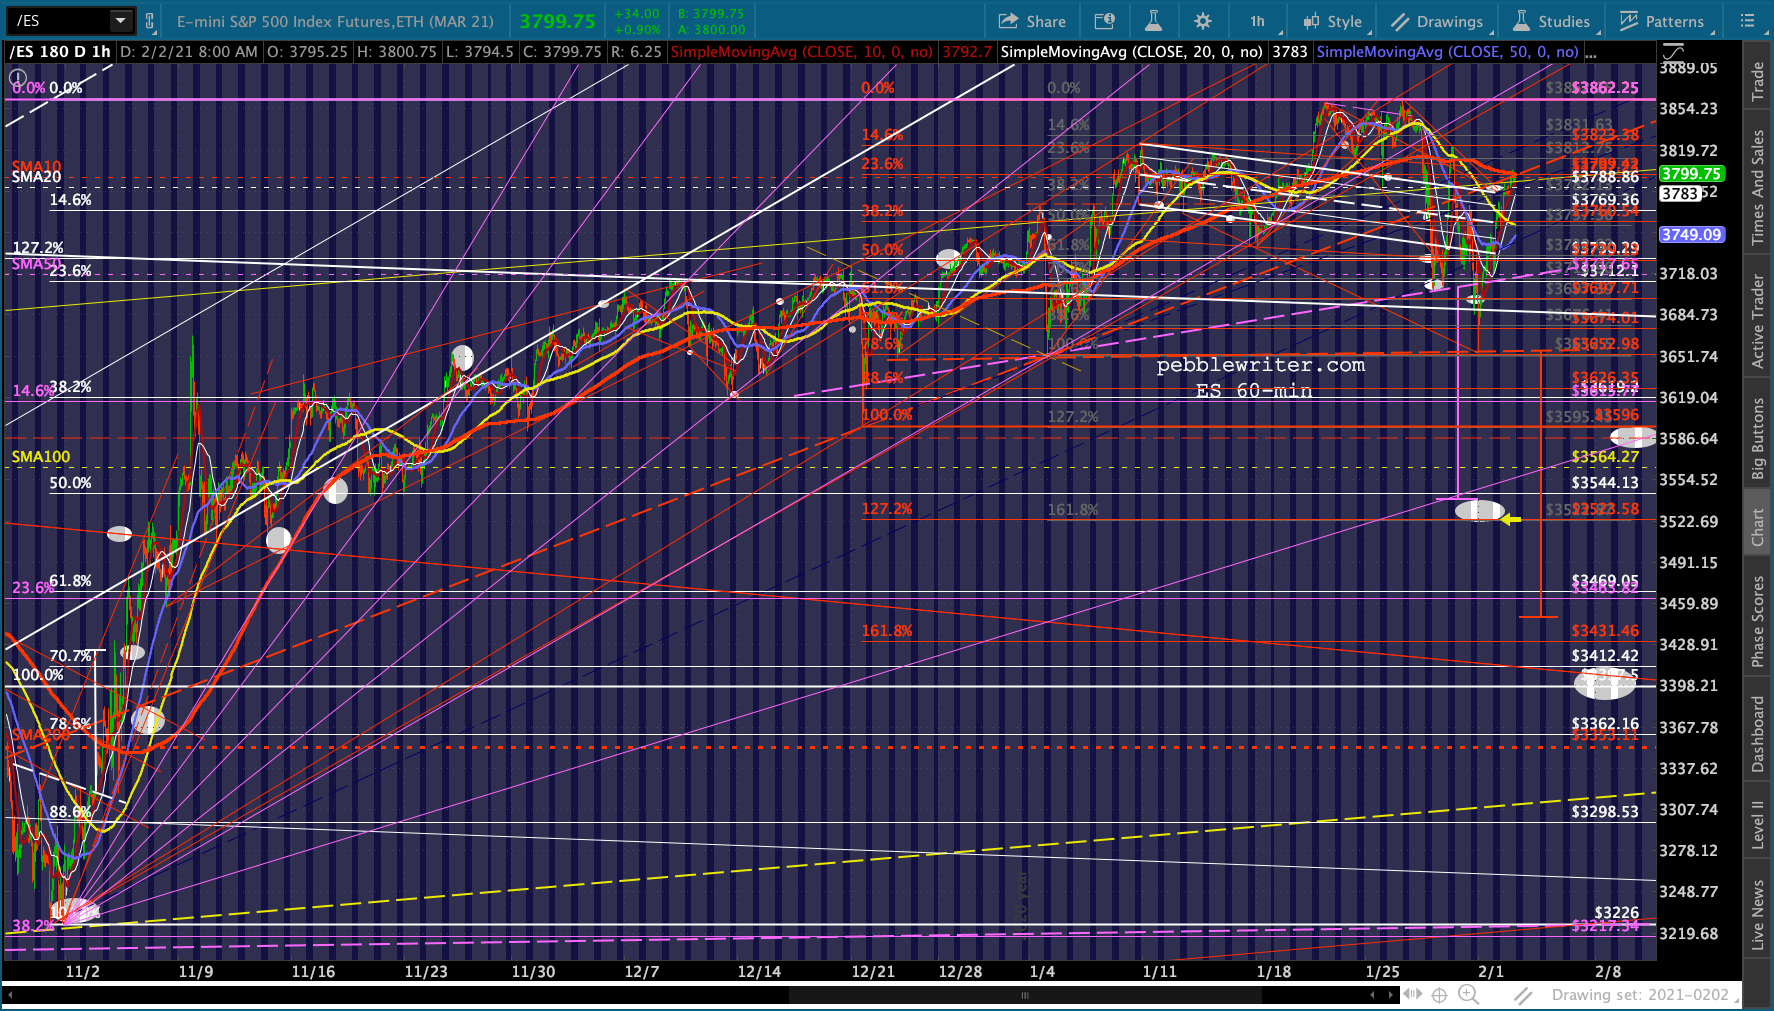 The chart below simplifies things. This is what happens if the purple and red dashed TLs can’t be topped. The yellow H&S Pattern targets where the SMA200 is likely to be in a few weeks.
 Right now, VIX is backtesting its SMA200 and SMA10…
 …and USDJPY is closing in on its SMA200 as EURUSD reaches TL support.
 As a result, DXY is breaking out – not normally a positive for stocks lately.
As mentioned, GC and SI are taking a hit.

CL and RB remain wildcards. How much longer can they continue to rally given the need for much lower levels in the coming months?
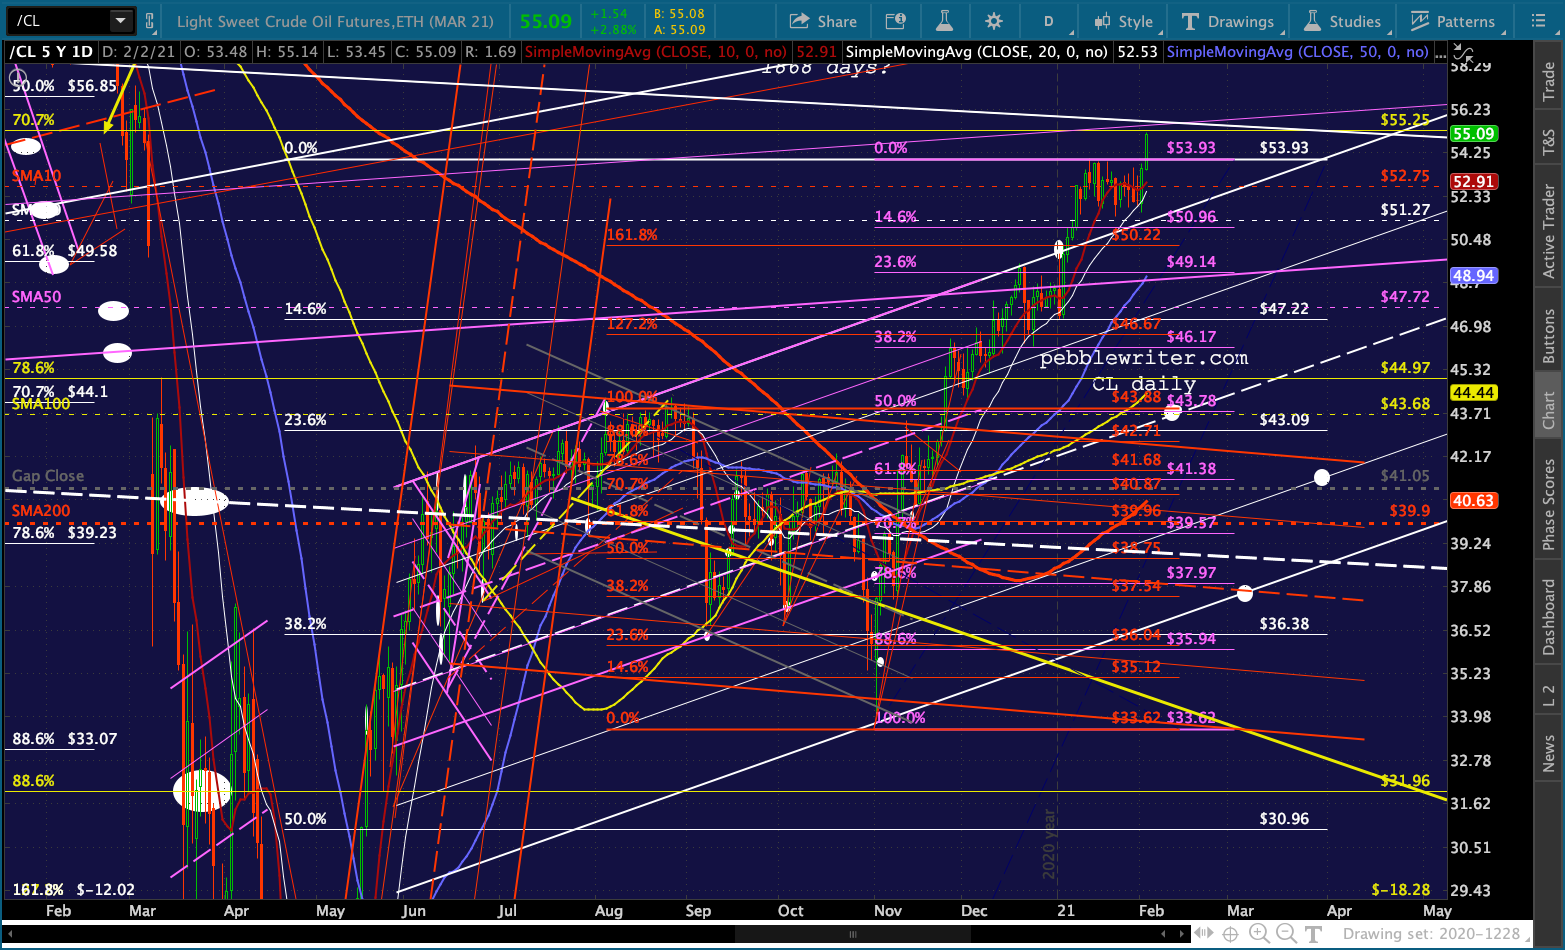
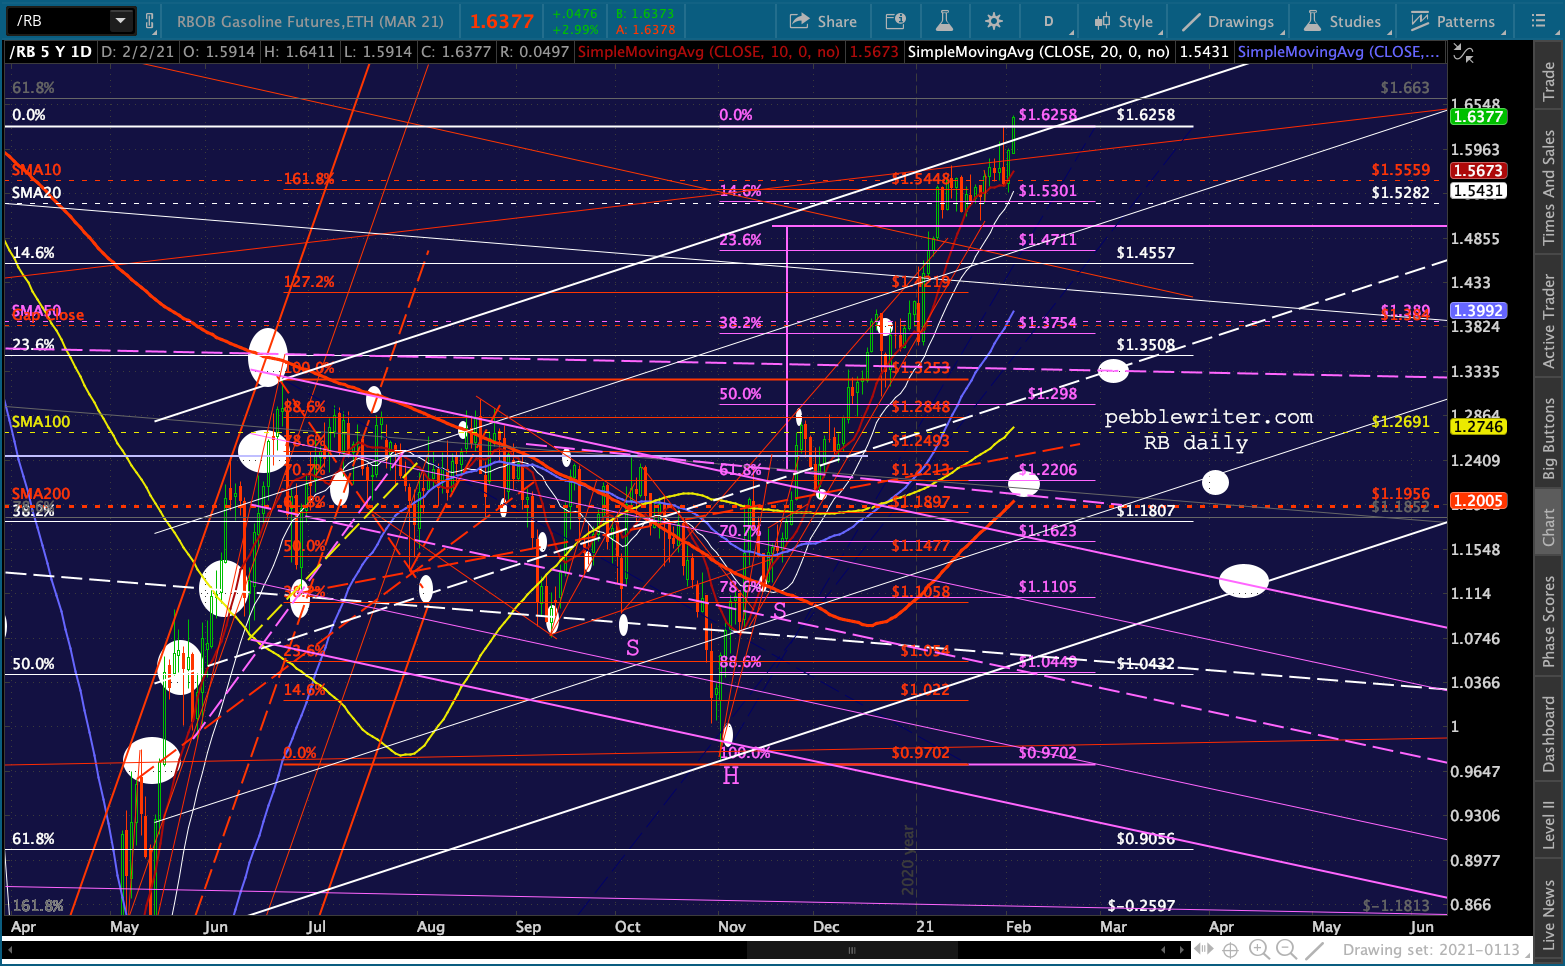 I’ve seen a number of Fed presidents interviewed lately, all of which seem to be preparing the way for higher inflation rates – insisting that it will be no big deal. I have yet to hear one reference the true cause: rapidly rising oil and gas prices.
The bond market continues to reflect rising inflation expectations, with TNX recently failing to tag its channel bottom – a recurring theme which supports stocks.
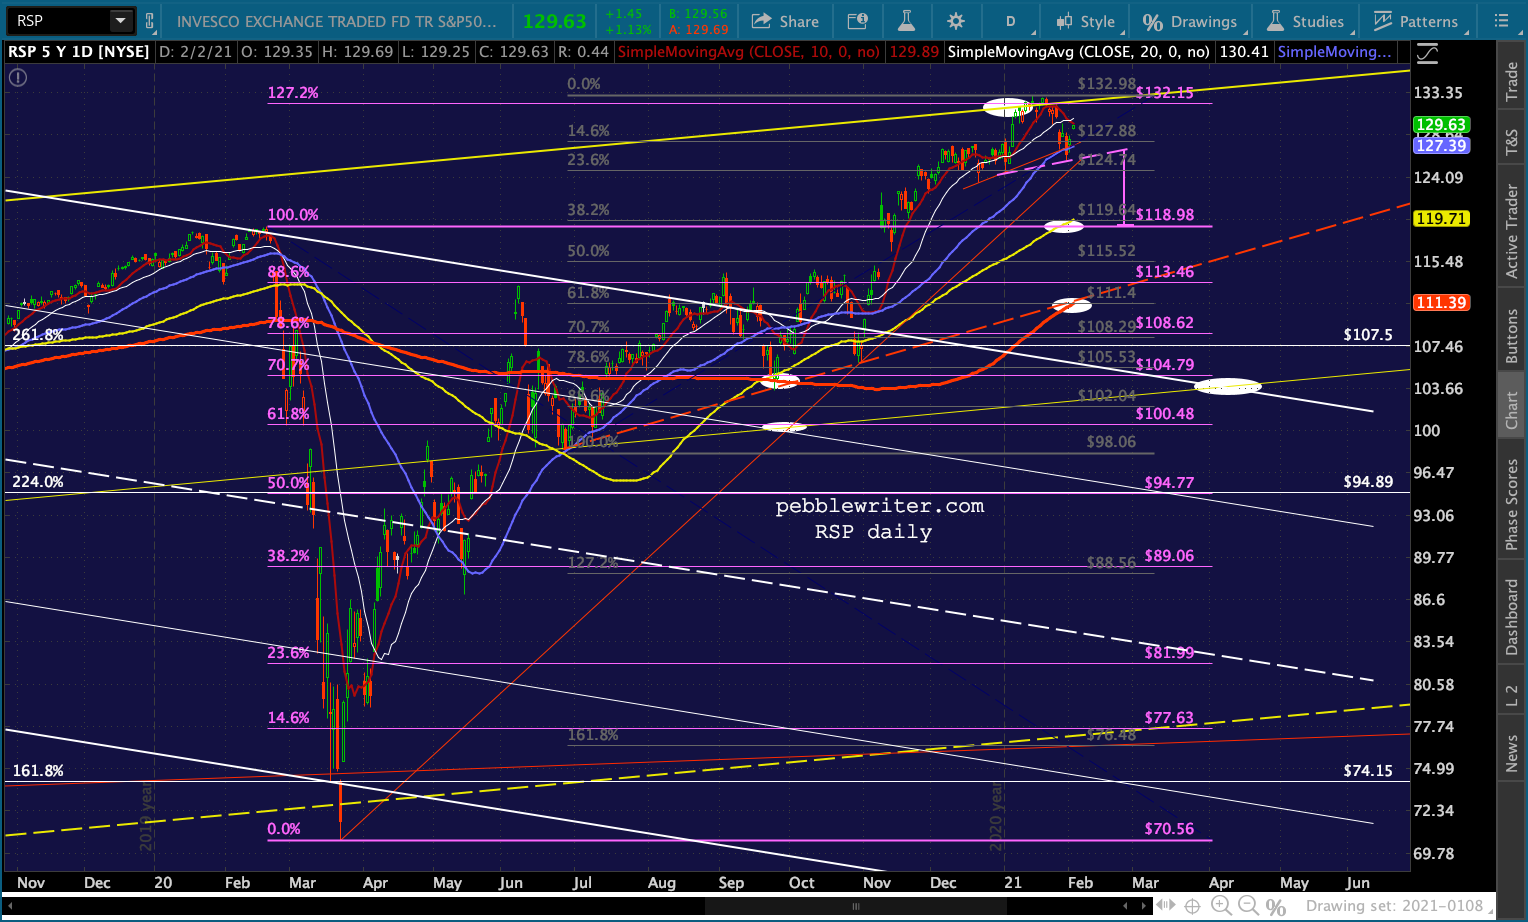
 RSP suggests that the downside case might be what TPTB have in mind. By bouncing yesterday, it has risen back above its red neckline much like ES did. But, it could also be forming a larger, flatter H&S – shown below in purple – which precisely targets the Feb 2020 highs.
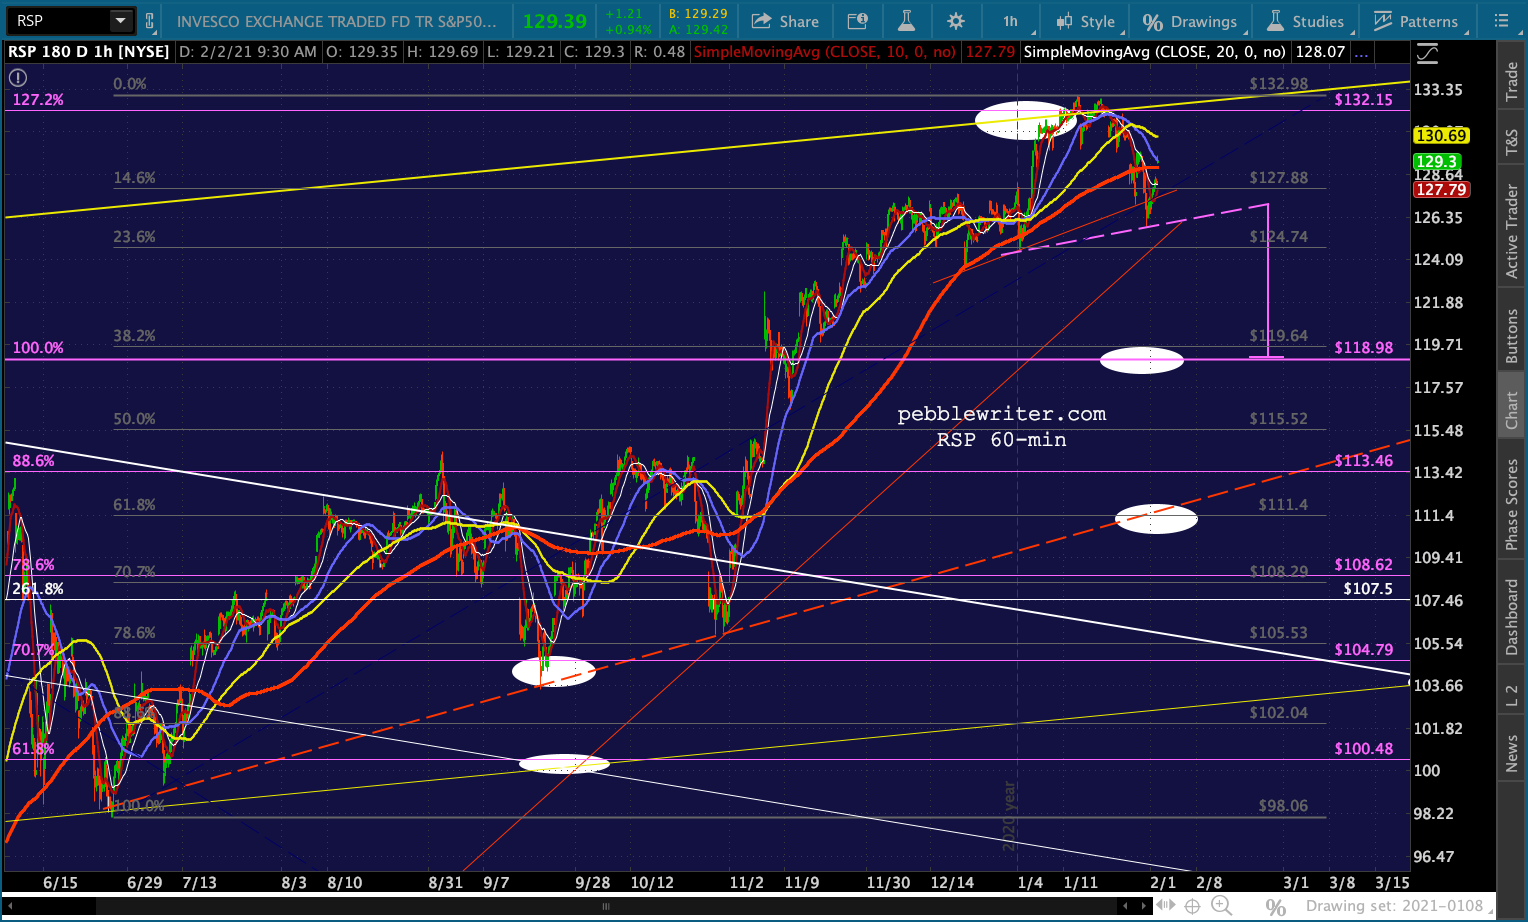 It’s not a huge pattern, but it accomplishes a lot of things all at once. With the Feb-Mar lows out of the way, the SMA200 could be up to that level sometime around late Feb.