

Is this really, as Trump maintains, the “greatest economy ever?” Hardly. Sure, changes in the way that inflation and employment data are calculated/defined have allowed the government to report generally positive results. But, one needn’t dig far beneath the surface to realize that they not only don’t represent the real economy; they’re downright deceptive.
Because inflation data is baked into so much other economic data, it renders the whole lot of it suspect — not to mention inconvenient. Because inflation is vastly understated, some of the barometers that argue for dovish monetary policy are sending false messages. And, because unemployment is vastly understated, some of the barometers that argue for hawkish policy are sending false messages.
April advanced retail sales figures came in ugly.
 The rest of the recent data wasn’t much better.
 The market isn’t taking it well. S&P 500 futures are extending their losses and closing in on our key SMA200 target from Apr 30 [see: FOMC Endgame.]
 continued for members…
SPX’s version of the same chart shows it’s still up in the air whether we get there today or tomorrow.
 VIX is also ambivalent.
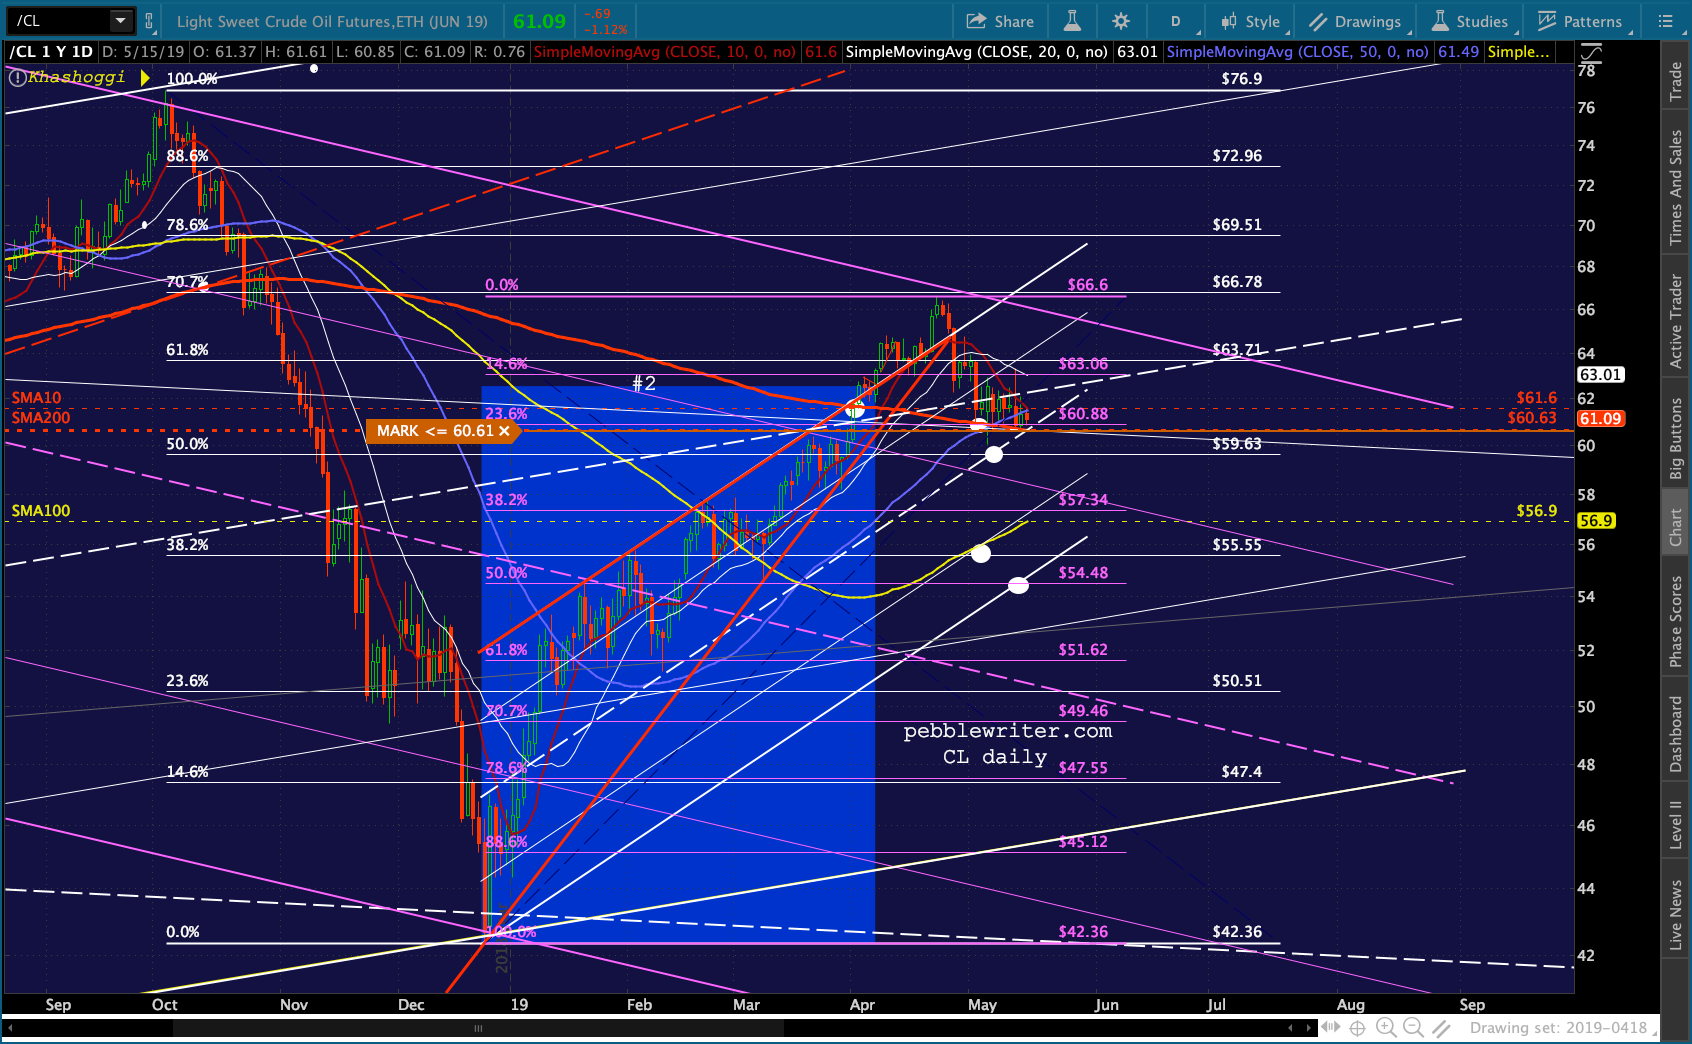
 CL would have to dip slightly below its SMA200 to tag the channel midline today. Tomorrow, it wouldn’t have to.
 RB still seems content to backtest the broken yellow channel top. A drop through to the SMA200 would do a lot of damage.
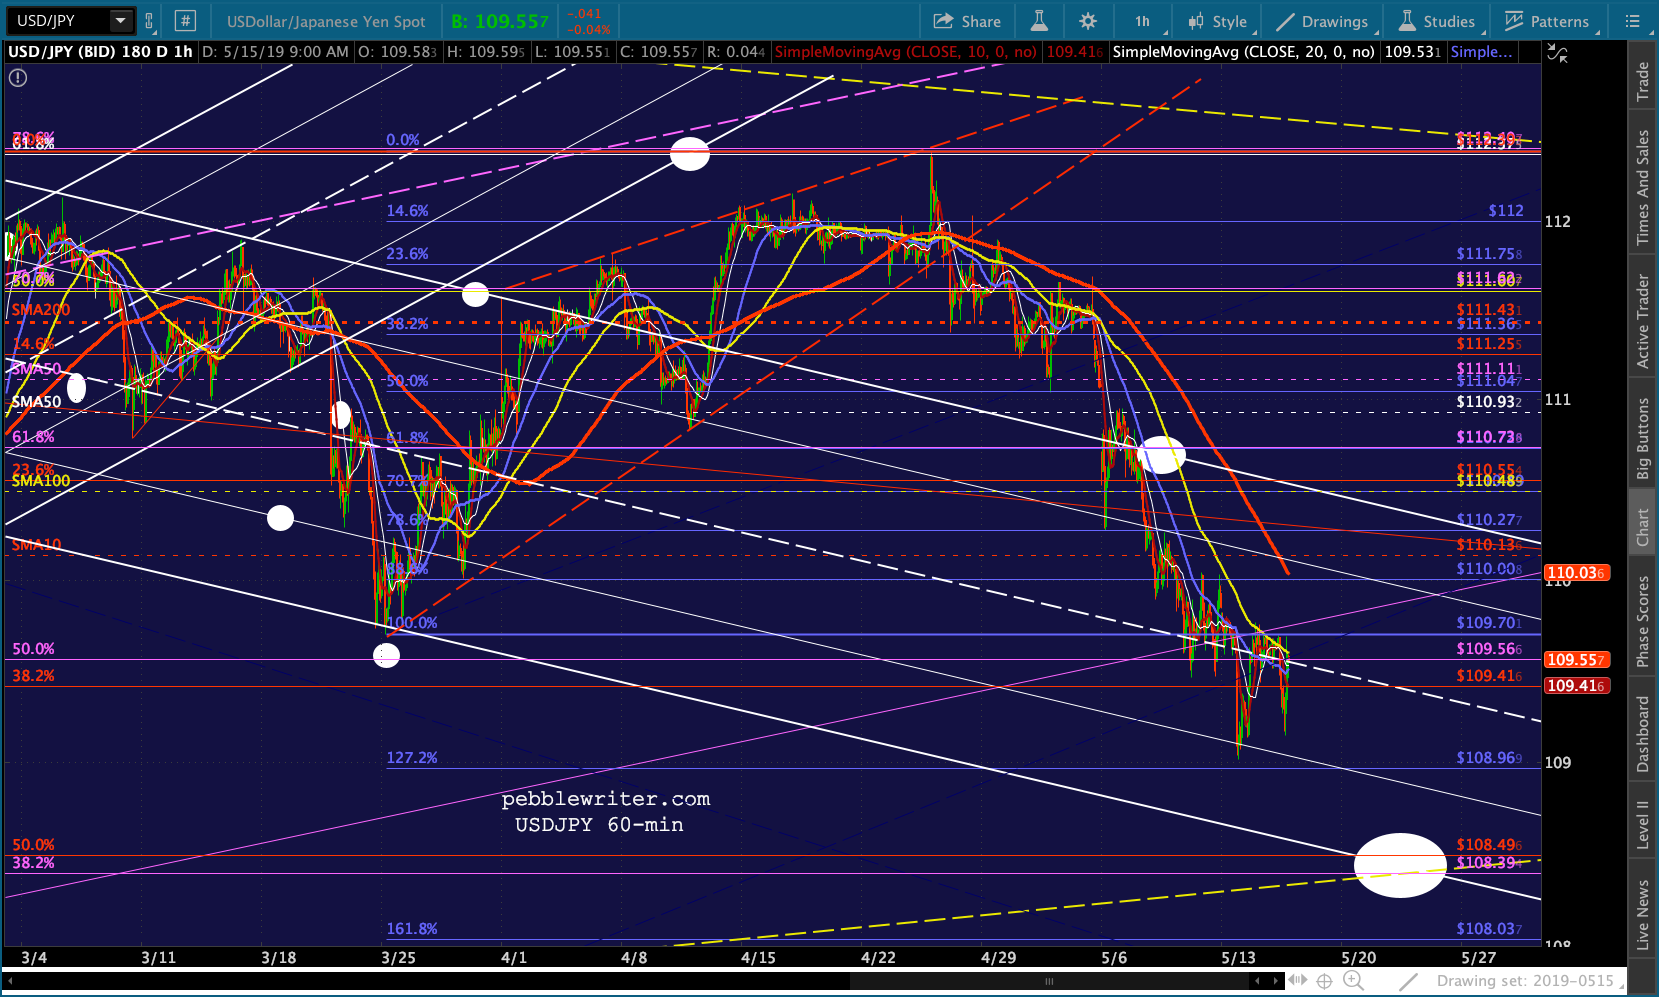
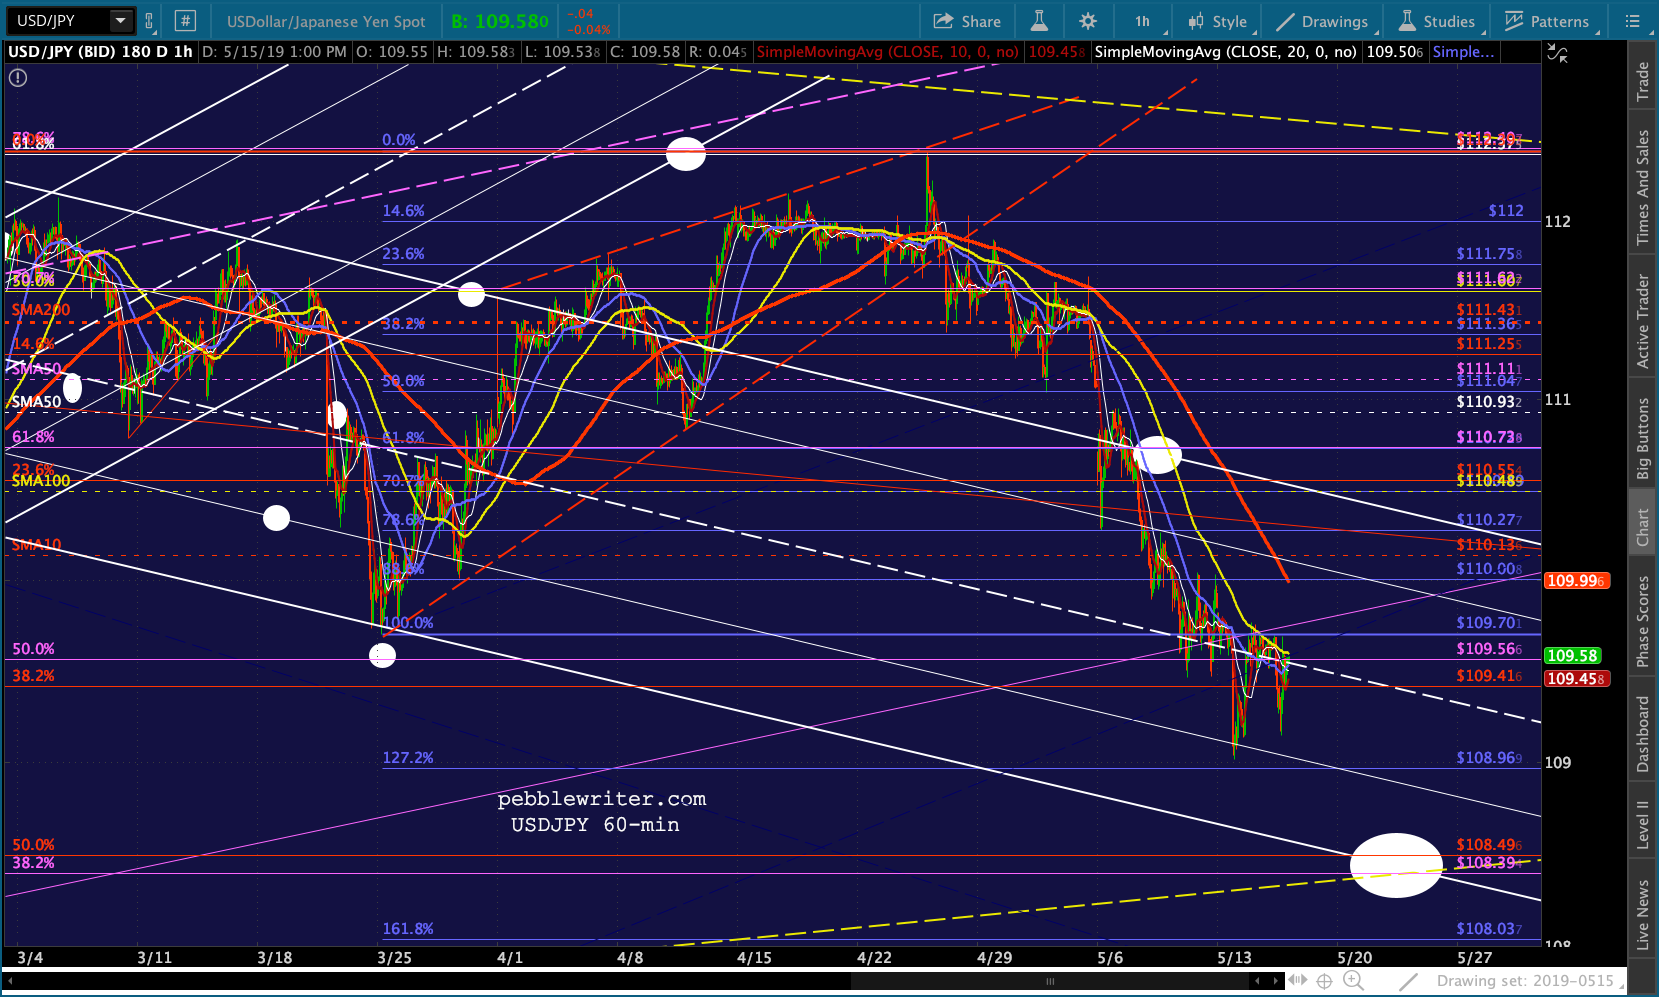
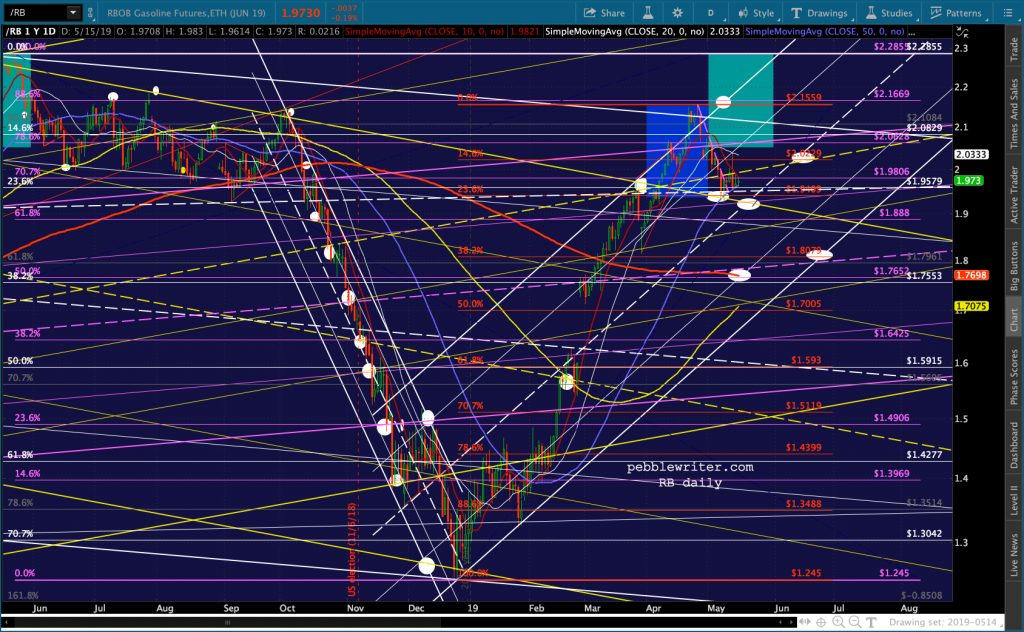 On the currency front, USDJPY has resumed its slide.
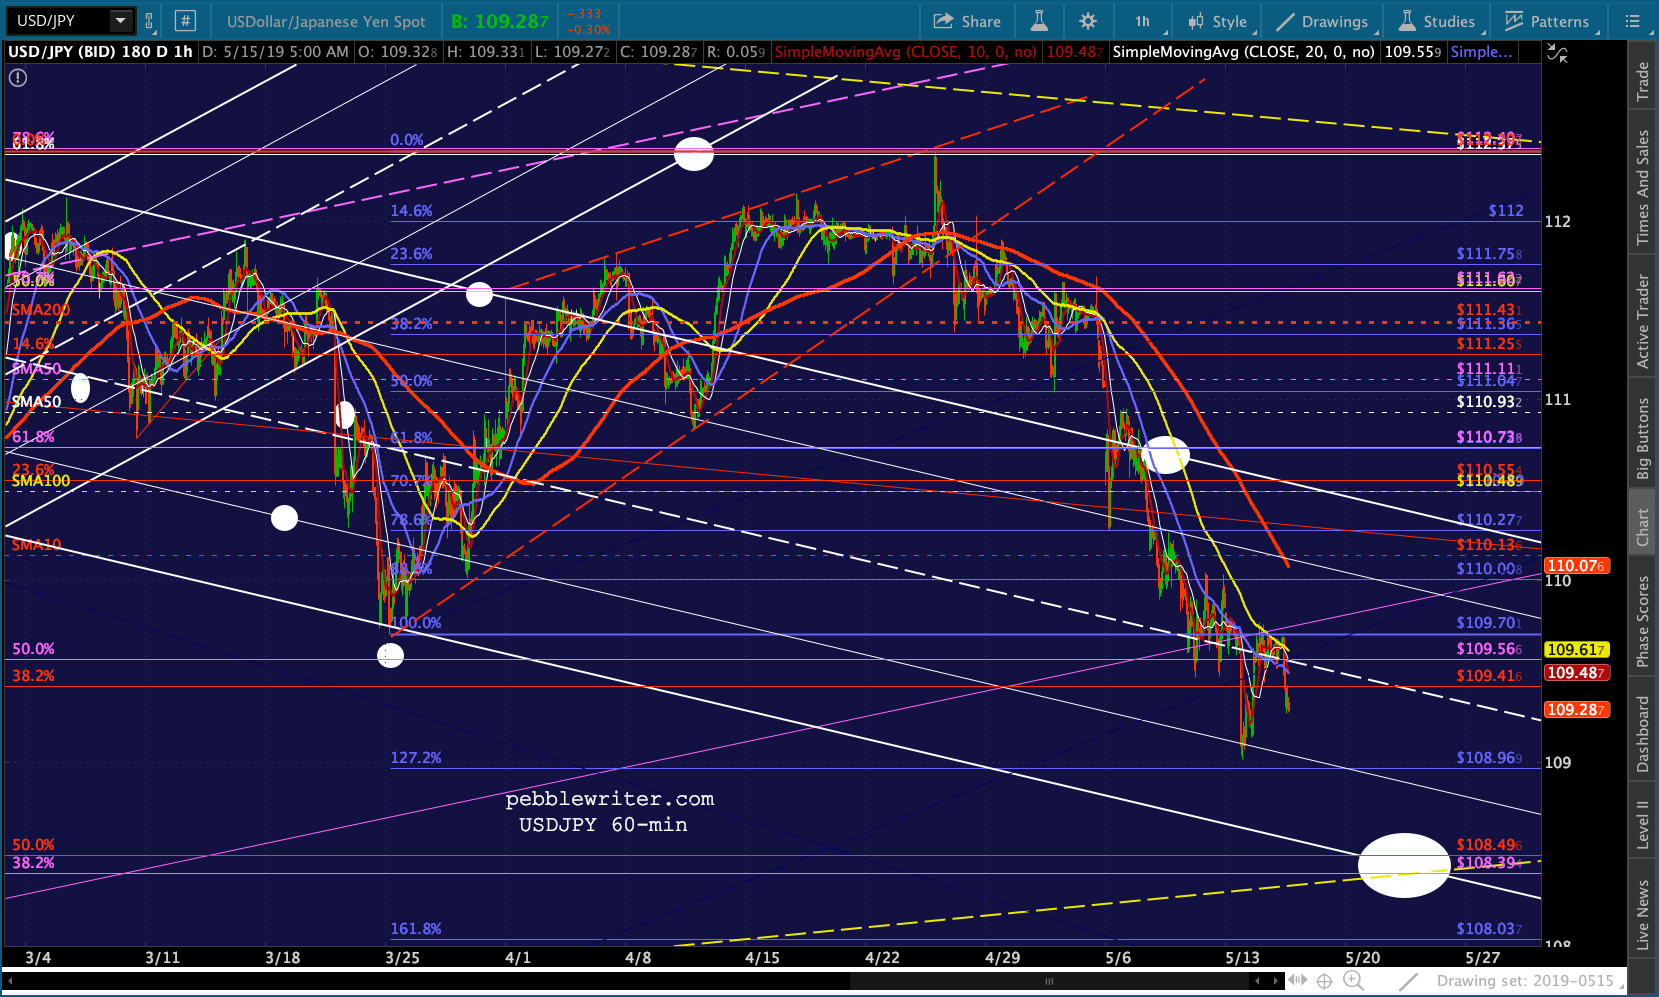
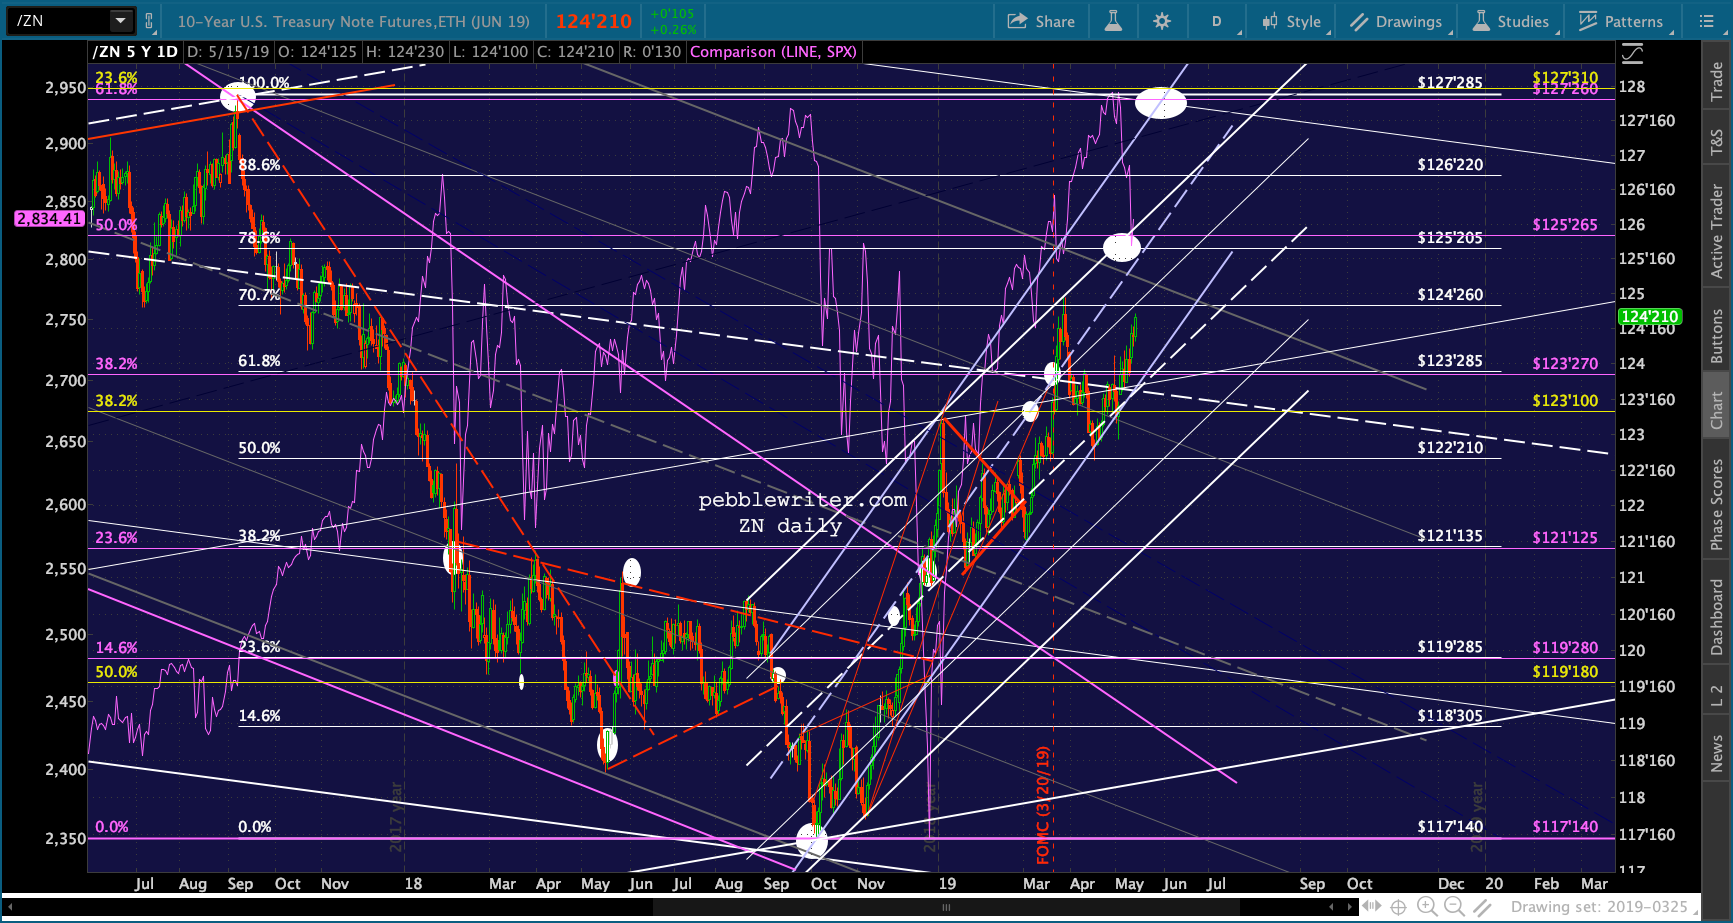
 And, the 10Y marches on toward our targets.
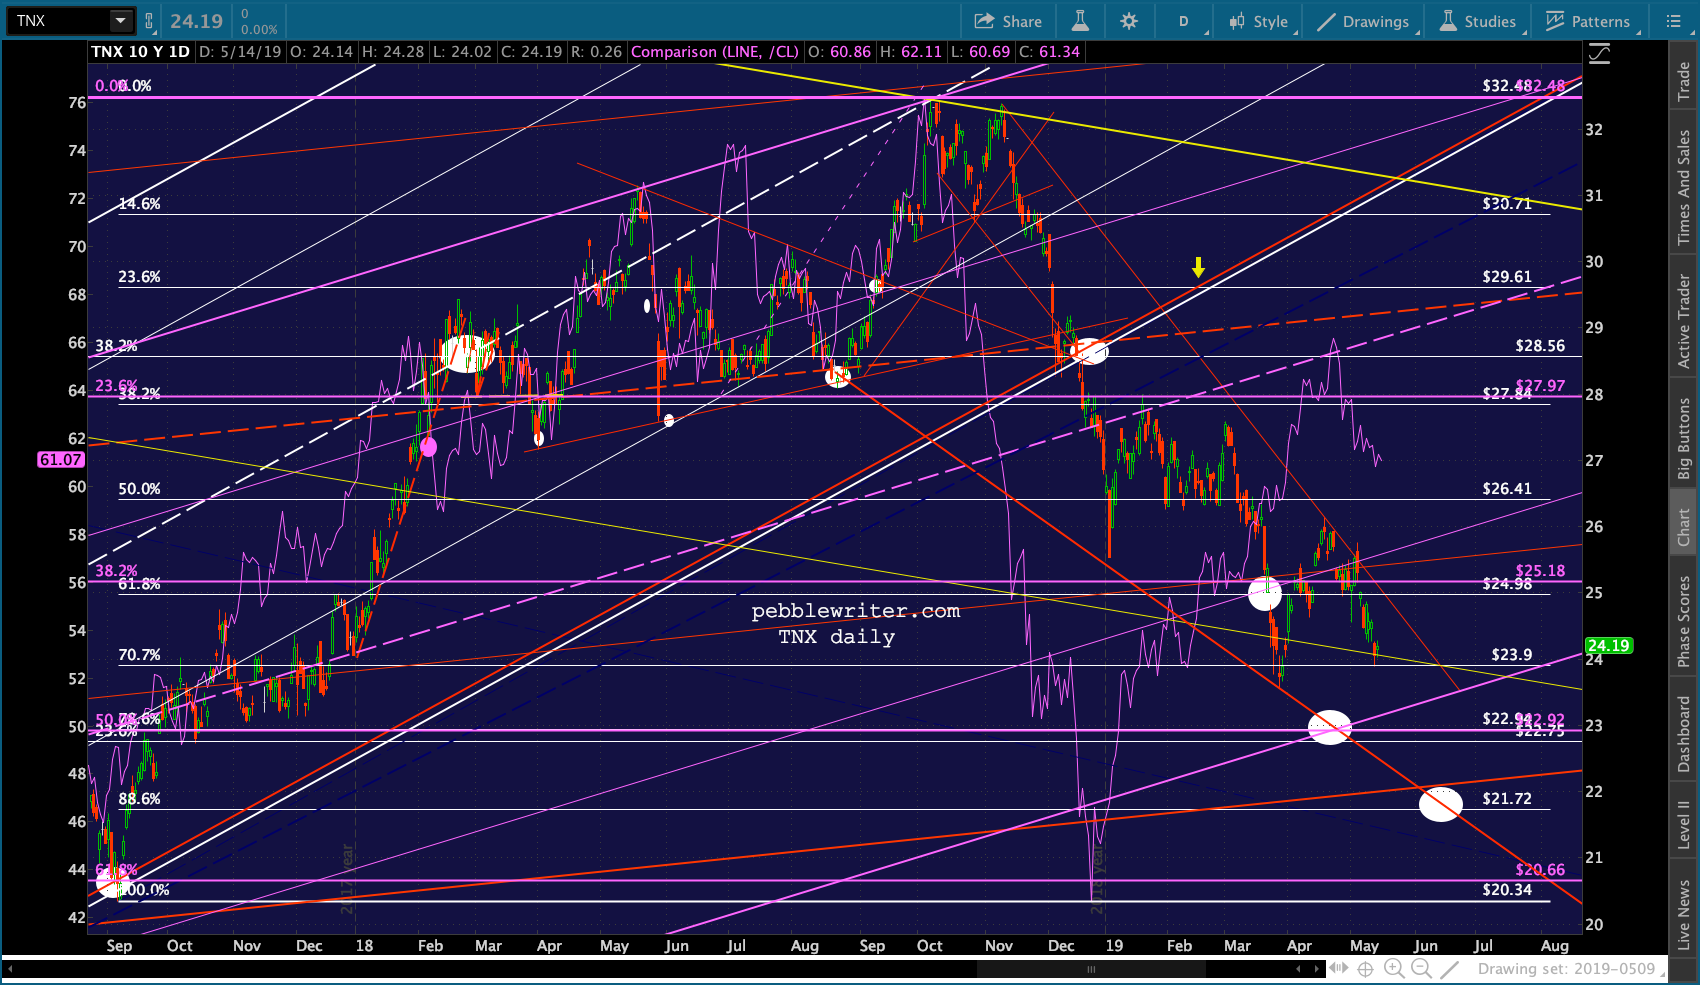
 The 2s10s is still broken out…
 …and the 2Y is still broken down…
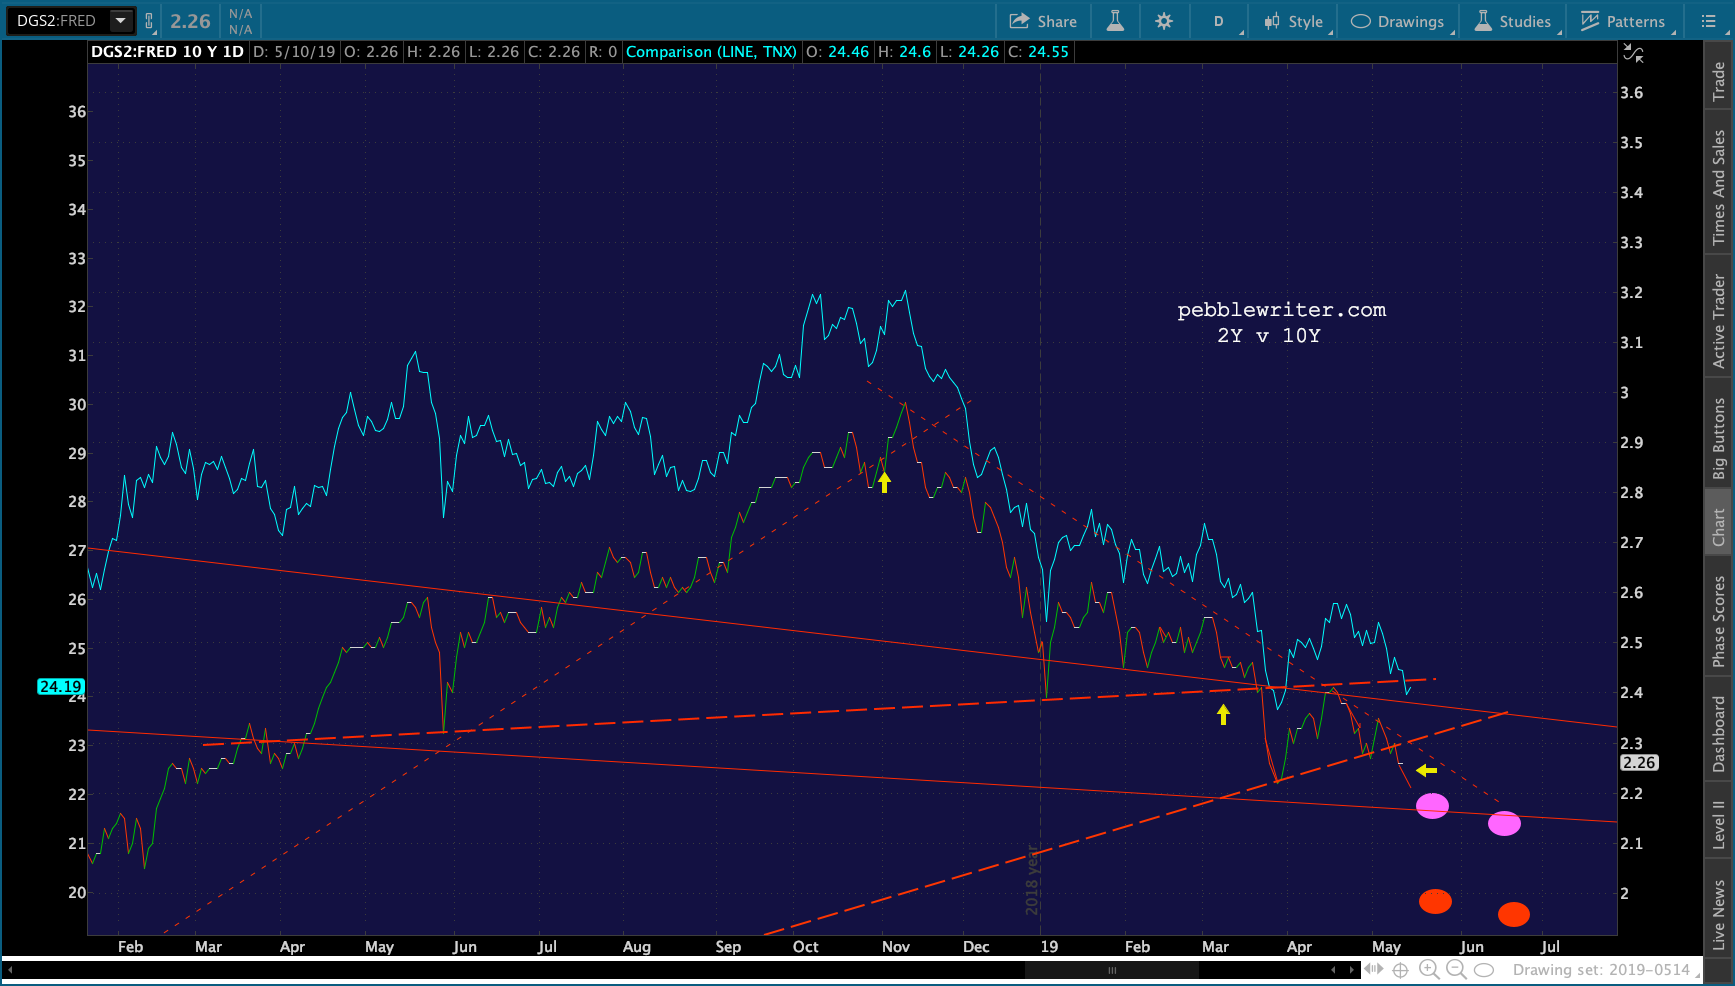
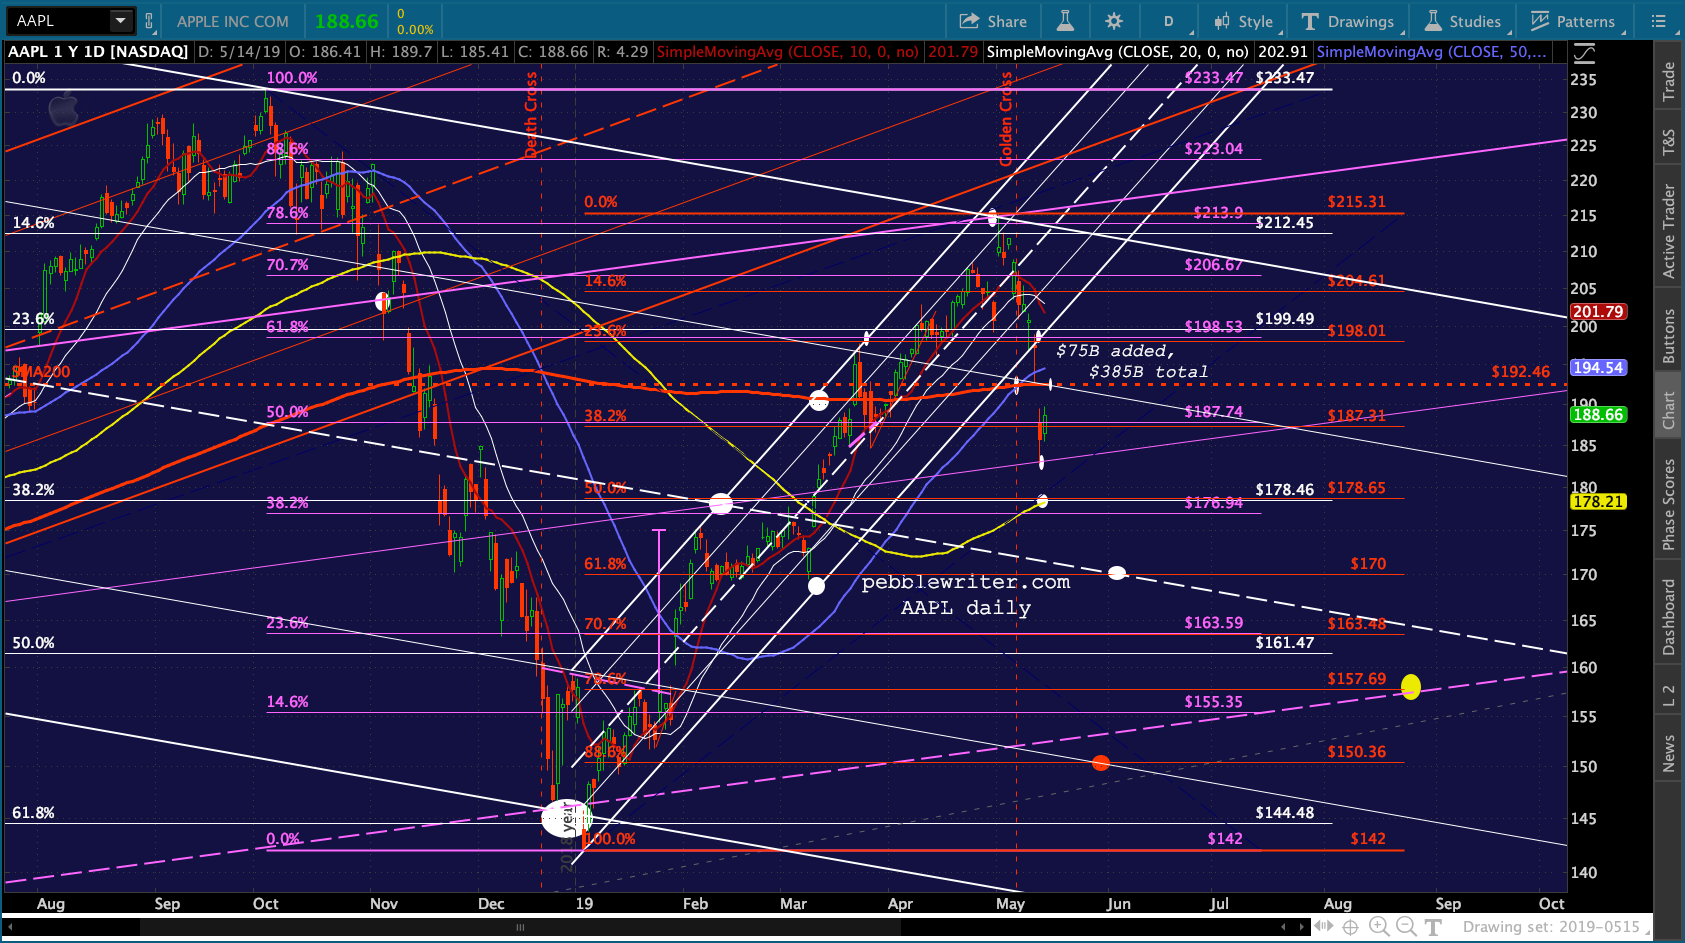
For those watching AAPL and BA, note that they are still testing support.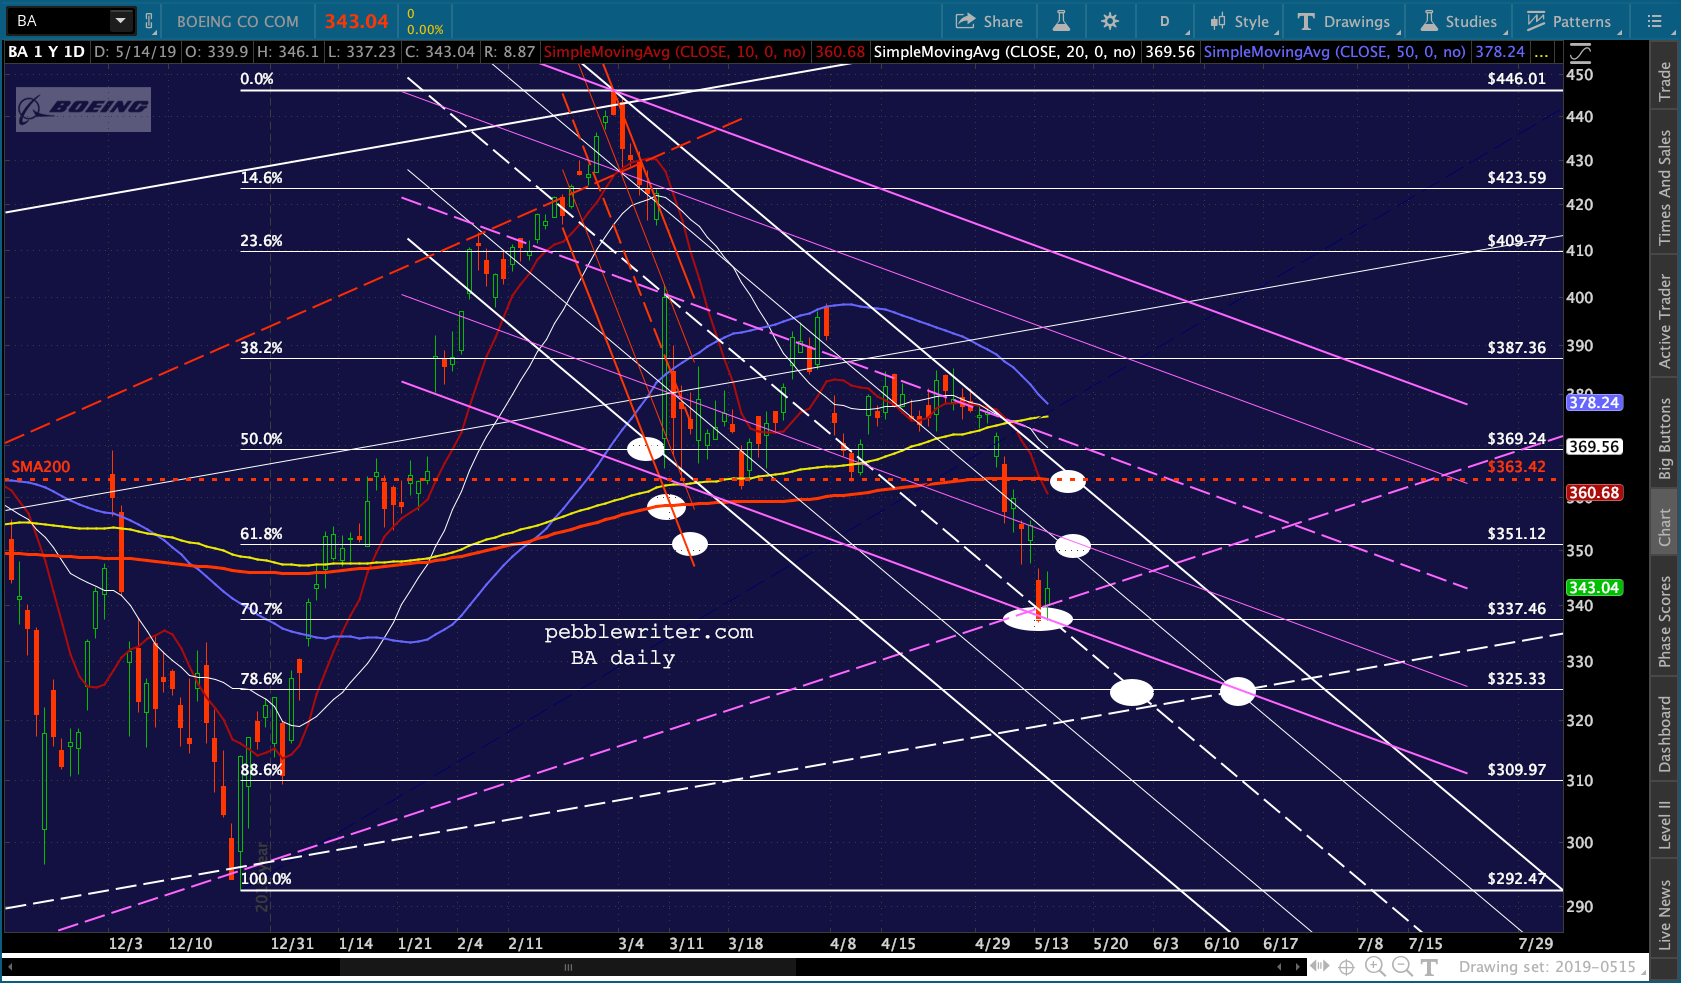
 While COMP has encroached into the falling white channel it broke out of and, if it stays in it, is potentially targeting its SMA100/200 cross later this month.
UPDATE: 12:10 PM
Guess we got our answer regarding whether the SMA200 tag will be today or tomorrow. ES and SPX are both back up to their channel tops — a good 80+ points above their targets. A drop from here would be almost as steep as it was on Monday.
 VIX broke down from the opening bell and is now testing its own SMA200.
 USDJPY has regained its overnight losses.
 And, CL and RB have bounced.
 Gold has not only held the bottom of its rising white channel but has broken out of the falling white channel in place since Jan 29. While the downside case isn’t kaput, the upside case gets a boost with the breakout.
* * *
I started writing about the big picture a couple of weeks ago and ran into some snags with my research. A number of you have reached out wondering where things stand.
My basic thesis remains that the market has potentially a lot of downside still – possibly as low as 2138 or thereabouts. I think the majority of TPTB have decided it would be a bad idea (even downright dangerous if he feels the need for military action in order to bolster his standing) for Trump to serve another 4 years. Warning: tin foil hat territory ahead.
The biggest obstacle to replacing him is that the market has done well since Nov 2016 — still up 33% at current prices. It’s still very early stages, but as long as he has a shot at winning there’s a good chance the market will be allowed (or made to) tumble.
If he were to suffer some significant mishap related, say, to the Mueller investigation, there would be less need for such drastic action. But, in general, the better his poll numbers, the better the chance of a meaningful selloff.
Why does that matter? Currently, Trump is agitating for help from the Fed. While he might have some fans on the Fed, I think they are generally aligned against him — meaning they will hesitate to lower rates at all, much less a full percentage point.
The only way the Fed can get away with not cutting rates is if price and wage inflation is “under control.” High inflation, such as we might expect with bigger tariffs, argues for no cut or even a resumption of hikes. Low inflation, on the other hand, would argue for more accommodative policy. This is where things get complicated.
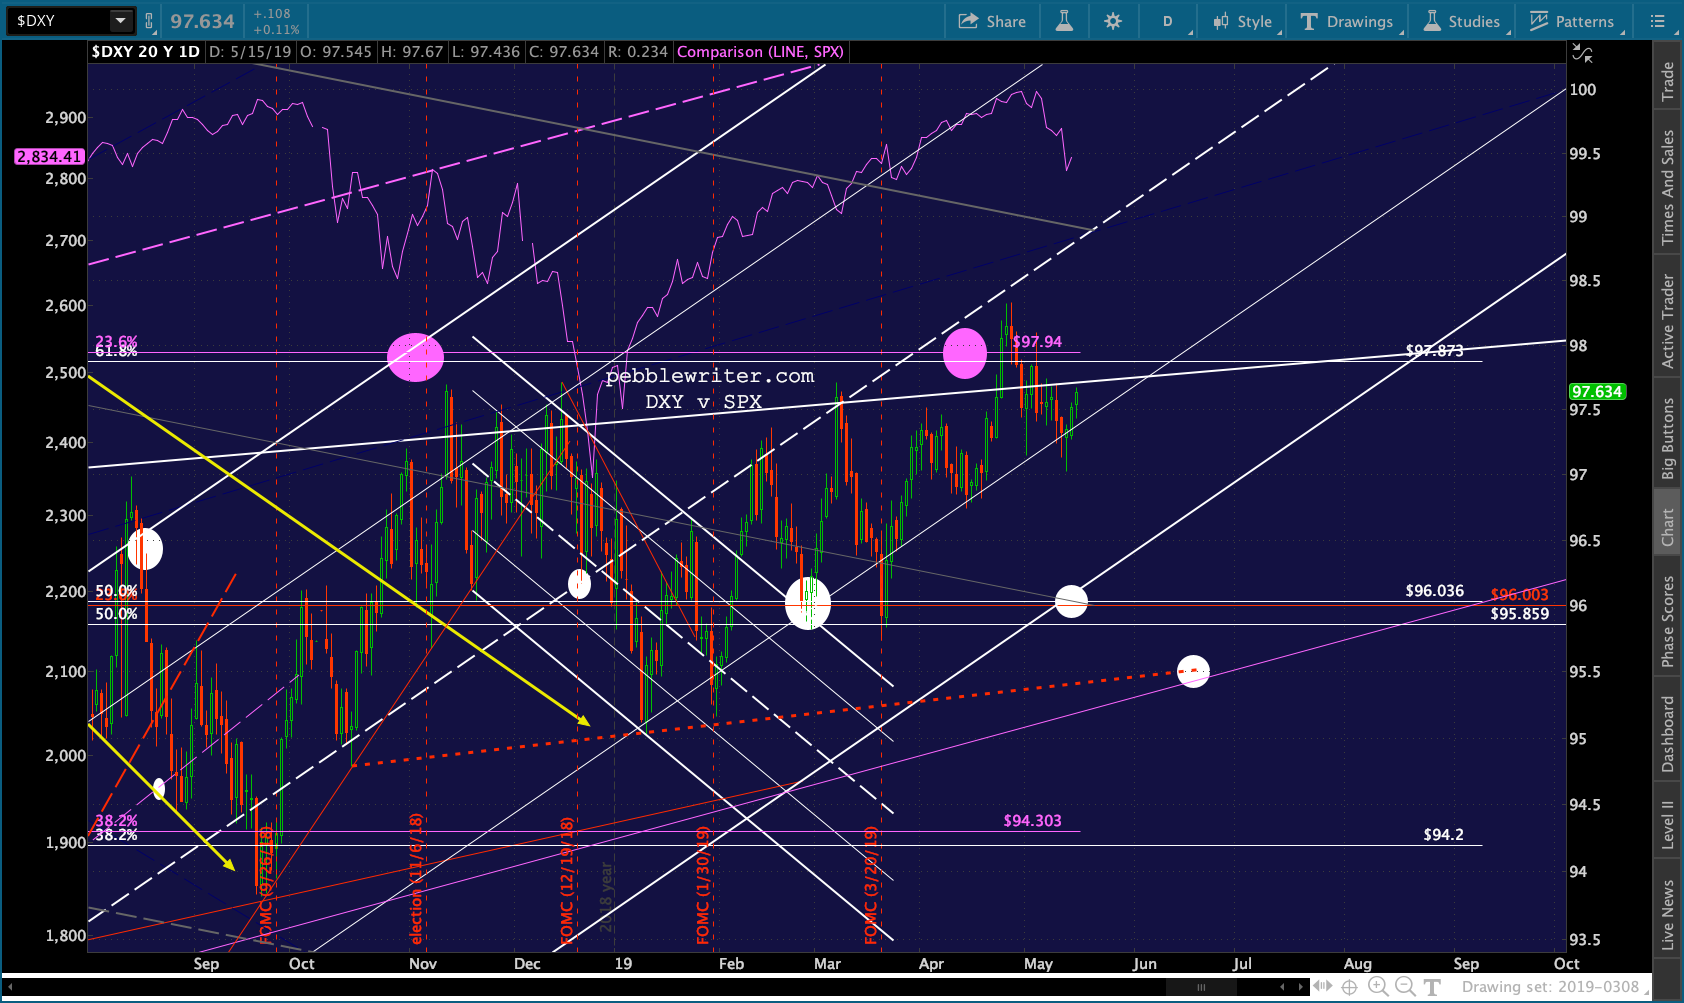
Given that Trump wants lower rates and a return of QE, he must want lower inflation. The way to accomplish that is to force oil and gas prices lower, settle the trade wars, and keep the dollar strong. But, his actions do not support these goals.
The threat of military action in the Middle East is on the rise. The trade war is reportedly nowhere near solved. And, the dollar is not only very overbought but susceptible to a fall if yields continue to settle lower – which they should. Oh, and lower oil and gas prices will, all else being equal, deflate stocks.
Are Trump and his advisors aware of the above? I don’t see how they couldn’t be. Perhaps it’s just a timing issue — meaning, Trump and friends will change course as we get closer to the election. They certainly have their hands full as it is. And, who knows, Trump might have gotten all the jollies can stand after only four years.
But, the net result of the above is that Trump would want inflation between, say, 1-2% – meaning the inflationary pressures of tariffs would need to go away, the dollar would need to stay strong, and oil and gas prices would need to remain flat relative to last year’s monthly prices (it’s all about the YoY increases/decreases.)
If (I realize this is a big “if”) the above has any basis in reality, what might we expect? The Fed would want to avoid cutting rates, meaning that they would want to avoid inflation deemed too low. But, they would also wish to avoid an obviously strong economy which might help Trump win reelection.
Having said that, they might not be averse to high-ish inflation as this would presumably argue against a rate cut and might even result in the desired market turmoil. In other words, they would want CPI in the 2.0-2.5 range or even higher. This would mean a modest increase in oil/gas prices if tariffs are a factor or a larger increase in oil/gas prices if tariffs are not.
So, we potentially have the Fed and its functionaries positioning for slightly hotter inflation (higher oil/gas prices, lower dollar) and Trump and his minions positioning for slightly cooler inflation (lower oil/gas prices, higher dollar.) The unknowns are many and include the trade war(s), Middle East unrest, and unscripted market activity (e.g. Boeing.)
So far, Saudi Arabia has been quite accommodating to Trump’s wishes re oil prices. This isn’t necessarily set in stone. But, it’s hard to imagine that any of Trump’s political opponents could offer a better deal than immunity re Khashoggi, indifference toward Yemen and hostility toward Iran.
So, the Fed might have a hard time doing anything about low oil/gas prices. We’ll see. If so, they would have to turn to the currency and bond markets. We’ve seen yield curve inversions already. And, the 2s10s is breaking out as the 2Y breaks down — both of which have consistently led to equity market declines in the past.
Toss in some weakness in the dollar courtesy of a falling USDJPY (Abe rolls his eyes) and you have all the ingredients needed for a continued correction that, if TPTB play their cards right, takes on the look of the 2015-2016 correction and puts SPX back where it was when Trump was elected right fairly close to November 2020.
Absurd? Of course. I feel downright silly even posting this, as it sounds like conspiracy theory twaddle to me, too. But, I’ve had this notion for the past year or so and, so far, nothing has happened to make me think it couldn’t possibly be true.
Over the next couple of days, I’ll attempt to stipulate some prices for USDJPY, CL/RB, GC, DXY, TNX, 2s10s and SPX to facilitate actual investment decisions.
* * *
Meanwhile, SPX has closed at the top of the falling white channel — meaning it has 75 points to go before reaching its SMA200.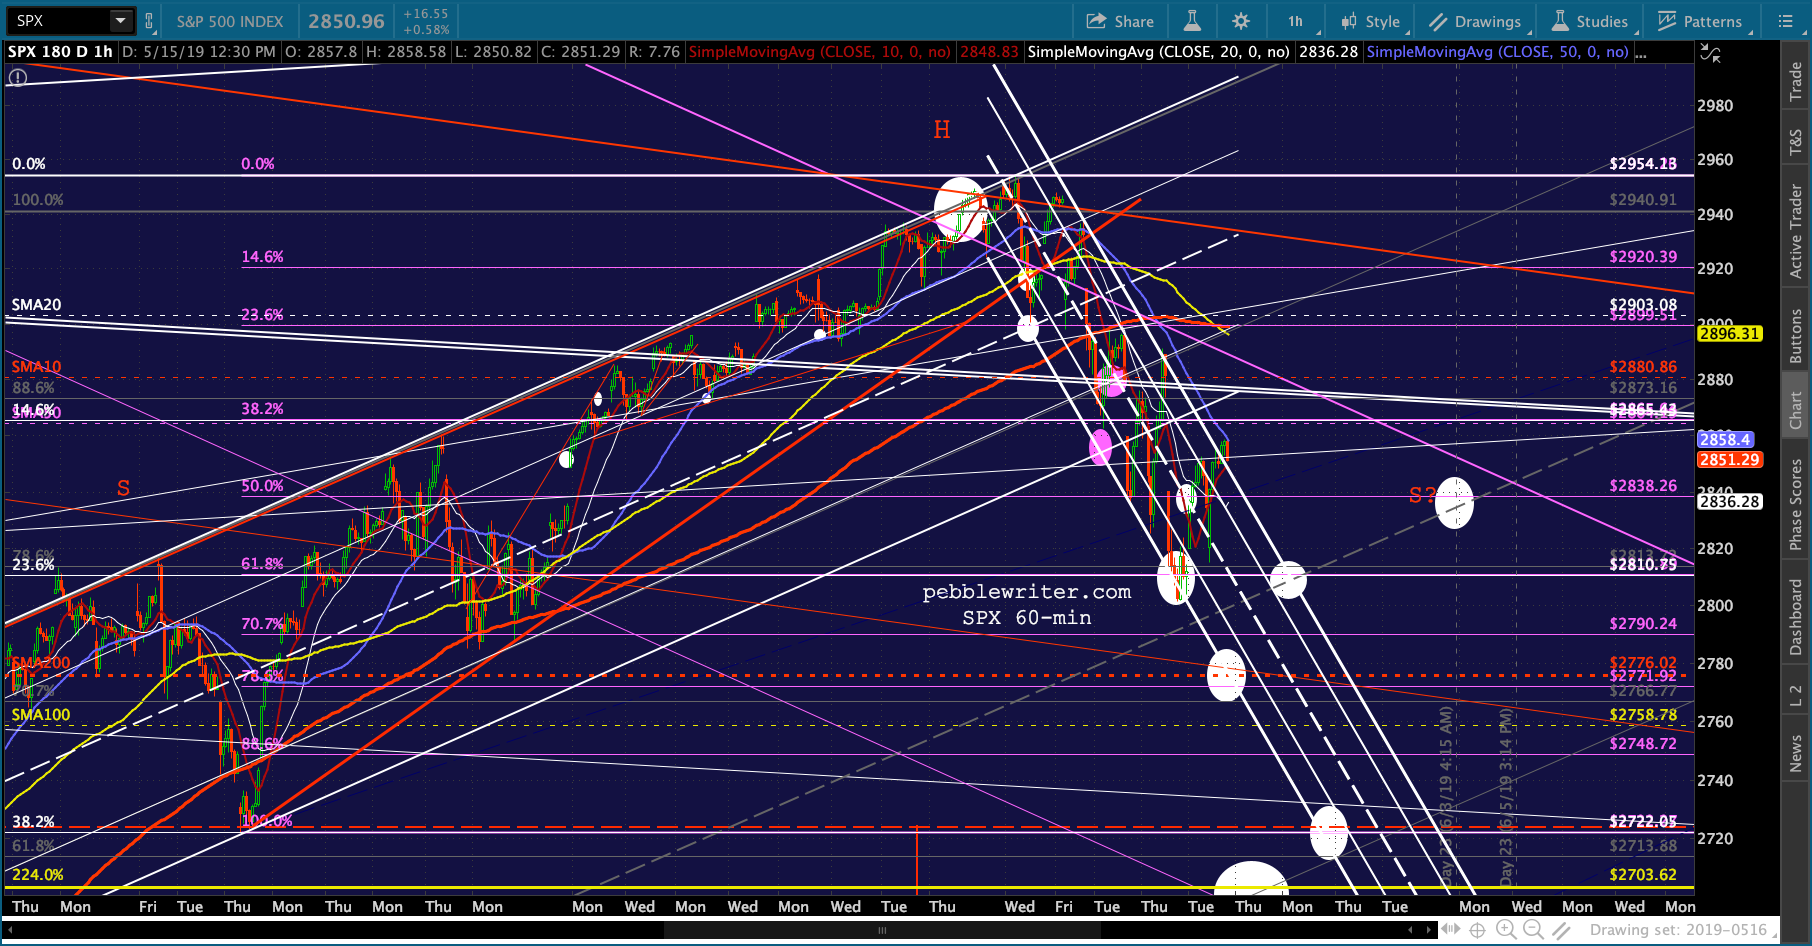 Everything is properly positioned to facilitate that decline as early as tomorrow morning.
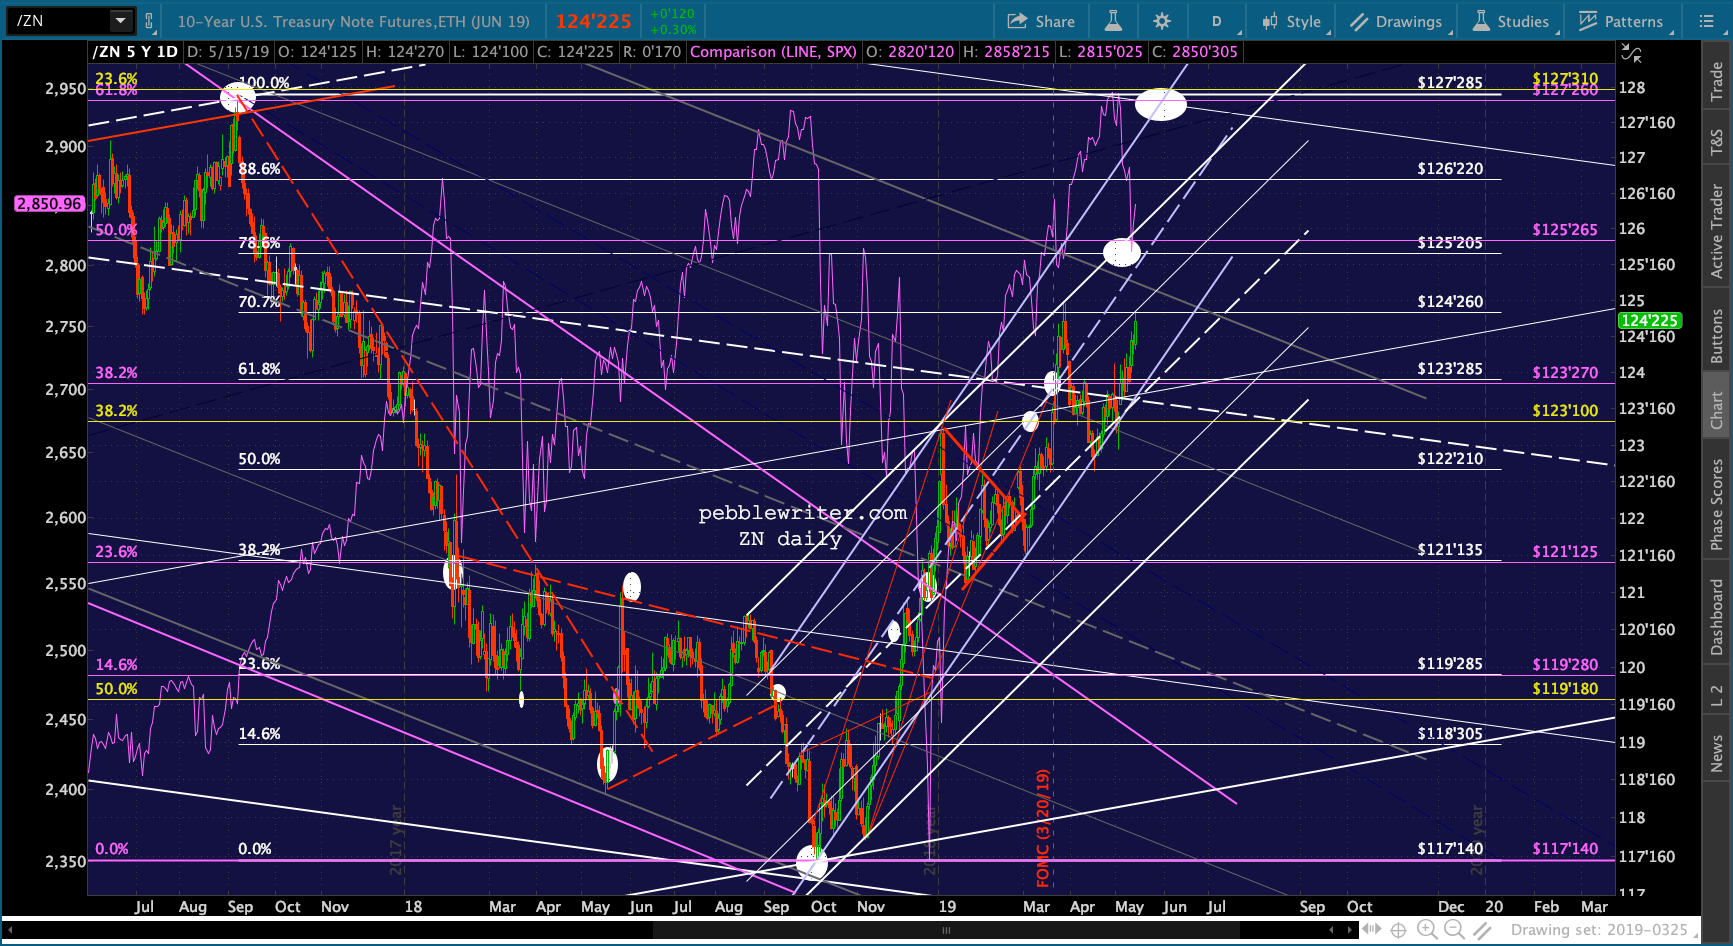


GLTA
Comments
One response to “Greatest Economy Ever?”
Excellent, thanks PW.