

As we wait for the broader indices to do a little fine tuning, it’s worth taking a quick look at some of the more bearish developments that probably weren’t part of the script.
First, AAPL broke down below its SMA200 yesterday to tag our 182.85 target. This, in addition to the channel breakdown, leaves it in a very precarious position. Only a single channel line stands in between it and another big drop. The only bounce which could save it at this point would be all the way back up past 193.
 Then there’s BA, whichh tagged our 337.46 target yesterday. This tested a very important trend line from Feb 11 2016 which, if broken, would open the door to a critically important test at 325.
 There other individual stocks worth watching. But, these are the two which deserve special scrutiny.
continued for members…
The bigger picture for both of the above. AAPL is relying on the purple .786 line to hold it aloft… …a very important assignment for such a meager tool.
 And, BA is completely at the mercy of the purple TL. A drop through it targets the rising white channel midline.
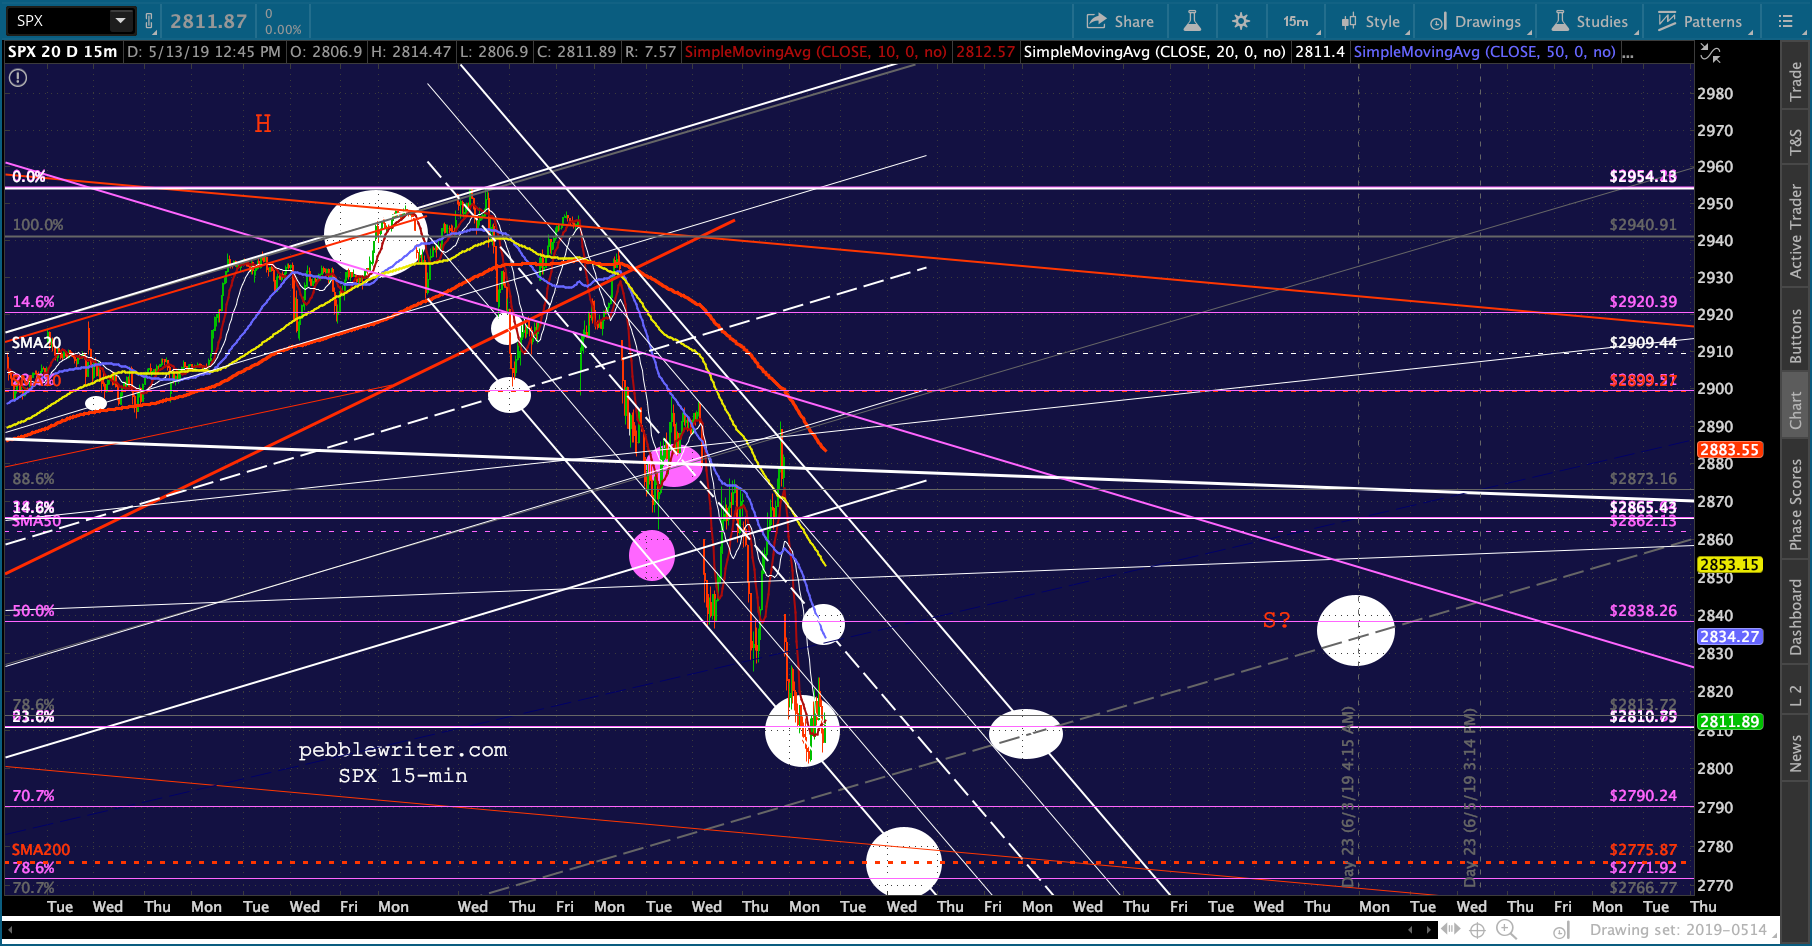
 As we discussed yesterday, ES and SPX should bounce and delay their SMA200 tags until tomorrow or even Thursday — though there are no guarantees.
 VIX has backtested two white midlines and has a cluster of moving averages around 17 if needed.
 USDJPY is backtesting its falling white channel — again, just to buy some time.
 DXY continues to hint at a drop to TL support…
 …while EURUSD remains essentially untradeable.
 As discussed yesterday, CL is likely dragging out another tag of its white midline until SPX/ES are ready to tag theirs — ideally on Thursday when it can do so without breaking below its SMA200 again.
RB continues to provide downside impetus…
 …while carefully avoiding dipping back into the channel from which it recently broke out. While the upcoming intersection of the SMA100 and 200 is appealing, it would likely produce too large a hit to inflation. So, I’d take a wait and see approach.
Meanwhile, bonds still spell trouble for stocks. The purple dots represent the 10Y’s targets, while the red dots represent a static spread between the 10Y and 2Y. In other words, the 2Y would have to drop that much in order to maintain its current spread.
Since it has already broken down, the bearish trigger has already occurred. This chart simply reinforces that fact. The 2s10s is still broken out following its backtest.
 I’m running out to a meeting, should be back around 2:30 or so.