

It just dawned on the futures that there’s a rate rise on tap at a very suboptimal time.
PPI just came in at 0.4% — much hotter than the 0.1 – 0.2 expected. Yet retail sales and industrial production were much worse than expected. It’s another reminder that we’re likely heading down a path to stagflation.
And, we still have the EIA inventory report (yesterday’s API report was horrid) and a rate hike ahead of us.
continued for members…
FOMC days have almost always been positive for stocks over the past few years — a combination of good news (no rate hike) and positive reinforcement (if we ramp stocks higher, investors will recognize the Fed’s doing the right thing.)
Last year’s December hike was no exception, though the days following it weren’t so pretty.
Today, we have drops in CL and USDJPY and a rise in VIX to start out. 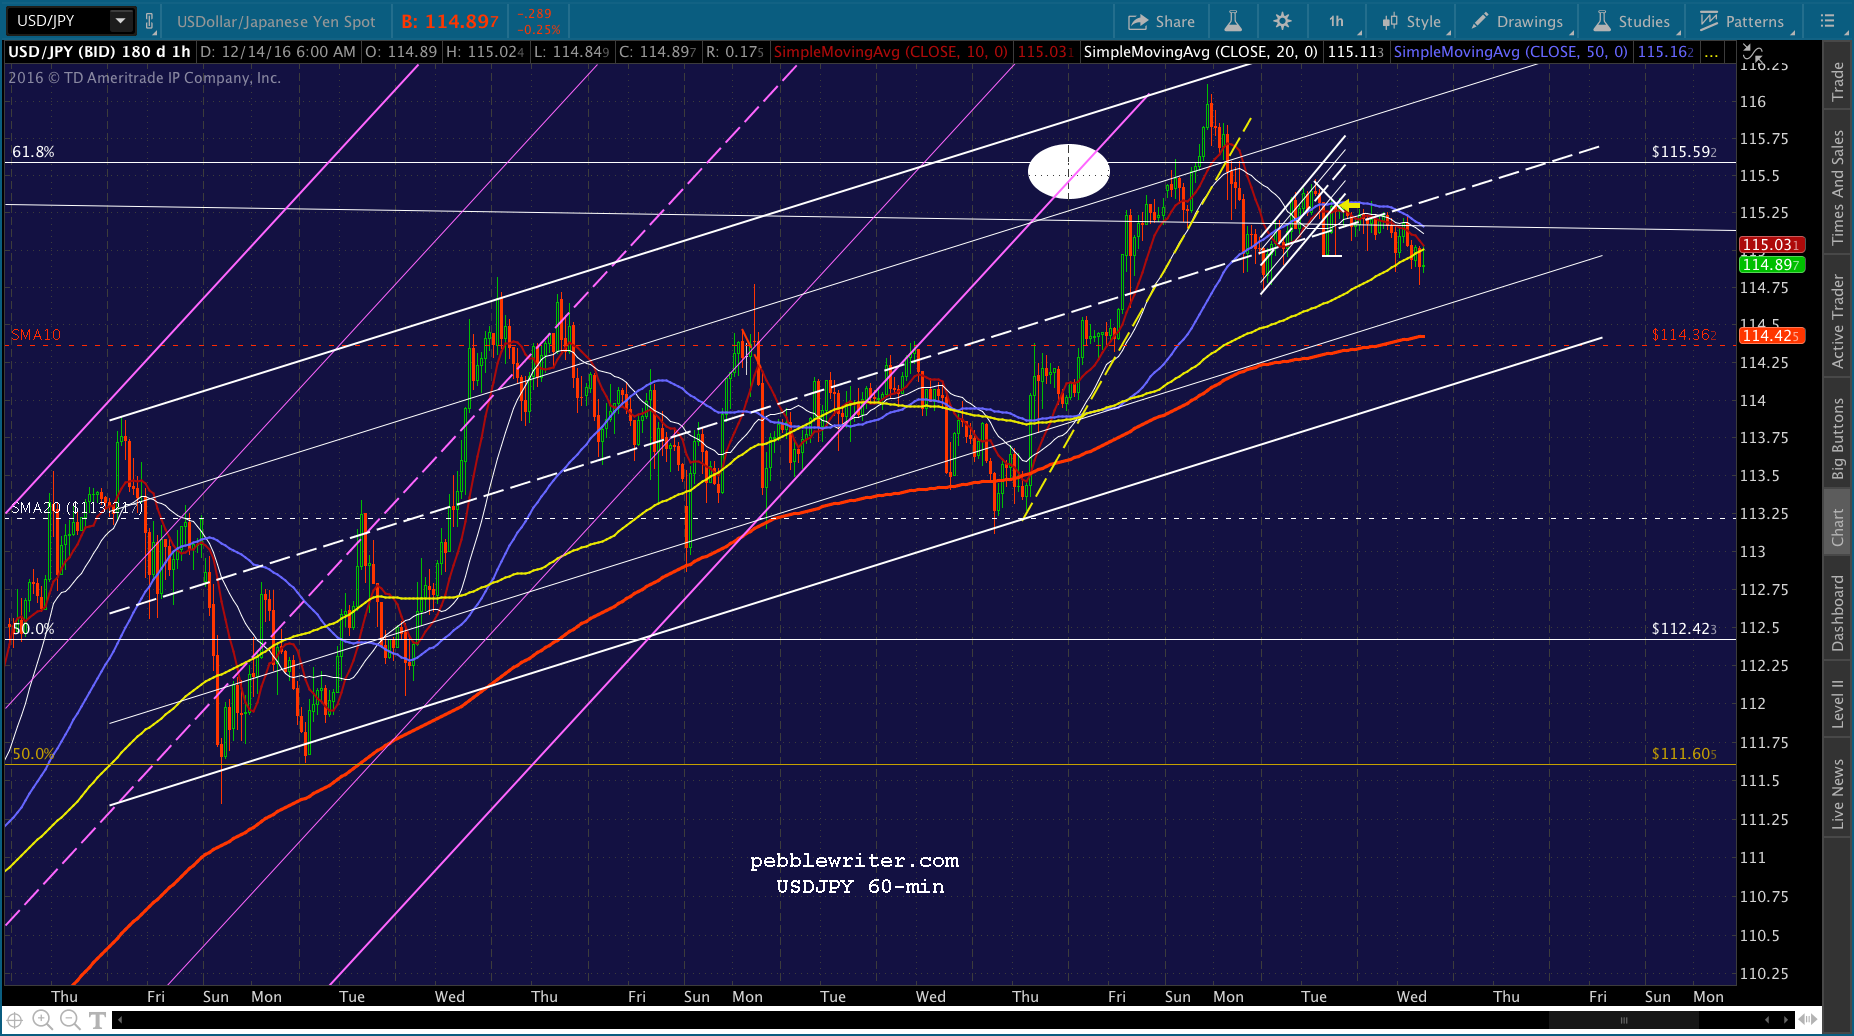

 The eminis are currently off about 4 points.

Our initial downside target for SPX remains a backtest of the 1.618 at 2261.80, followed by the purple channel line top at 2242 and the white channel top at 2210. The SMA10 is currently at 2227.45 and the SMA20 is at 2211.32. We remain short from 2274.19 yesterday afternoon.

My charts can get very busy. And, for new guys, it can be hard to get your bearings. So, here’s a clean view of the big picture. SPX has broken out of the flat white channel, but hasn’t come close to backtesting it.
Meanwhile, it has run into the rising yellow channel midline. It hasn’t been above the midline since last January, when it broke down after tagging the yellow 1.618 extension of the 1576 to 666 drop between 2007 and 2009.
The yellow channel goes back all the way to 2009, but that’s really a cheat of sorts. It doesn’t include the worst of the crash between Feb – Apr in 2009.
If we were to expand the channel to include that wreckage, it would look like the white channel below. More bearish, right? Look at all that empty space below the dashed white line that needs to be fleshed out.

However, if we strip away the yellow channel, we can see that SPX has bounced off the white channel midline practically every chance it had. The big exception was the drop below in 2011 when the BoJ responded by massively depreciating the yen from 75 to 125 per USD, thus creating the yen carry trade bonanza.
If SPX were to plunge straight to the white channel bottom today, it would mean 1700 — a drop of 25%. But, TPTB are clearly going to do everything they can to prevent that. It has had plenty of chances, but was very obviously supported at the 1.272 extension at 1823 — which is where it should have reversed back in Dec 2013 after completing the big Butterfly Pattern.
Instead, they broke the link between the EURUSD and stocks, interest rates and stocks and the USD and stocks. They followed this up with more yen depreciation.  And, when that ran out of headroom, they replaced it with CL appreciation.
After the US election, they combined CL appreciation with yen depreciation and VIX bashing to enable stocks to reach all-time highs.
It’s not sustainable, of course. First of all, the OPEC deal is mostly a sham. It calls for production cuts, but only to a level where things were already out of hand — and, that’s if every party abides by their promise, which has never happened before. And, of course, the economics of the deal assume that as prices rise, US and other non-OPEC producers will sit on their hands and hold production steady. Not likely.
Secondly, consider what the combination means for Japan. Post the election night lows, the yen depreciated 15% even as oil (priced in USD) appreciated 26%. That’s a massive price increase in energy for Japan, which imports essentially all of its energy needs. They might be able to keep this going until year end, in order to support stocks.
But, it will unwind. It must. With that kind of inflation, it’s no wonder that Japan had to intervene yesterday in its own bond market in order to get yields back down to 0%. For now, USDJPY and CL are both retreating from overhead resistance. Stay tuned…
I’m jumping on a conference call from 11:30 – 12:15 or so. I’d look for an opportunity to cover at SPX 2262, but stay short if it drops through that 1.618 extension.
UPDATE: 1:26 PM
SPX is slowly melting up, reaching a point where it will soon break out to positive territory.  The primary driver, so far, is USDJPY, which broke out of the falling white channel and is backtesting the white midline.
 Aside from that. CL has shed 2.3% so far in spite of an EIA report that was much more bullish than yesterday’s IPA. Note that it is headed straight for its SMA10 at 51.38 where it has channel midline and Fib fan support.
 And, VIX was up over 4% to the rising white midline, only to fall back over the past 5-10 minutes.
UPDATE: 2:04 PM
Pretty muted response to the FOMC decision, so far. USDJPY is spiking higher…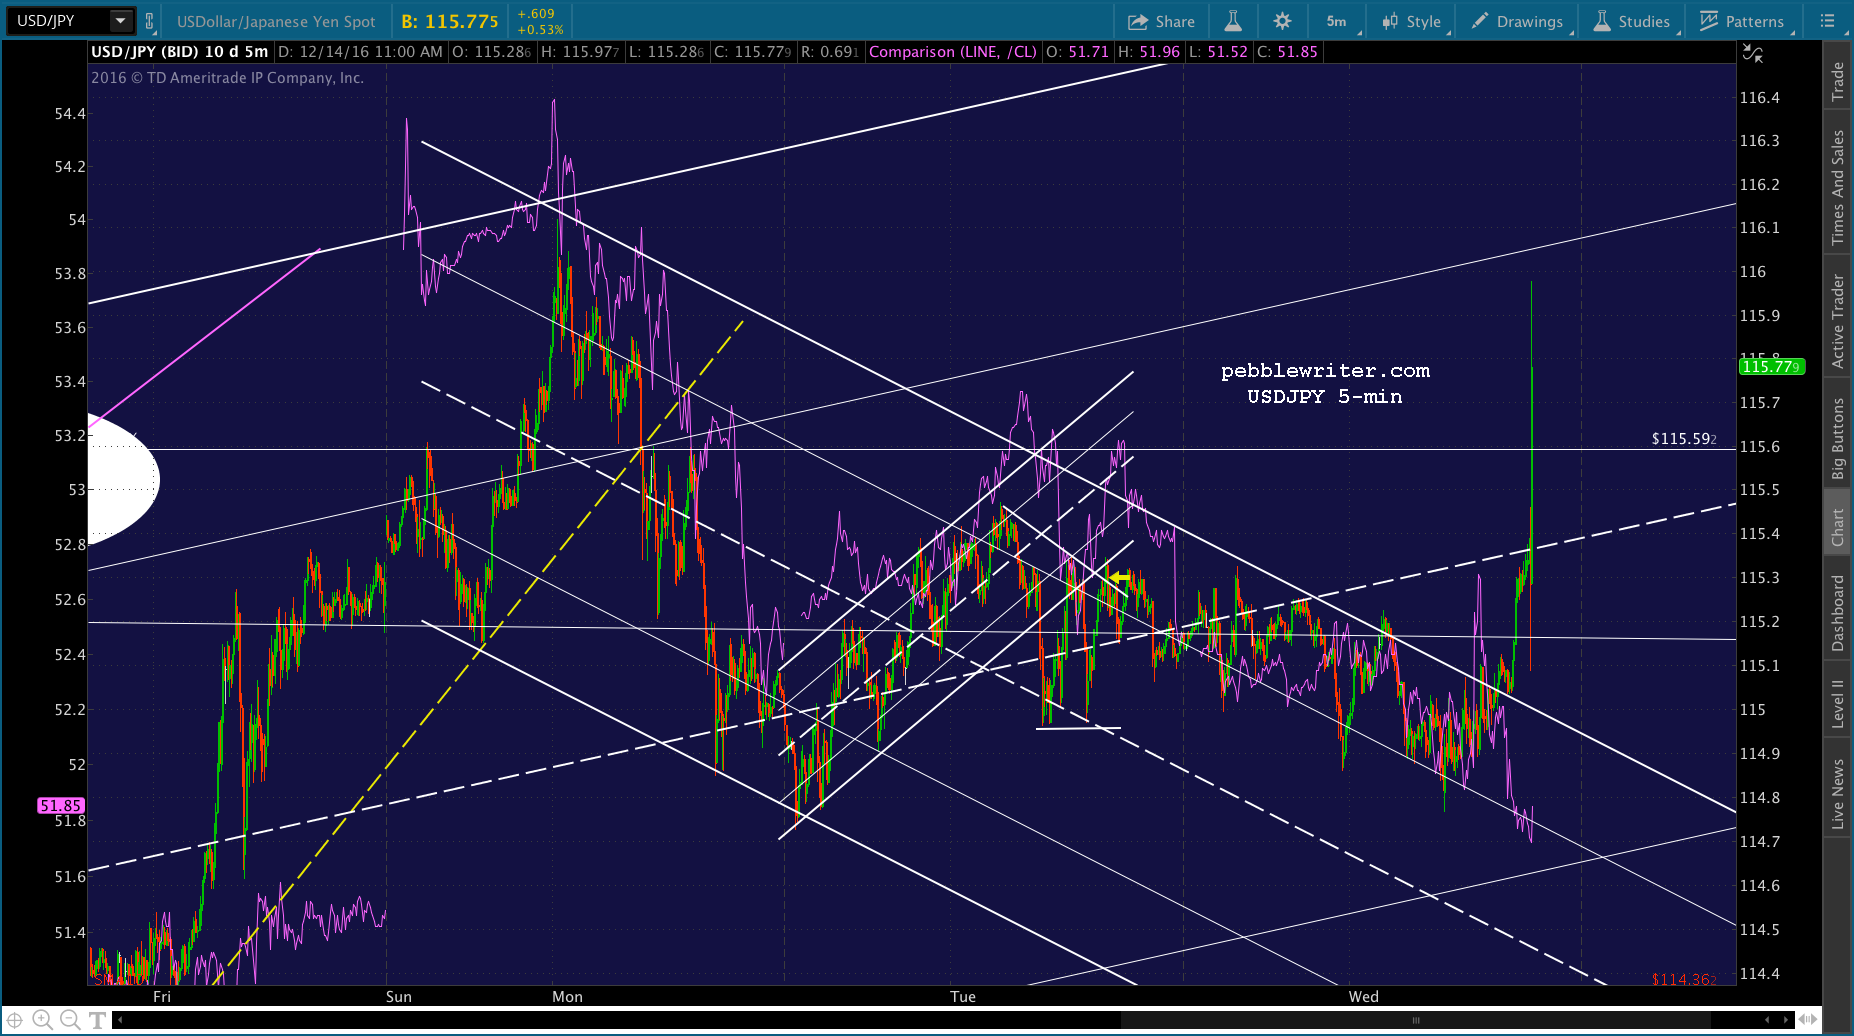
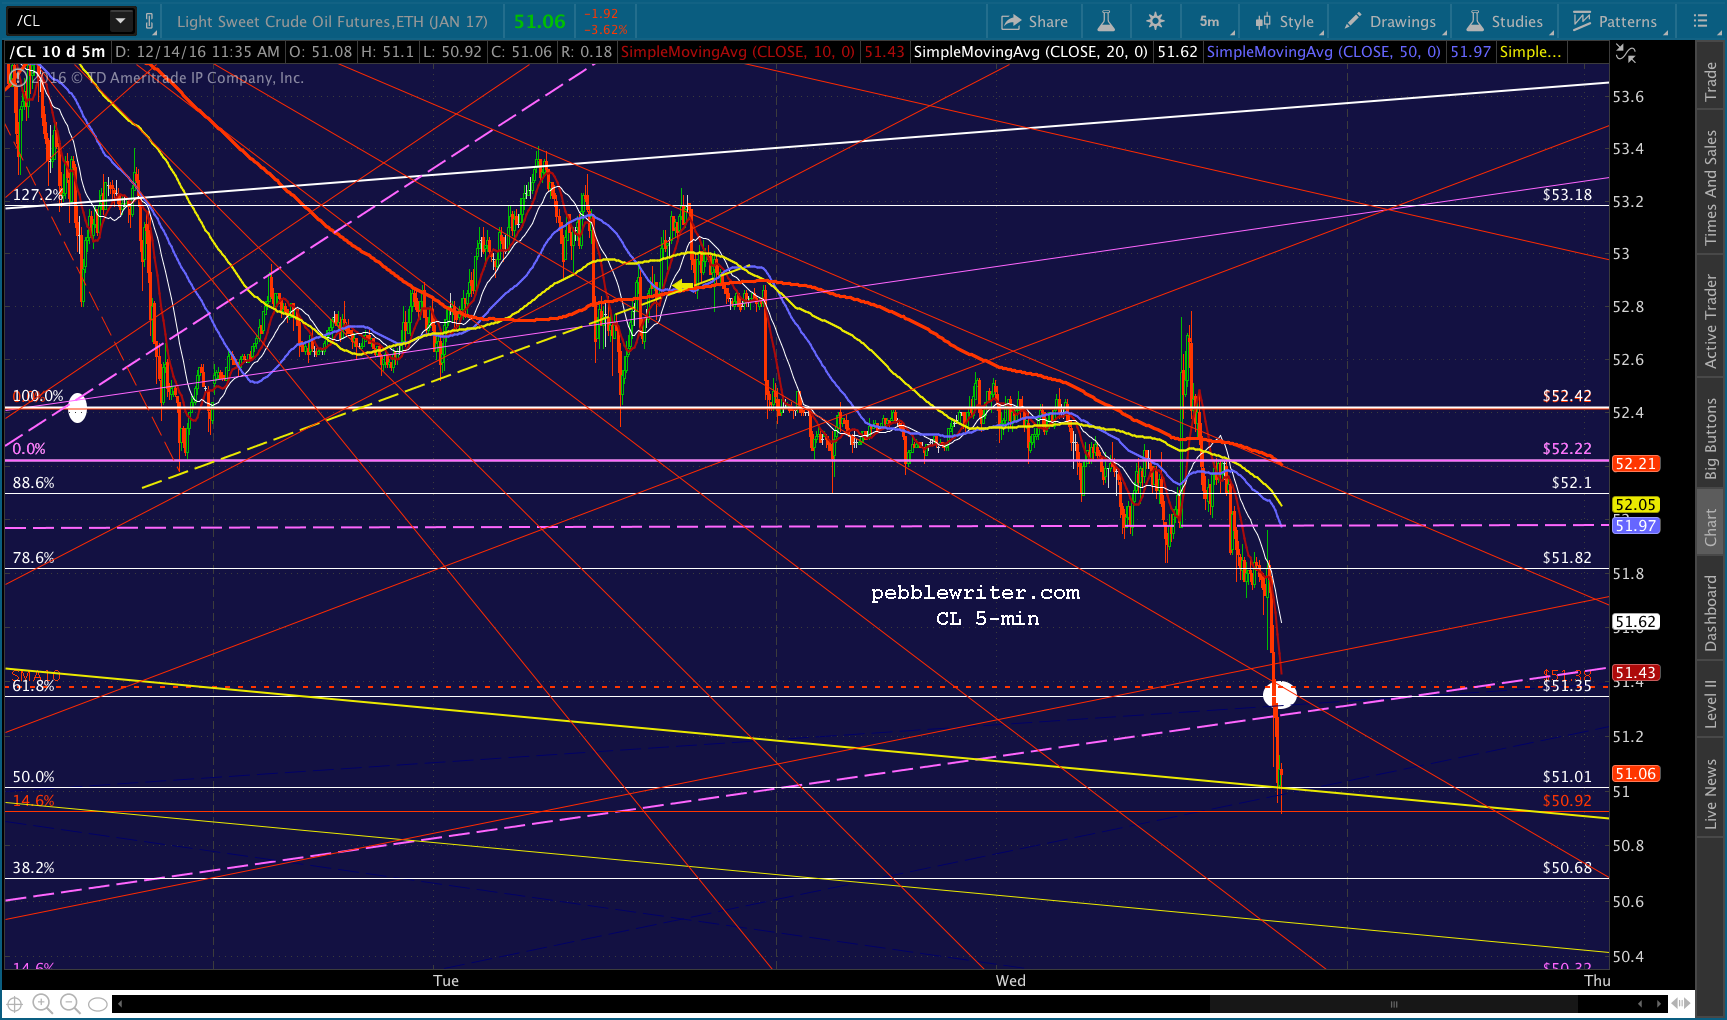
…CL is going nowhere…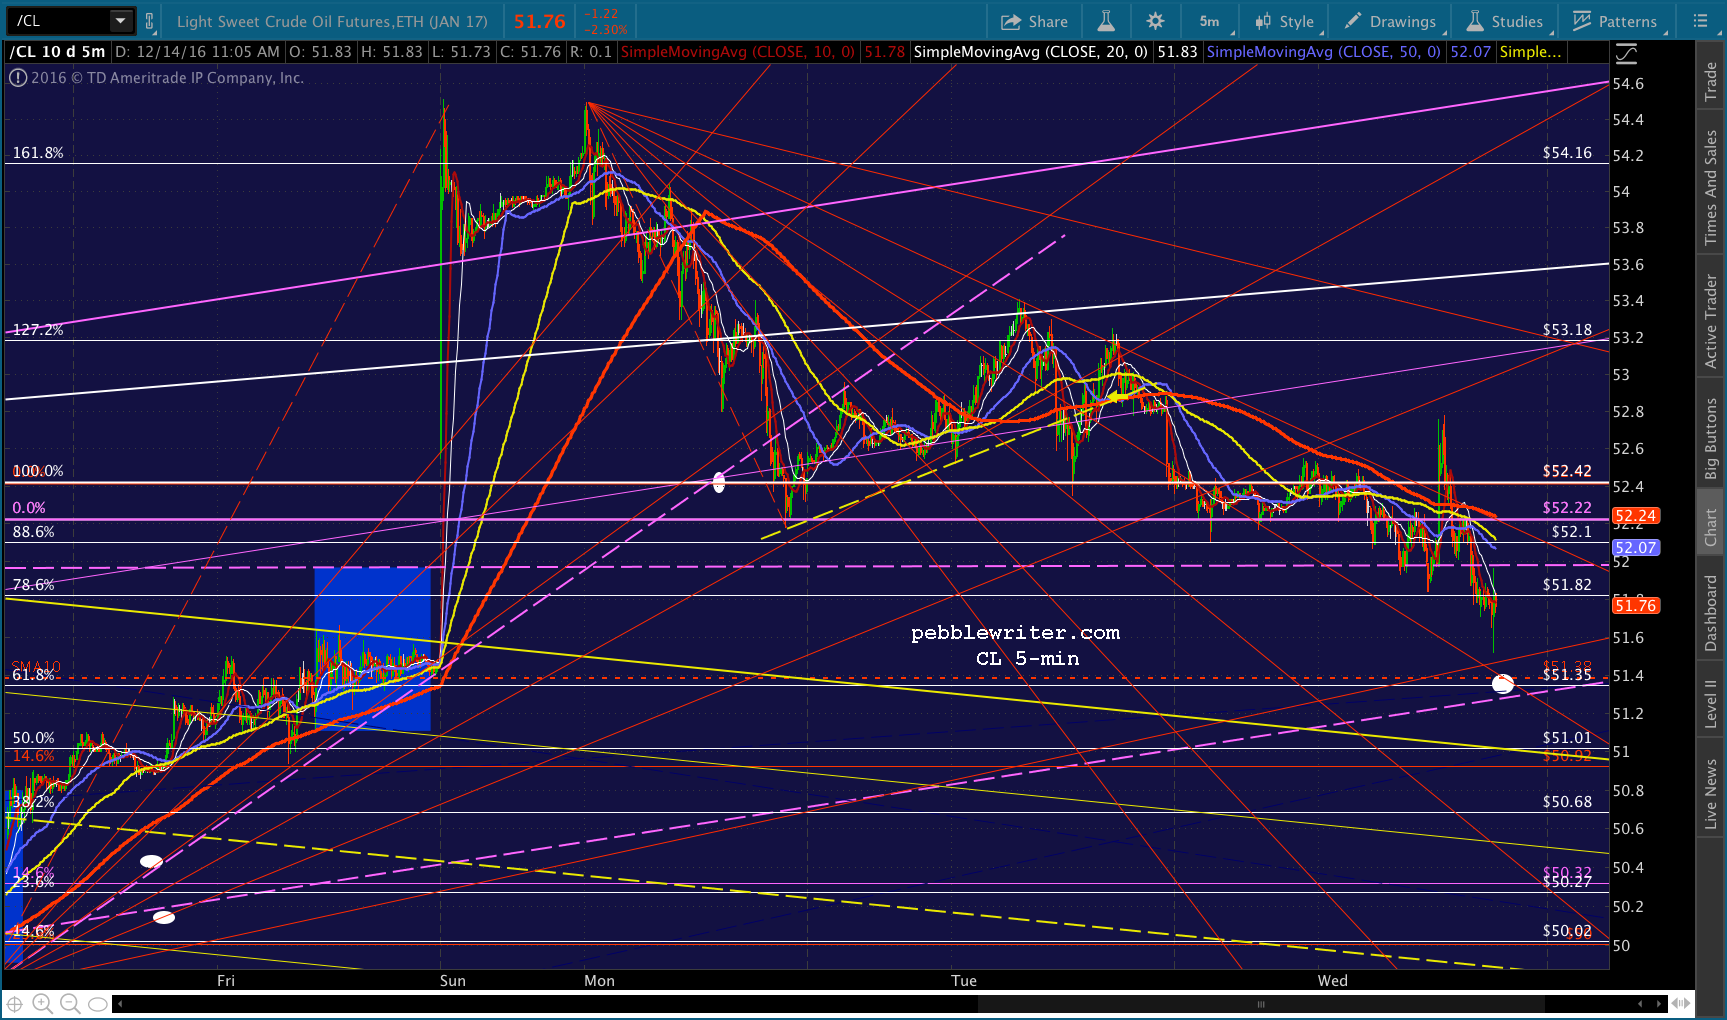 …and, VIX is choppy.
SPX is slipping higher, but not convincingly as yet.
UPDATE: 2:30 PM
I’d cover here at 2257.32. CL just reached support, which should help SPX find its legs. I’d be happy to short again if it drops through this level.


UPDATE: 2:35 PM
CL’s bounce is fizzling, and SPX just backtested the falling white channel bottom and rising white channel top.. I’d revert to short here at 2262.66 with stops at the SMA5 200 at 2267ish. If SPX is going to pull an algo move with USDJPY, CL or VIX help, it should happen when the SMA5 10 reaches the SMA5 200. Especially watch VIX for signs of a smack down to below 12.72.

Note that USDJPY is losing momentum.
UPDATE: 3:13 PM
Making good progress toward the purple channel top, currently about 2242. We’ll almost certainly need to see VIX break out and top the midline at 13.28 in order for that target to be hit.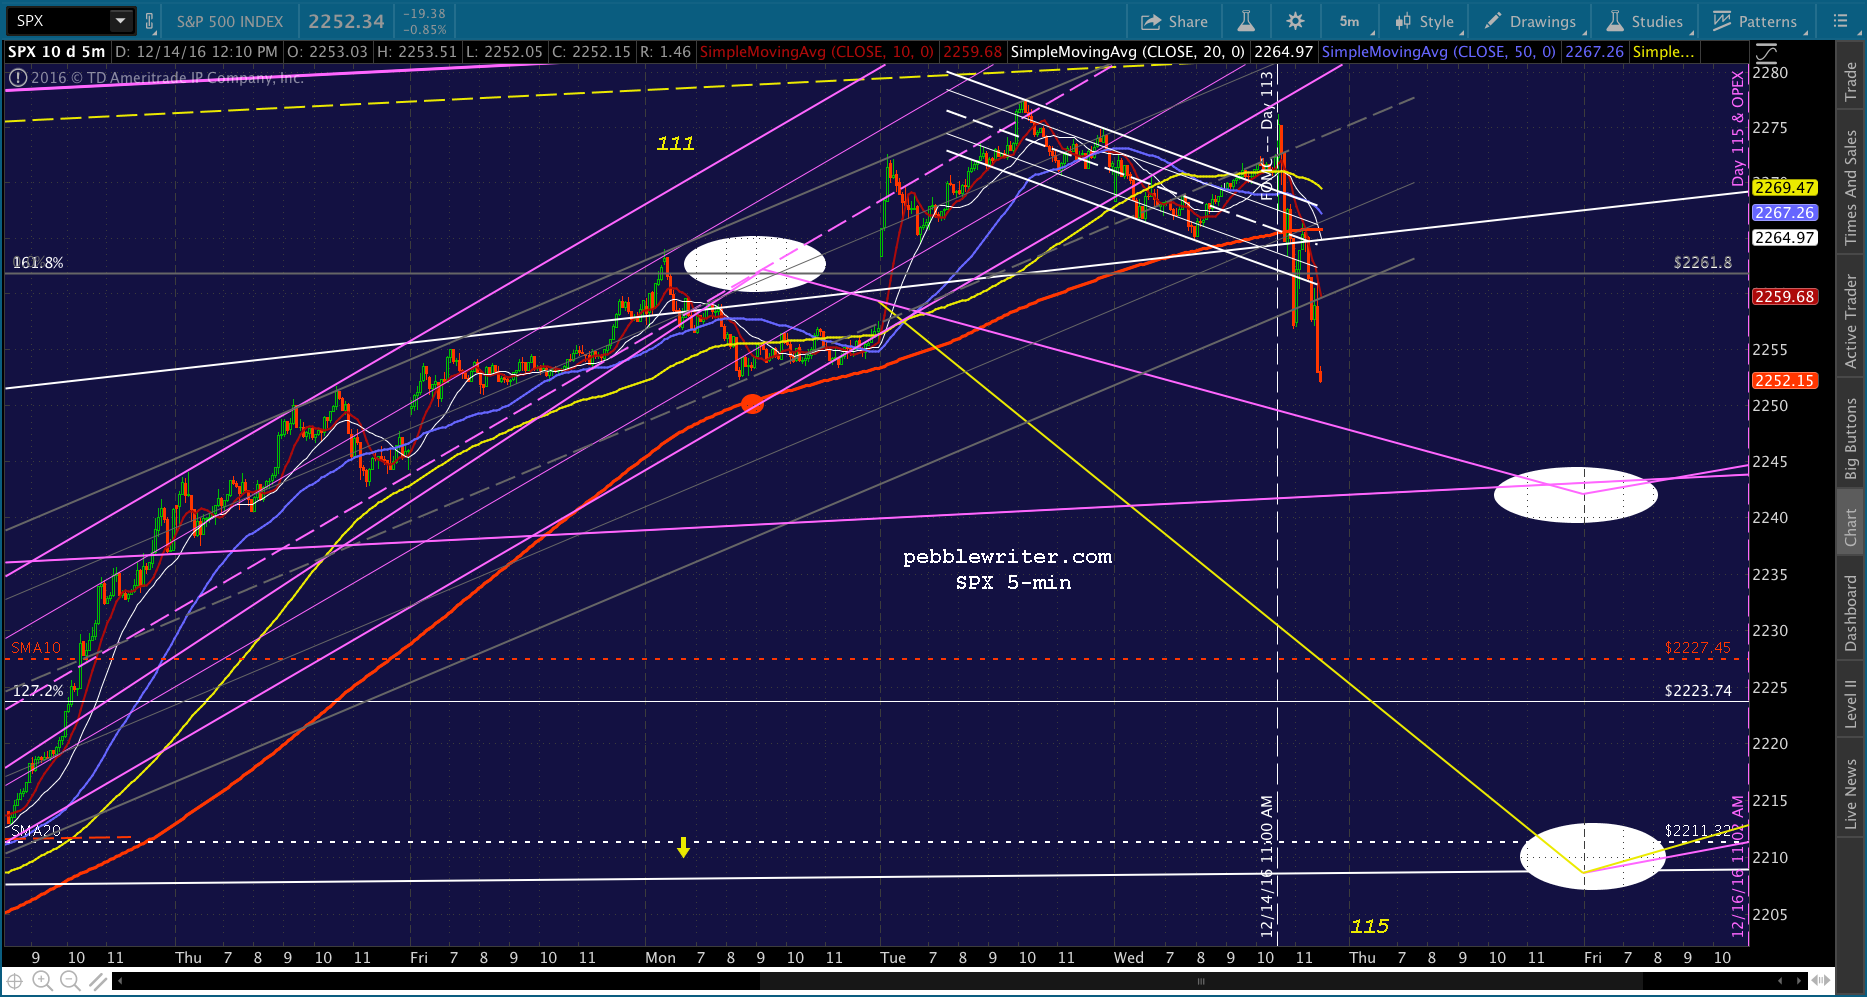

Note that USDJPY has also reached resistance at the white channel top.
UPDATE: 3:32 PM
VIX is moving back down through the midline, and USDJPY is breaking out further. We should get a bounce here as SPX is down about 1%. Probably a good idea to cover if it moves above the SMA5 10.


UPDATE: 3:41 PM
SPX has backtested the white channel top. I’d reshort here with tight stops. Might be a little early, as the SMA5 200 is just above. However, we already backtested it. So, hopefully not an issue. VIX has backtested the SMA10 again — the third time today. There’s a risk that it falls to flesh out the channel bottom, so watch your stops if it gets hammered again.


UPDATE: 3:57 PM
No question that CL’s weakness could be a problem going forward — even as USDJPY ramps higher. VIX appears likely to break out. As always, hold short only if you’re able to hedge or can handle the prospect of an overnight recovery. If it reaches 2242 right at the close, I’d reconsider, as that’s where we have a very good chance of a bounce.
Comments
One response to “FOMC Day: Dec 14, 2016”
Amazing how they are able to suppress volatility when prices are all over the place. It must be the only place TPTB can try to stabilize things.