One of the many wild cards in trading is the tension between the cash markets and the futures. SPX, for instance, already came within 4 points of our downside target at 3854.90 – which was 20% off the Jan 4 highs. But 20% off for ES means 3846.60 – 8 1/2 points below the lows it registered last week.
The upshot is that while SPX came reasonably close to a bounce spot, ES was a little further away. This raises the prospect of an after-hours “do over” where ES gets the chance to tag some solid support.
If the tag comes during trading hours with SPX dropping through its support, things could get even uglier than we saw yesterday.
continued for members…NOTE: I found an error in the ES chart earlier. The 20% off mark at 3769.40 was erroneously left on the chart from last November when the high had been 4711.75. The actual high on Jan 4 was 4808.25, yielding a 20% off mark at 3846.60. This actually helps the forecast, as the SPX and ES marks are much closer to one another.
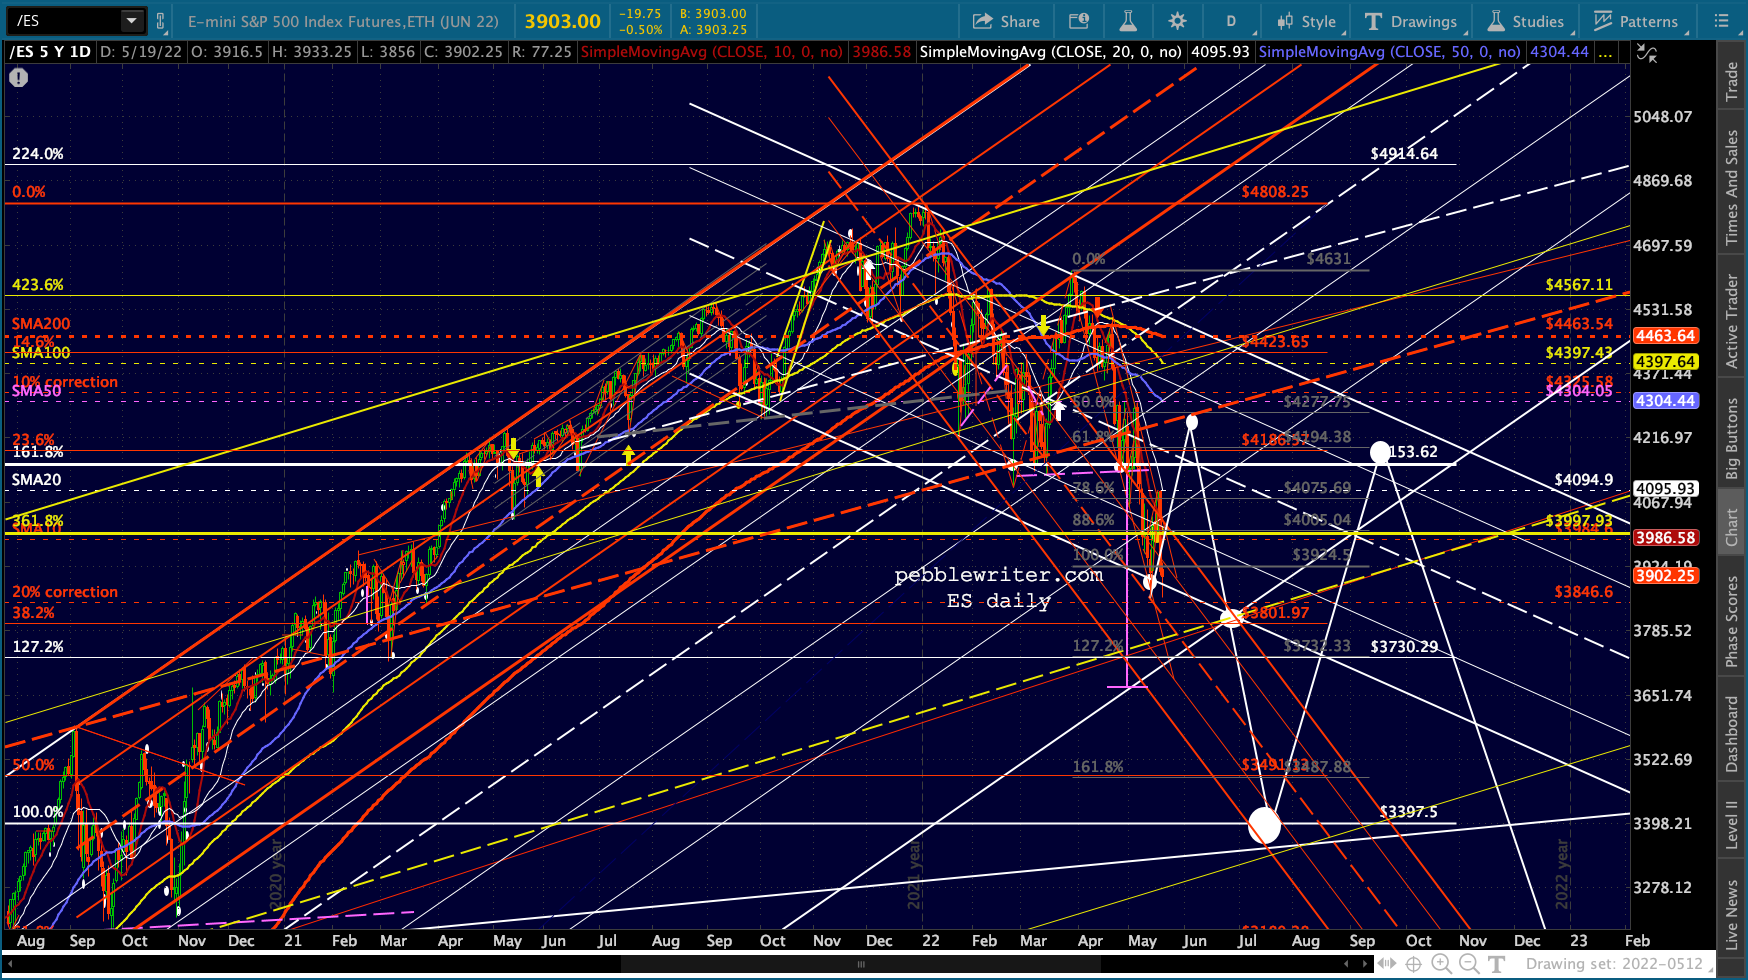
In 2000, the initial leg down for SPX was 19.3%. The the fact that SPX has fallen 19.9% (19.8% for ES) so far reinforces the importance of these levels holding – at least in terms of the analog’s accuracy. I also redrew the analog’s path for ES, reflecting the 3397 target for Jul 19.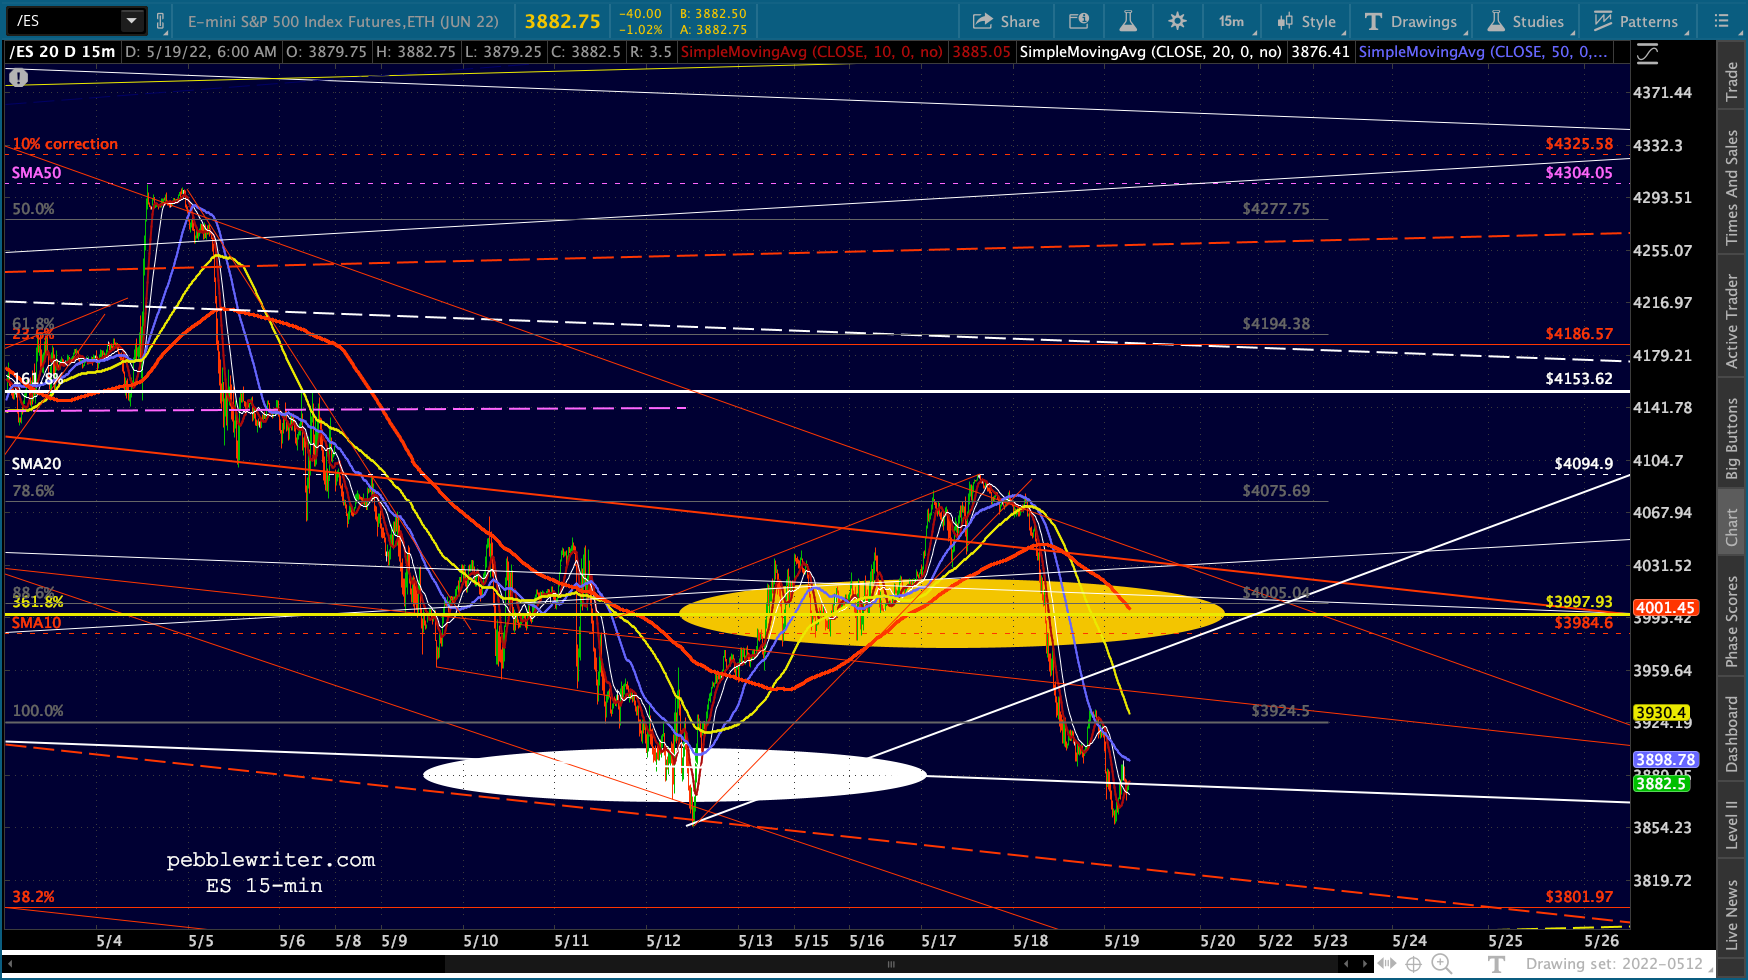
 SPX does have some room to drop before breaking down. The .886 is a reasonable retracement and wouldn’t alarm anyone. If it fell further, it still has the purple .618 to catch it.
 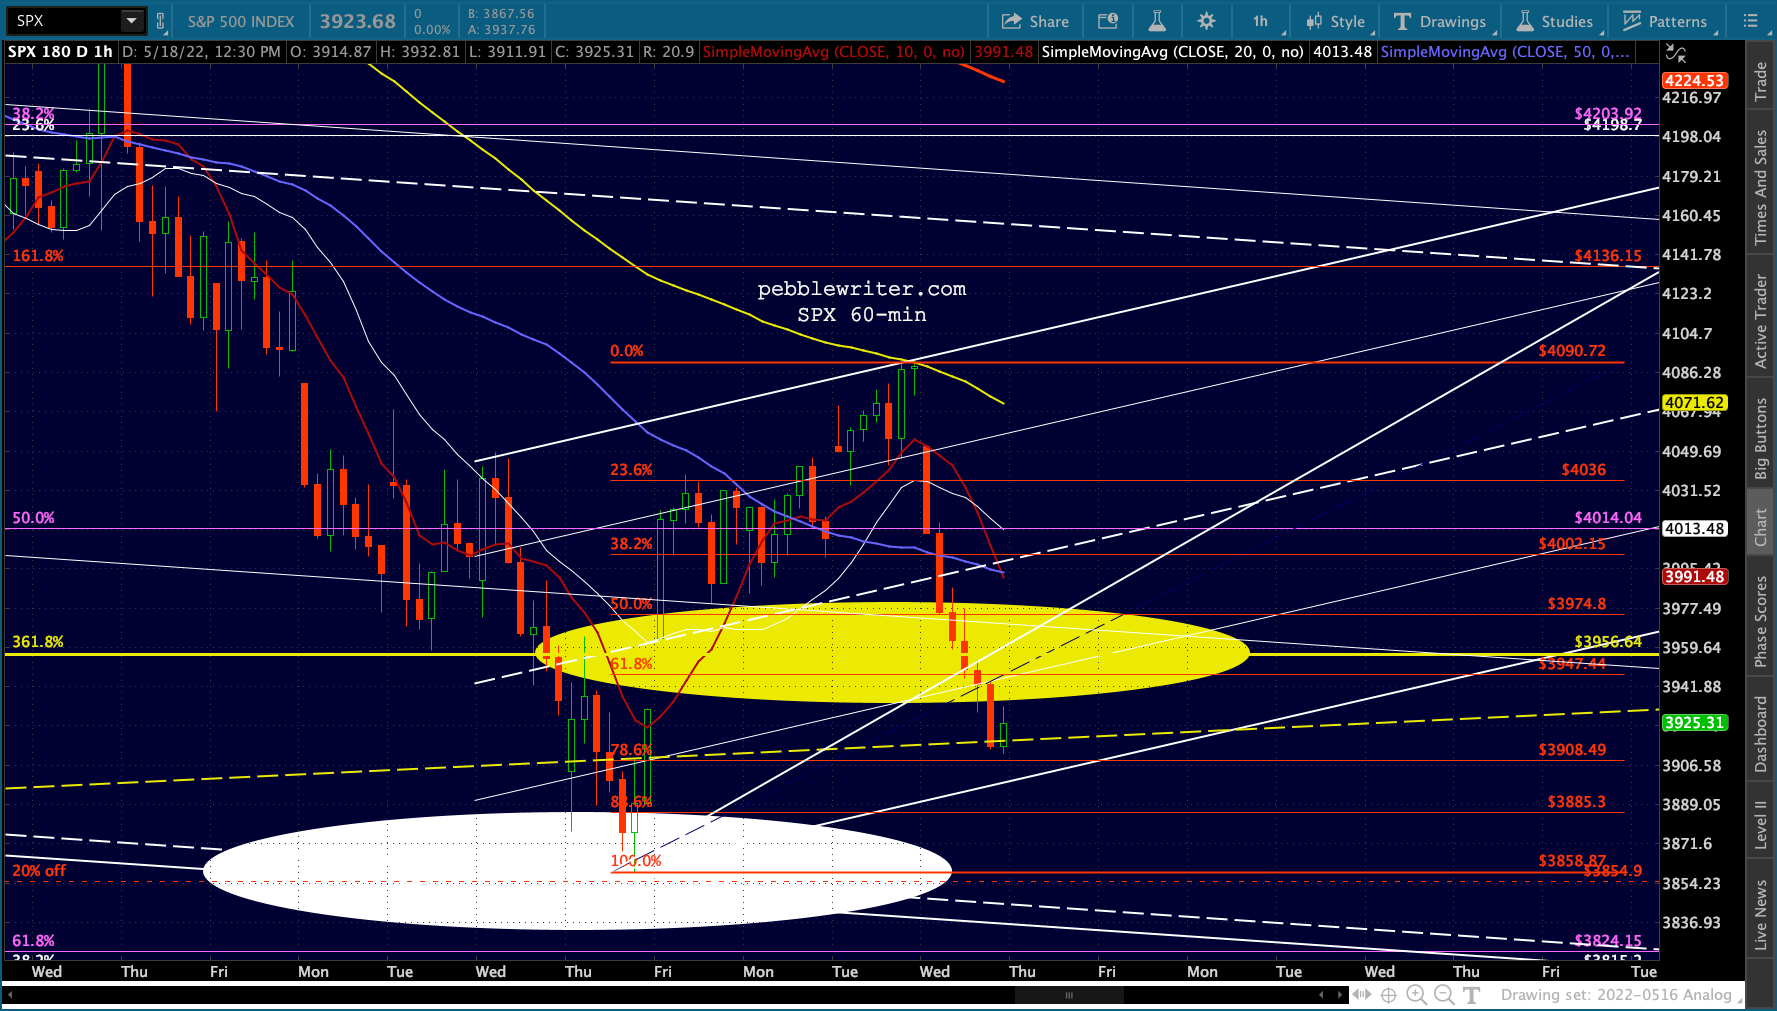 It would potentially disrupt the analog, but at this point the market is in desperate need of a reason to rally.
 VIX continues to be a very solid clue. Not even yesterday’s bloodbath was able to effect a breakout for the “fear” index.
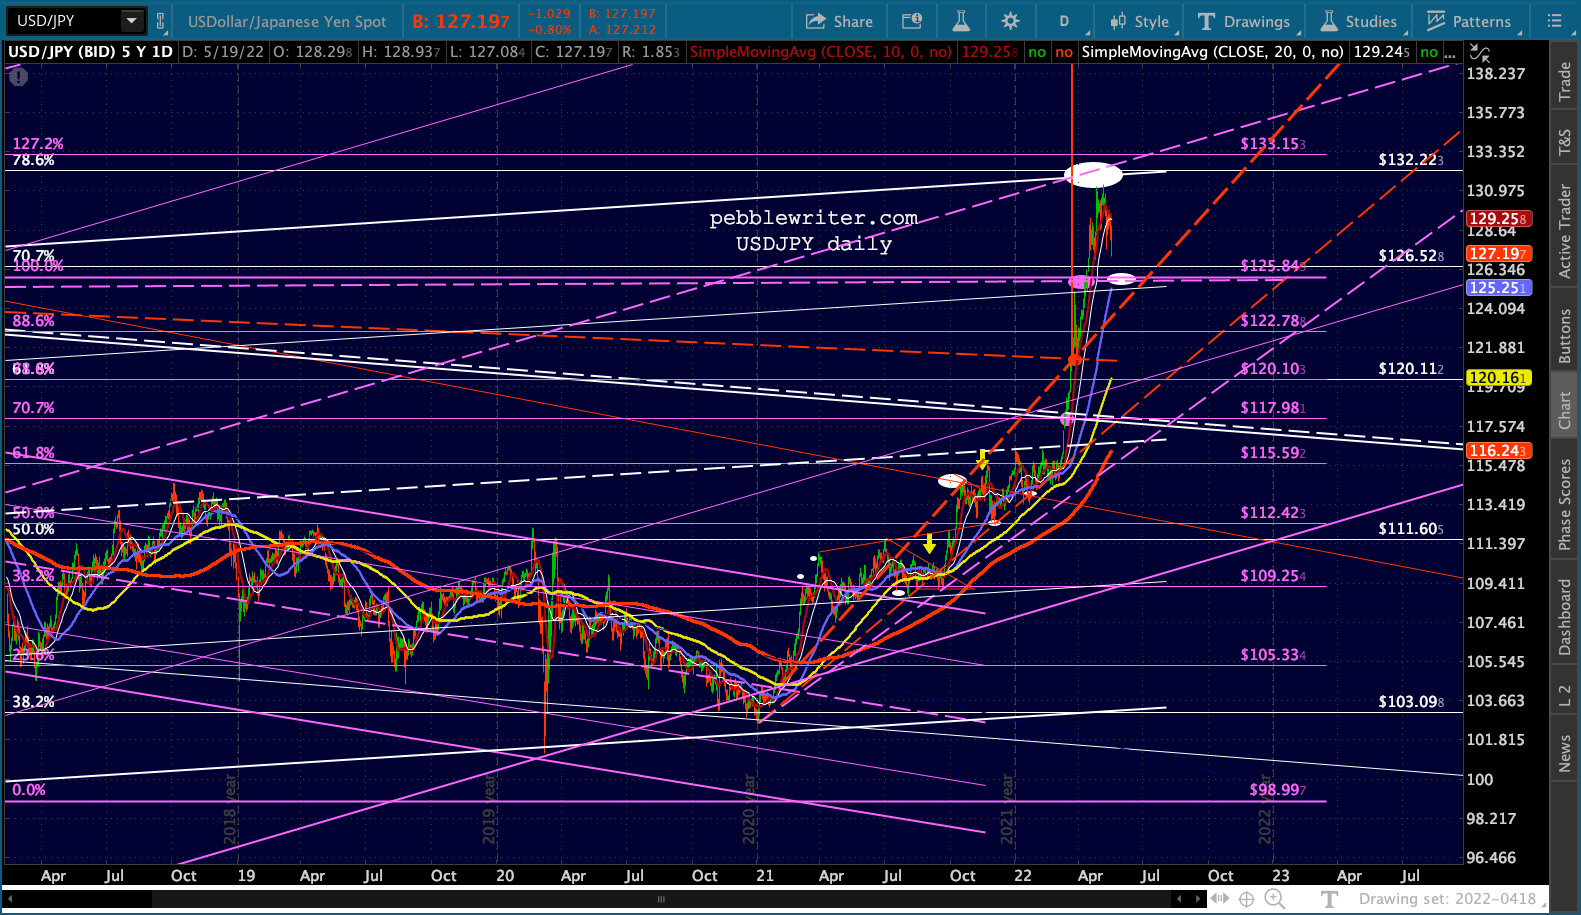
 In currencies, DXY is almost certain to reach 102.979 today, with a good possibility that it will break down and seek out 101.797 if EURUSD does, indeed, backtest its former low at 1.0635 again.
  EURUSD’s SMA20, however, has proven to be good resistance for the past 6 weeks.
 Gold is trying to push above its SMA200 and backtest the red TL from Aug 9.
 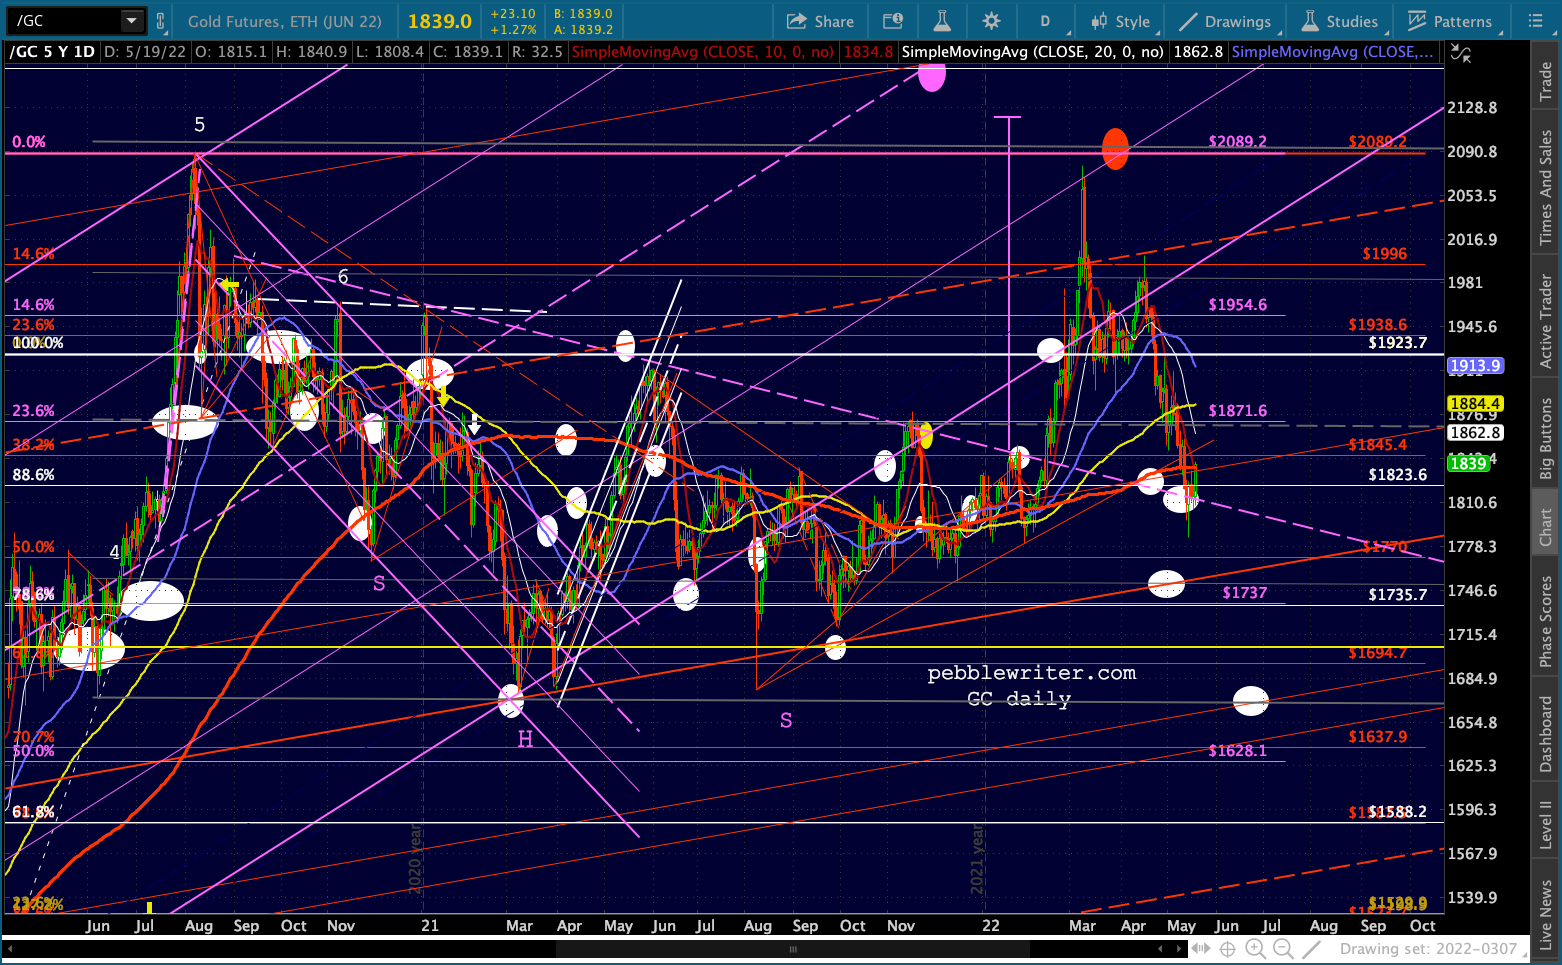 While SI is making a nice move back above its SMA10 and flag pattern bottom.
 BTC seems quite content at its .618 – the 9th session at or near the mark.
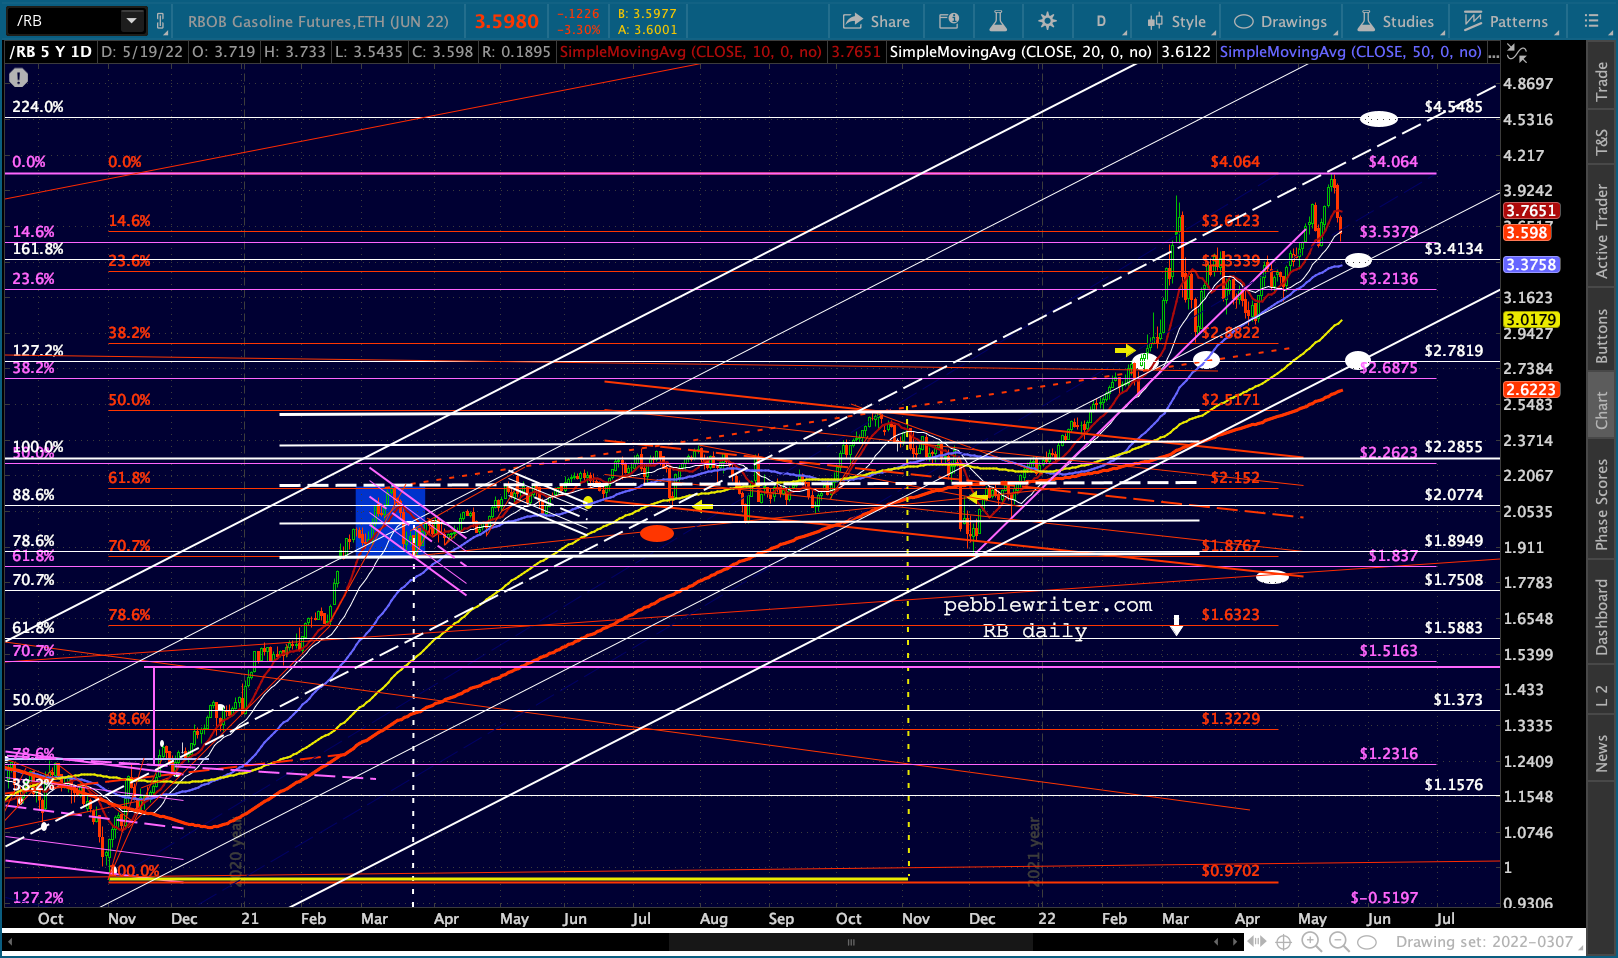
 CL and RB are both off again today. The algos aren’t really sure what to make of it – bullish as it helps tame inflation or bearish as they are normally correlated with stocks.
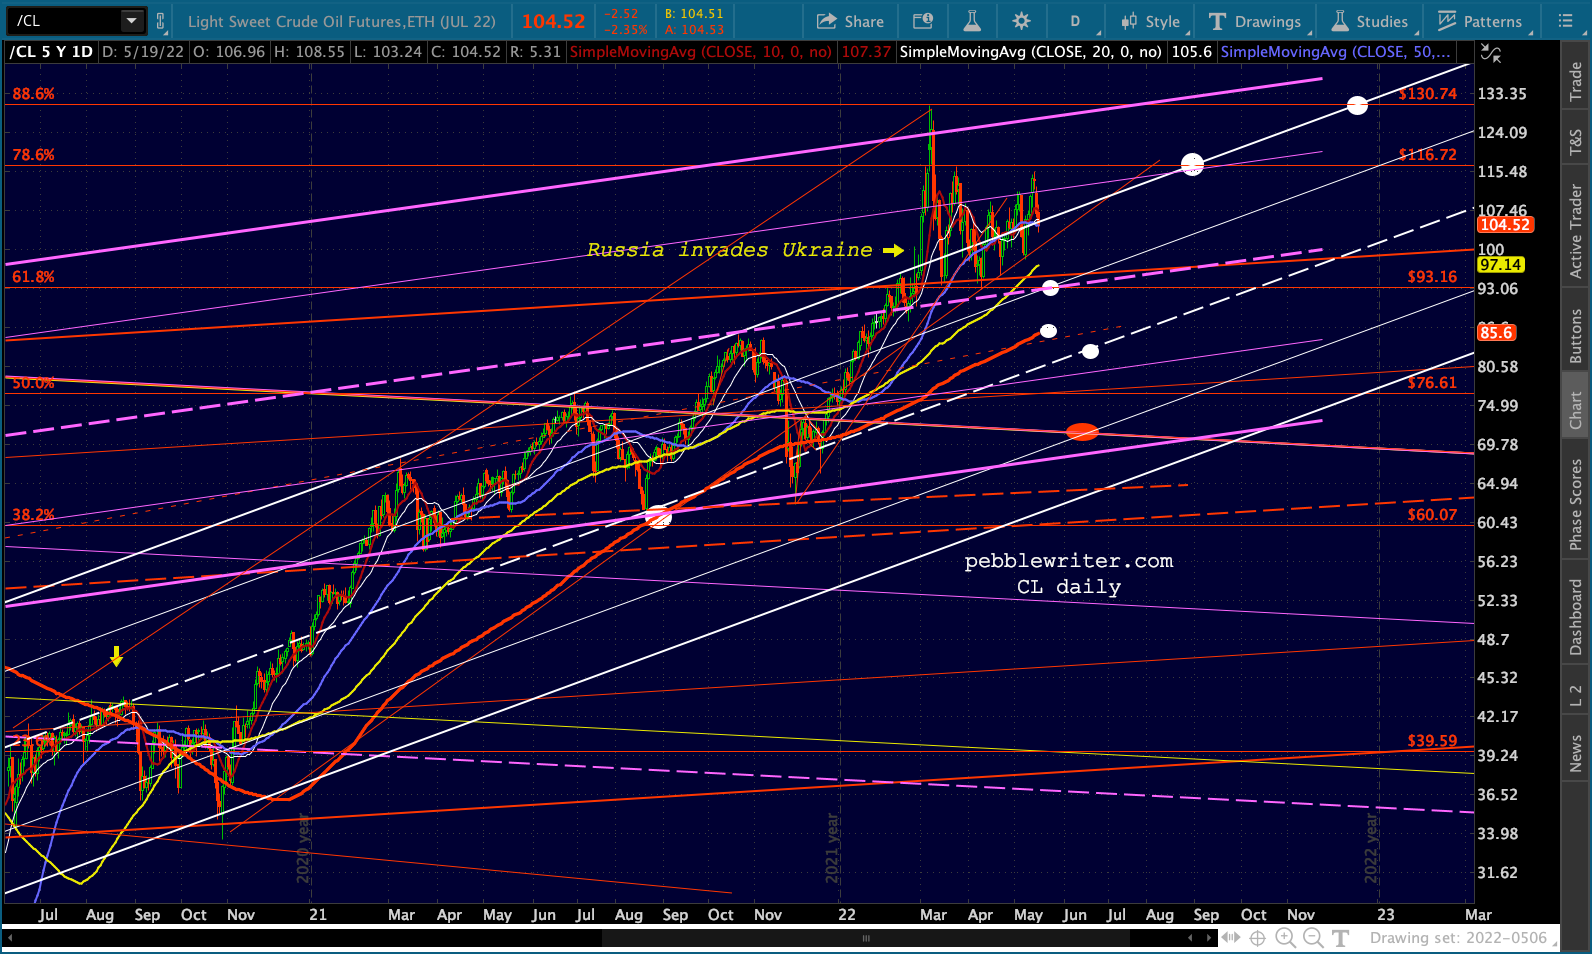
 With more and more stories about Putin’s rumored health issues, a path to deescalation in Ukraine has suddenly popped up on everyone’s radar.
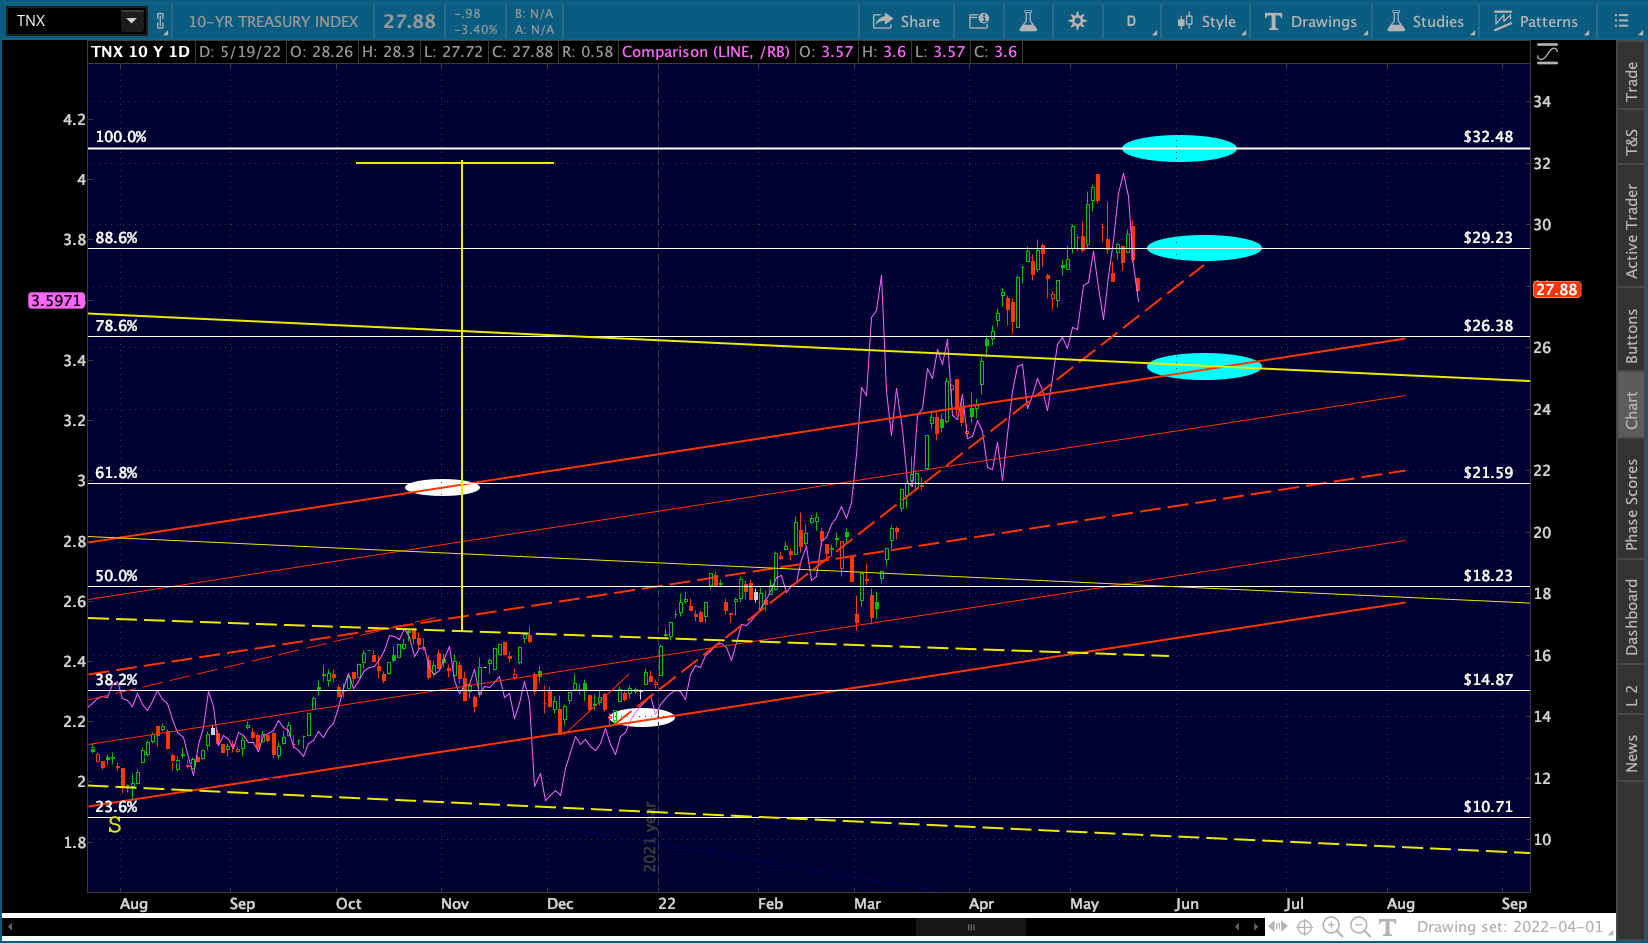
In any case, it takes a little pressure off the 10Y – as does a really scary stock market.  Important support is coming up fast.