

Yesterday’s downside targets remain in place.
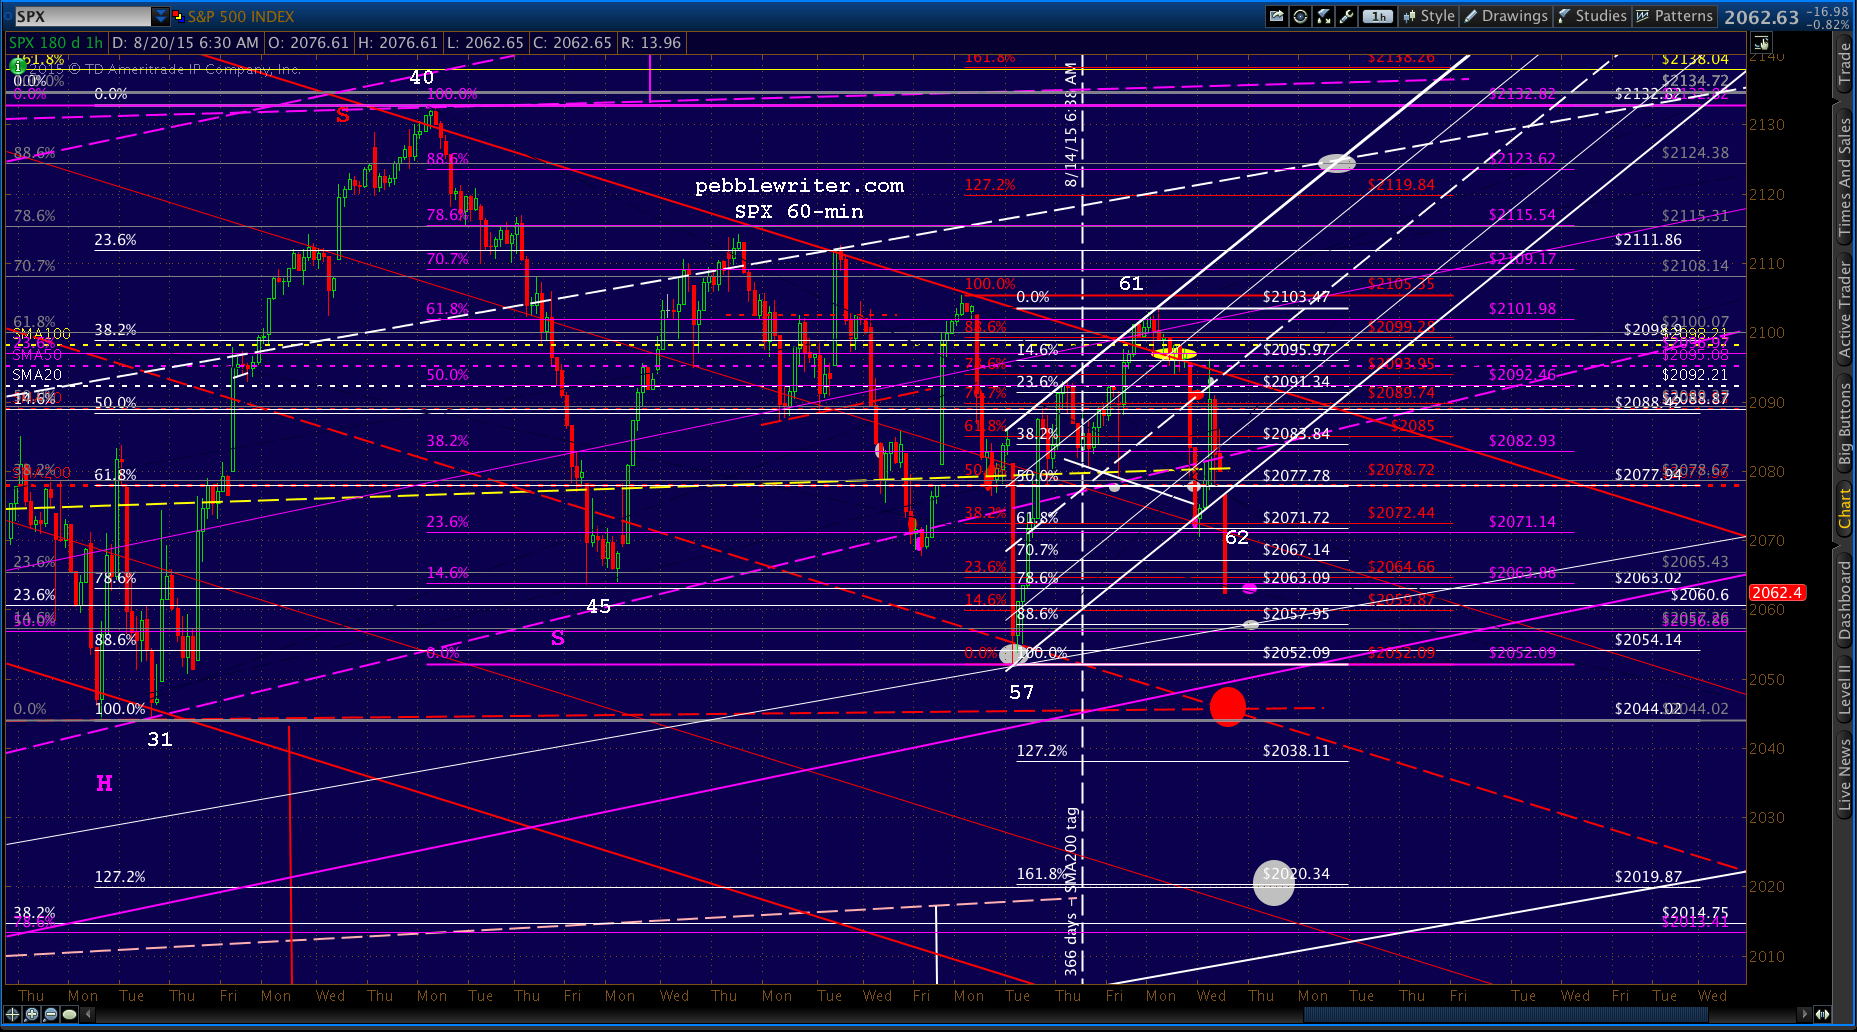
When SPX spiked higher last week, the steep white channel it followed seemed a bit overdone — to the point where it led to a false red channel breakout on Monday. We were left to wonder whether the Butterfly Pattern set up by the Jul 27 dip would be one more casualty of the PPT. If so, the analog we’ve been watching for the past 5 months was in serious jeopardy. Now, it appears those fear may have been misplaced.
continued for members…
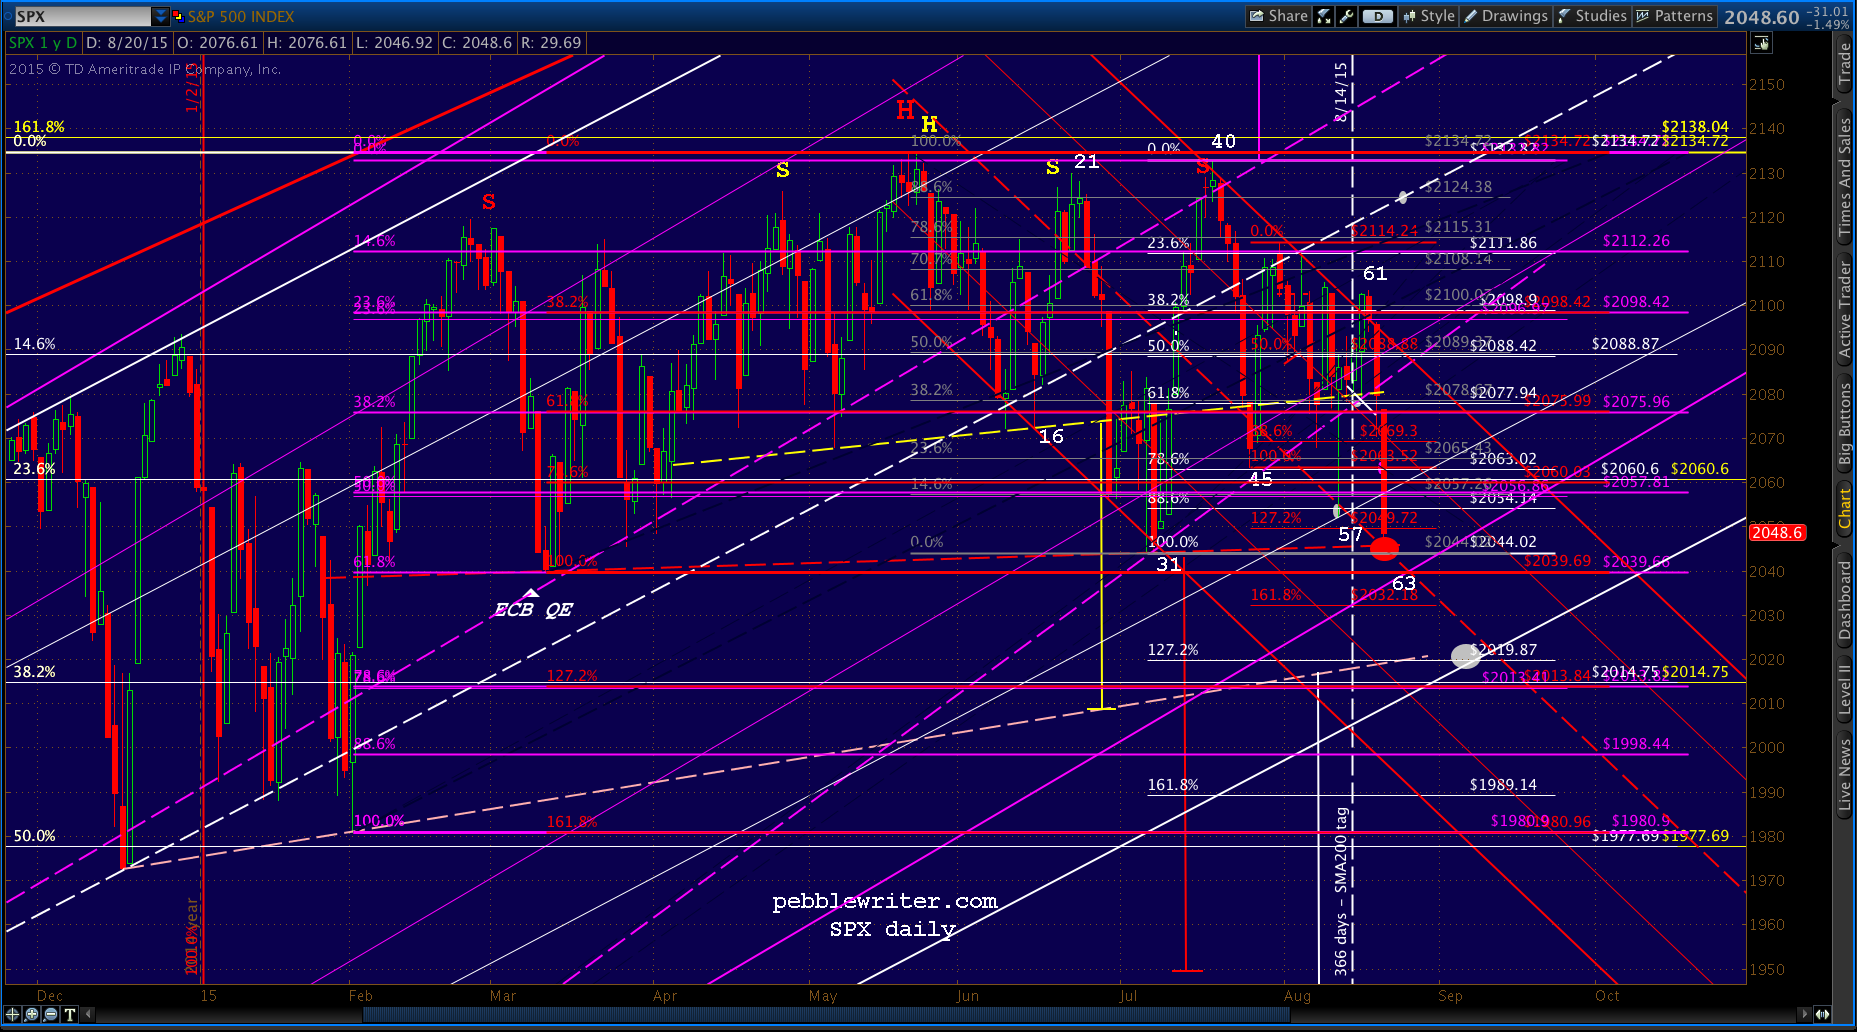
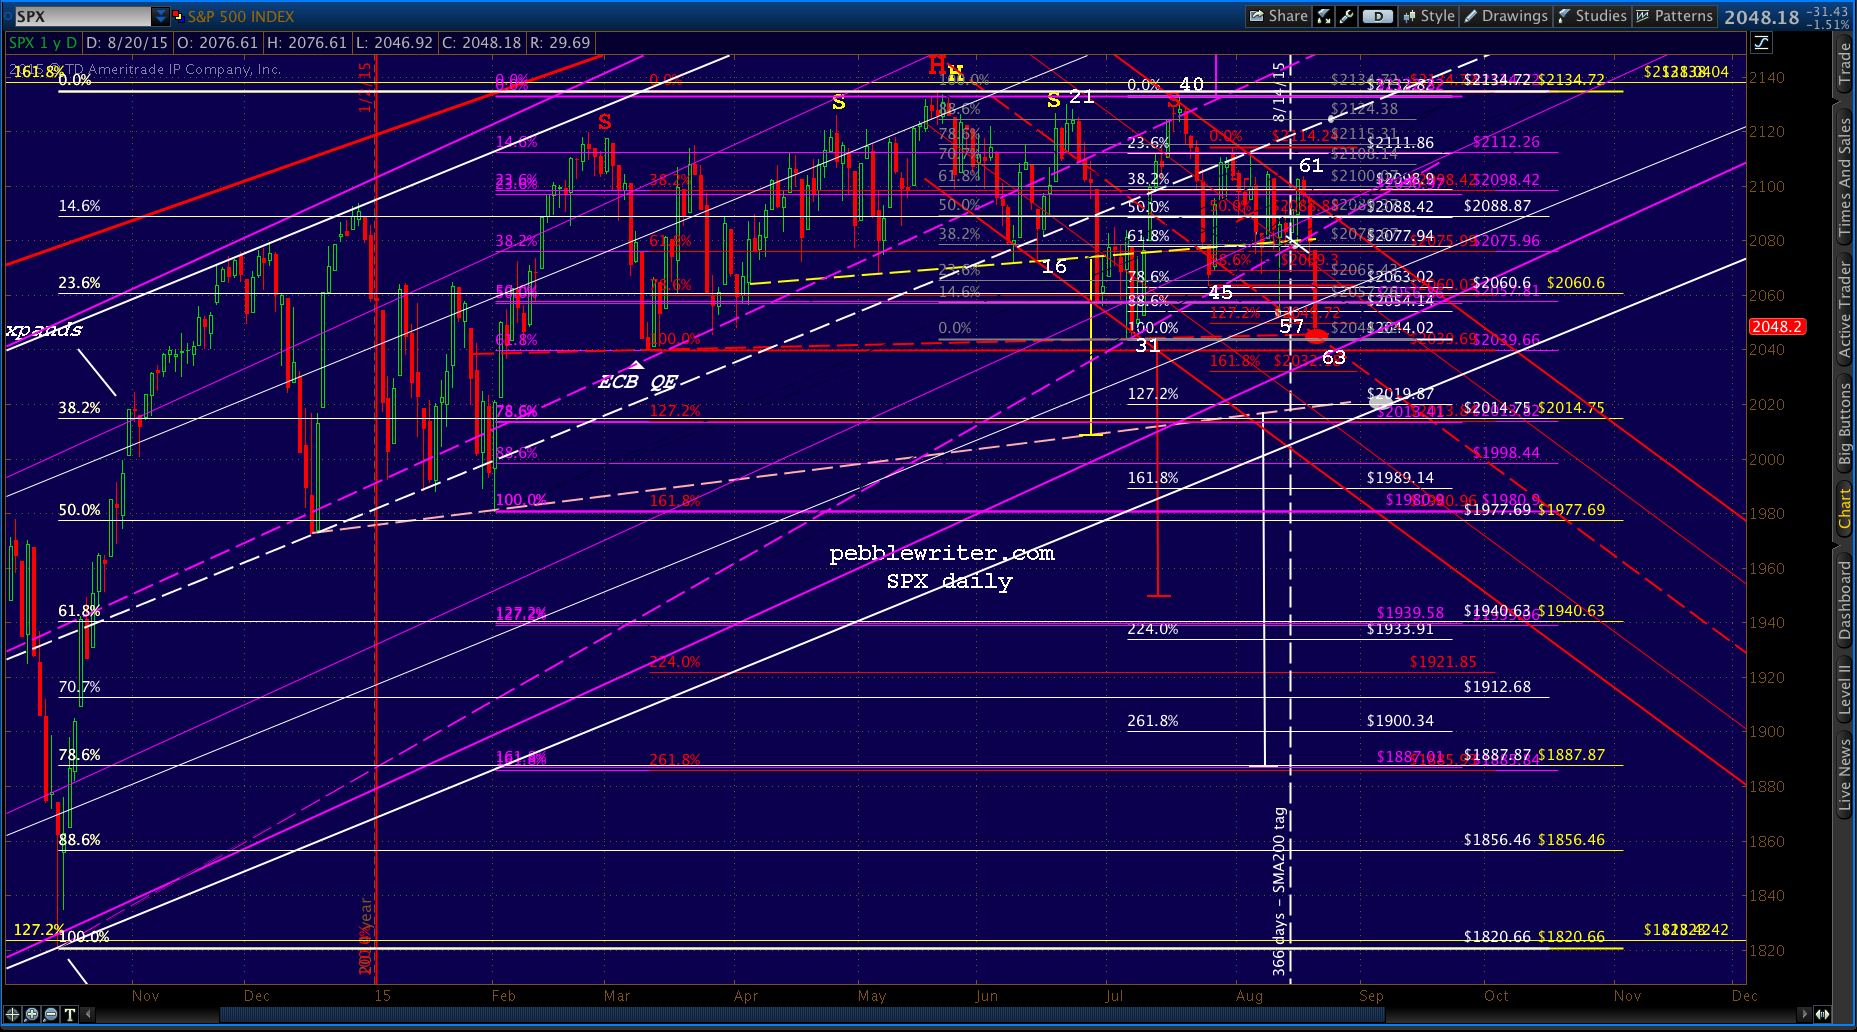
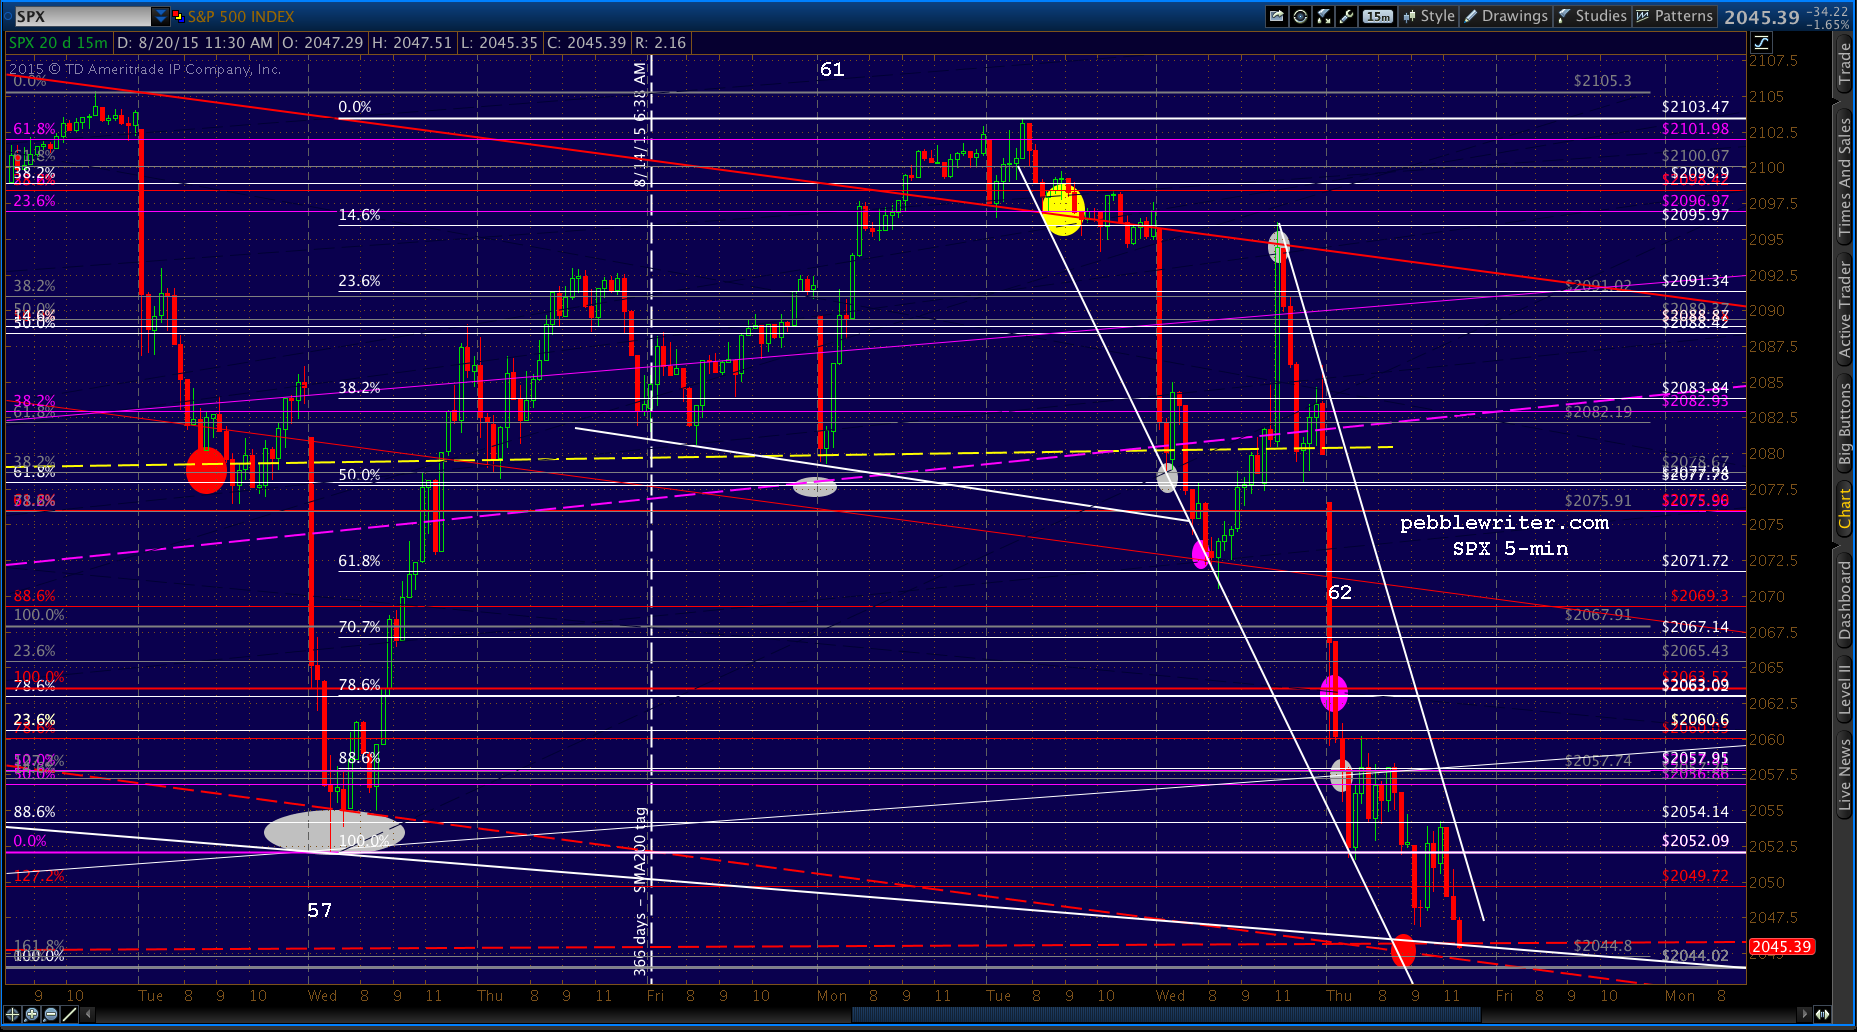
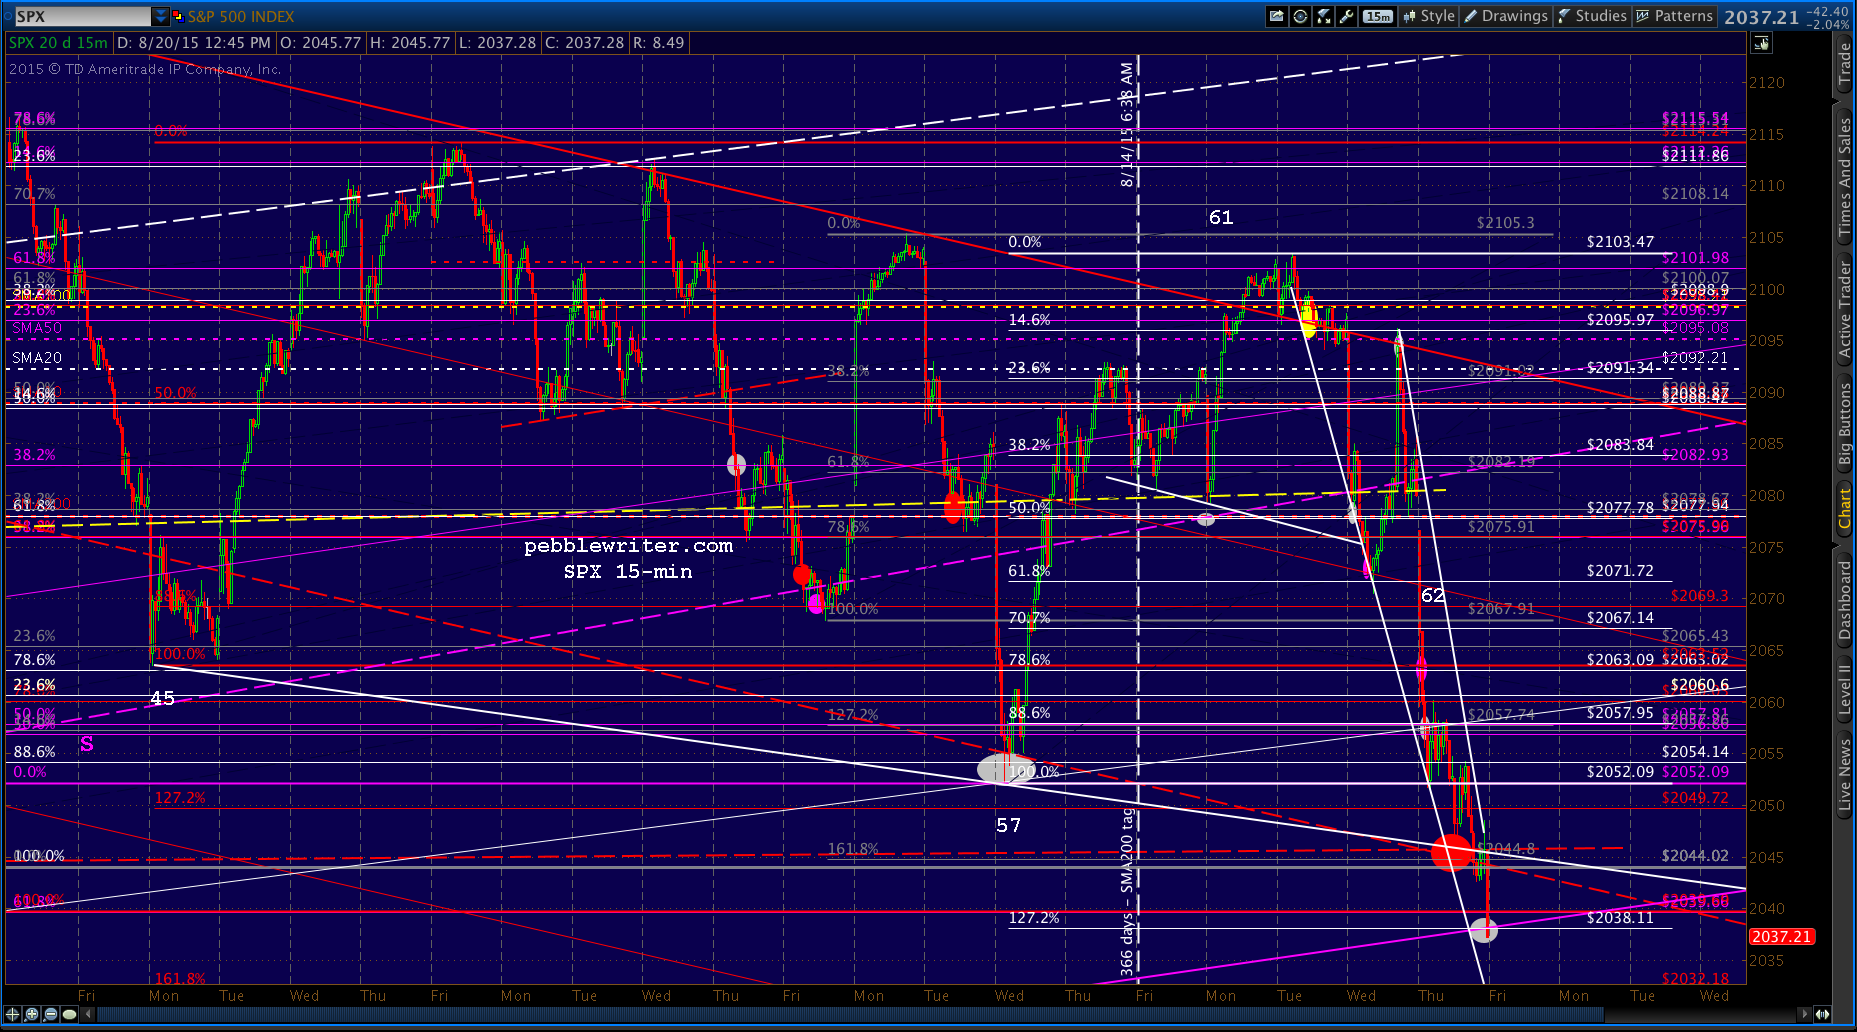
Recall that the dip (labelled 45 below) set up a Butterfly Pattern to the 1.272 at 2020, but more importantly completed two H&S Pattern (in red and white below) that threatened a lot more.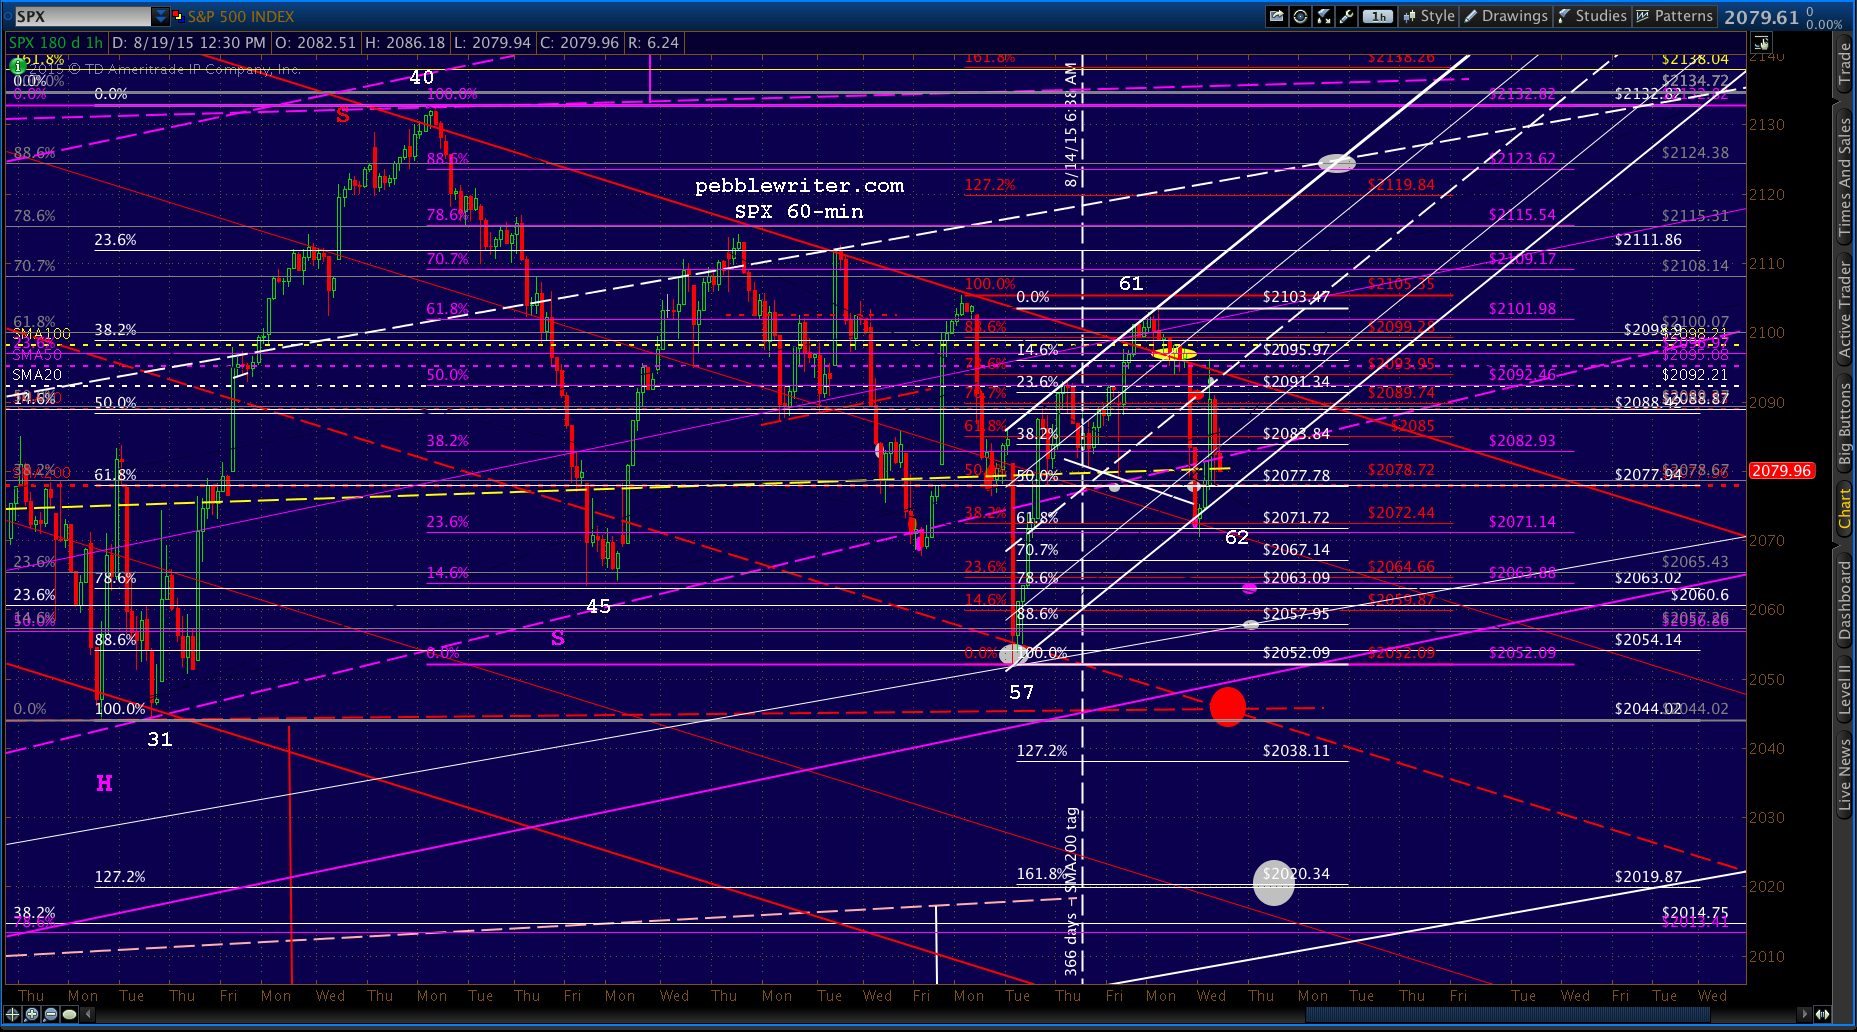 It’s safe to say the white channel that took prices higher this past week should officially break down today — as long as we don’t get another snapback rally as we’ve seen multiple times this past week.
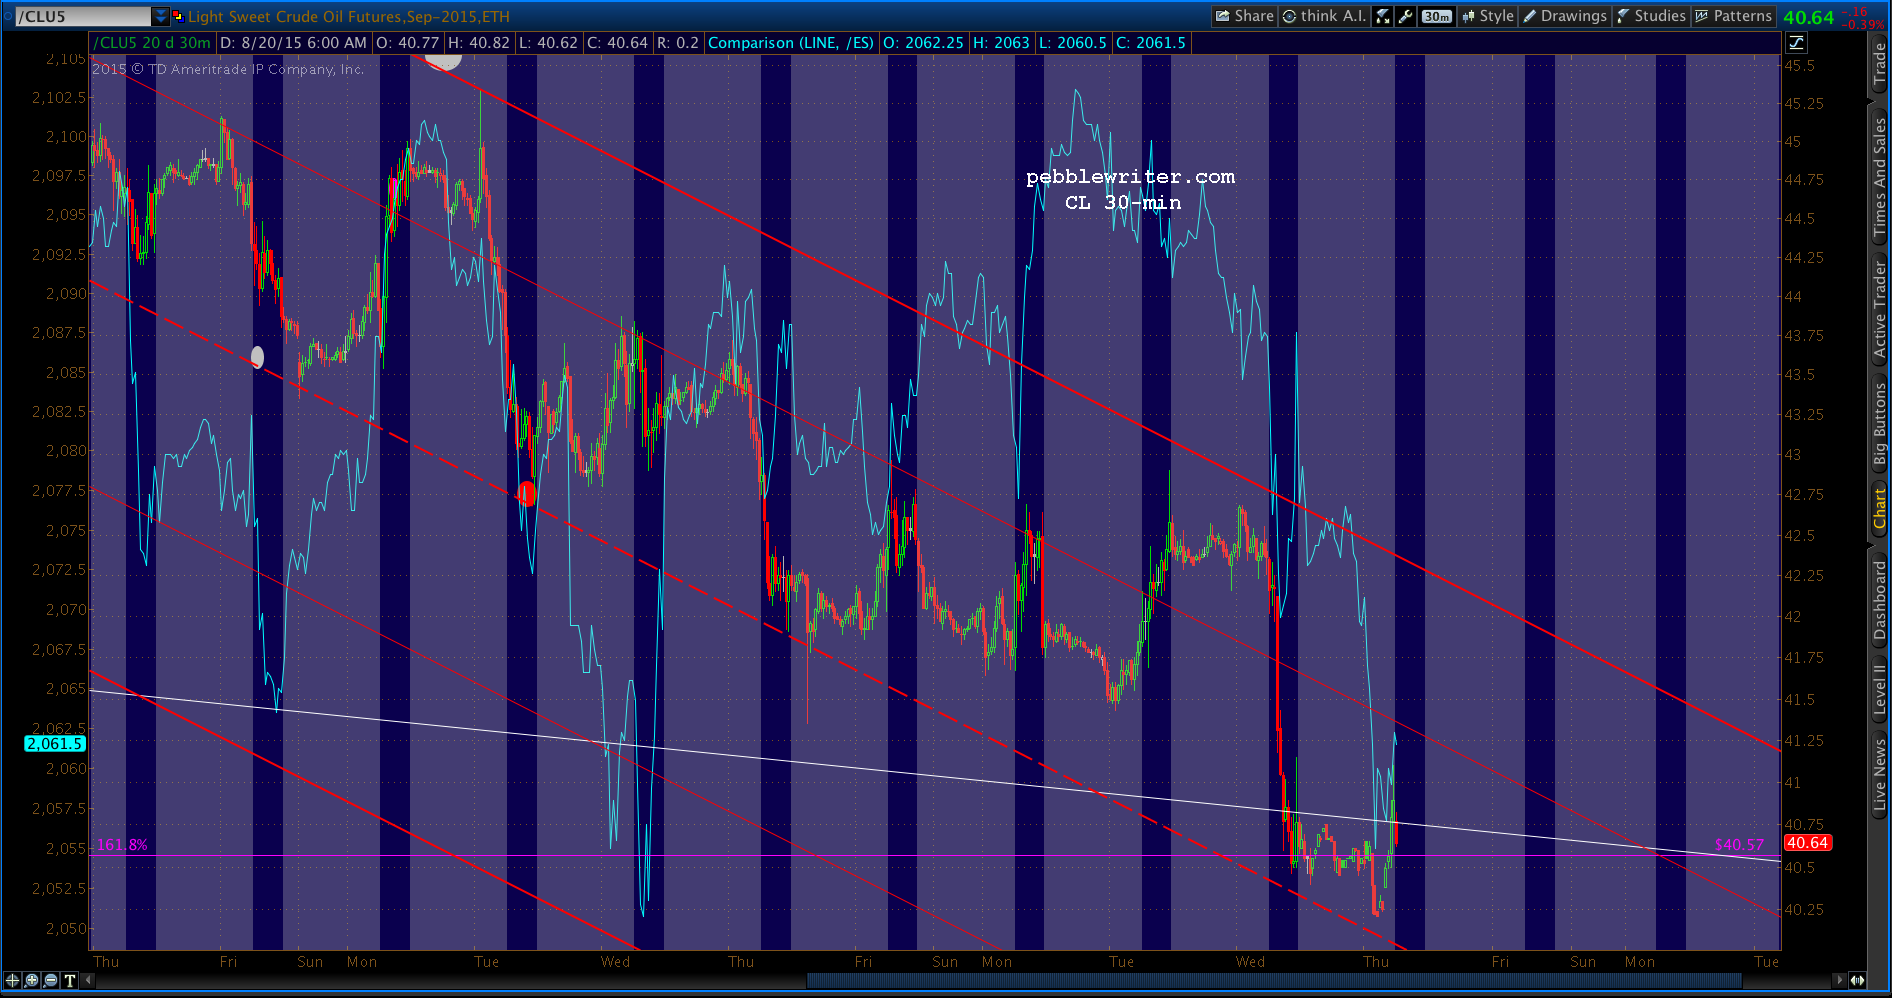
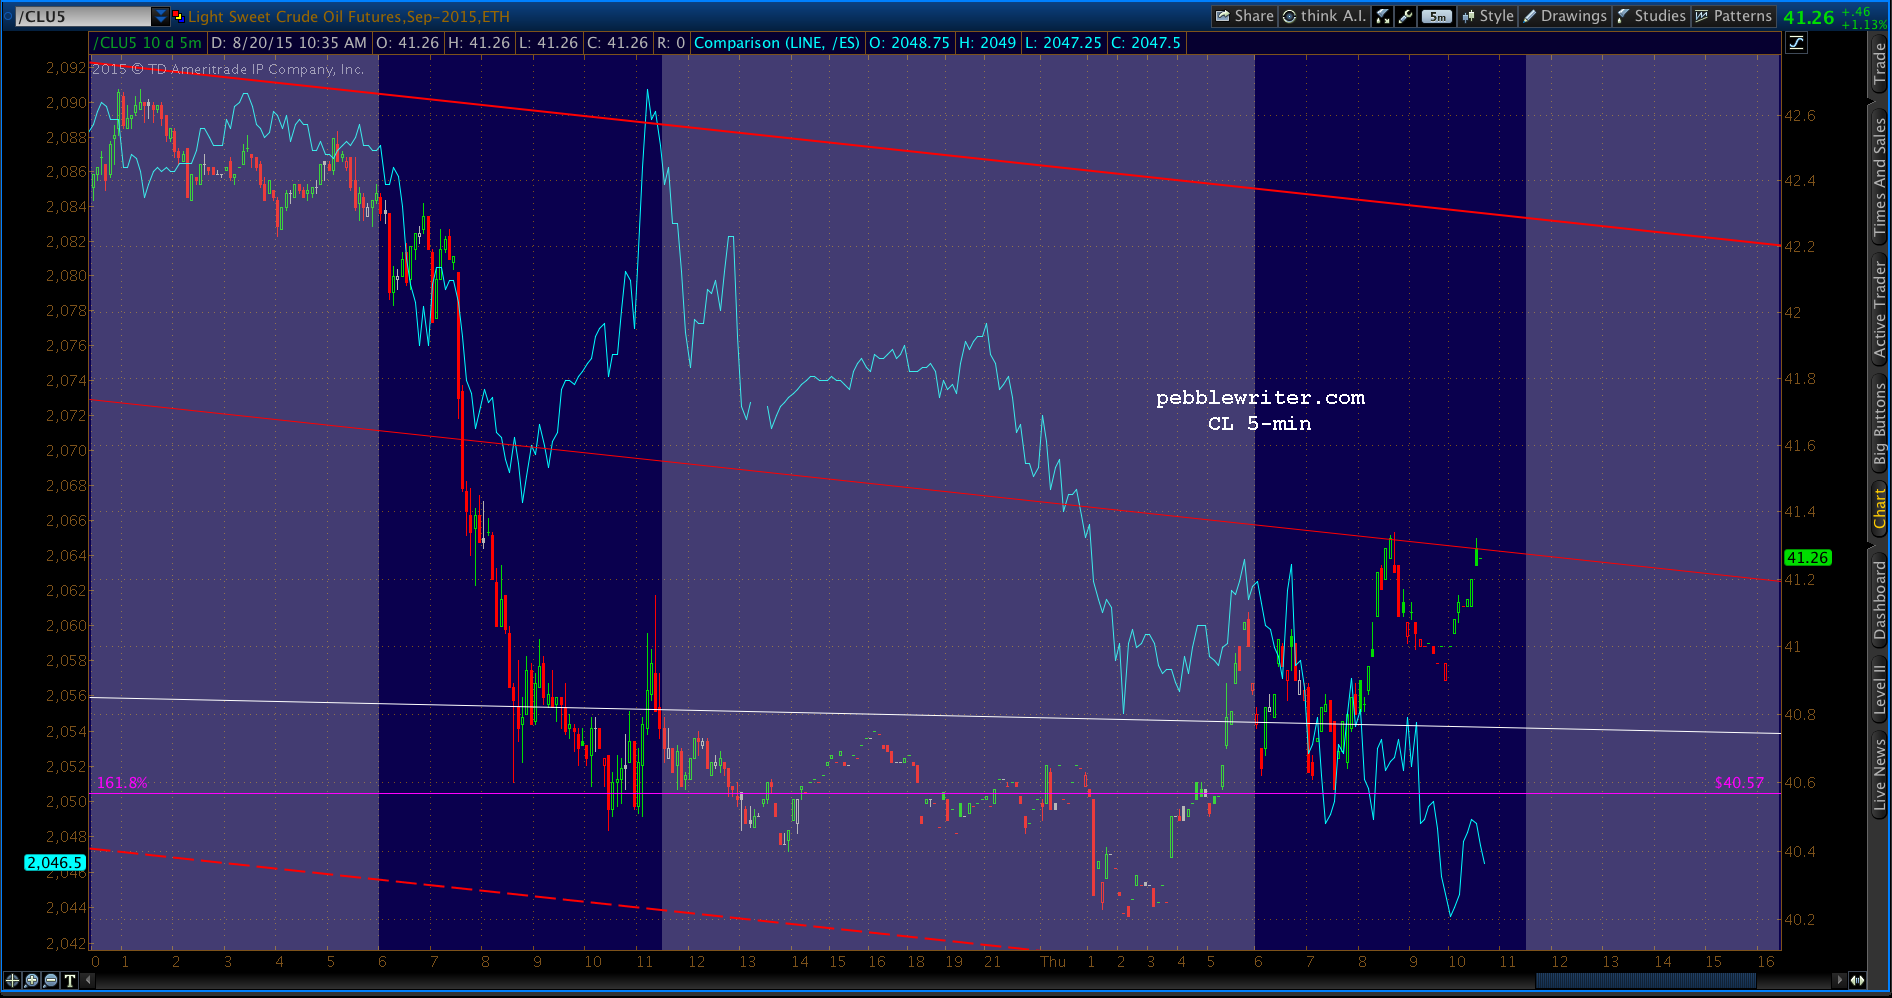
ES has already completed another Bat Pattern.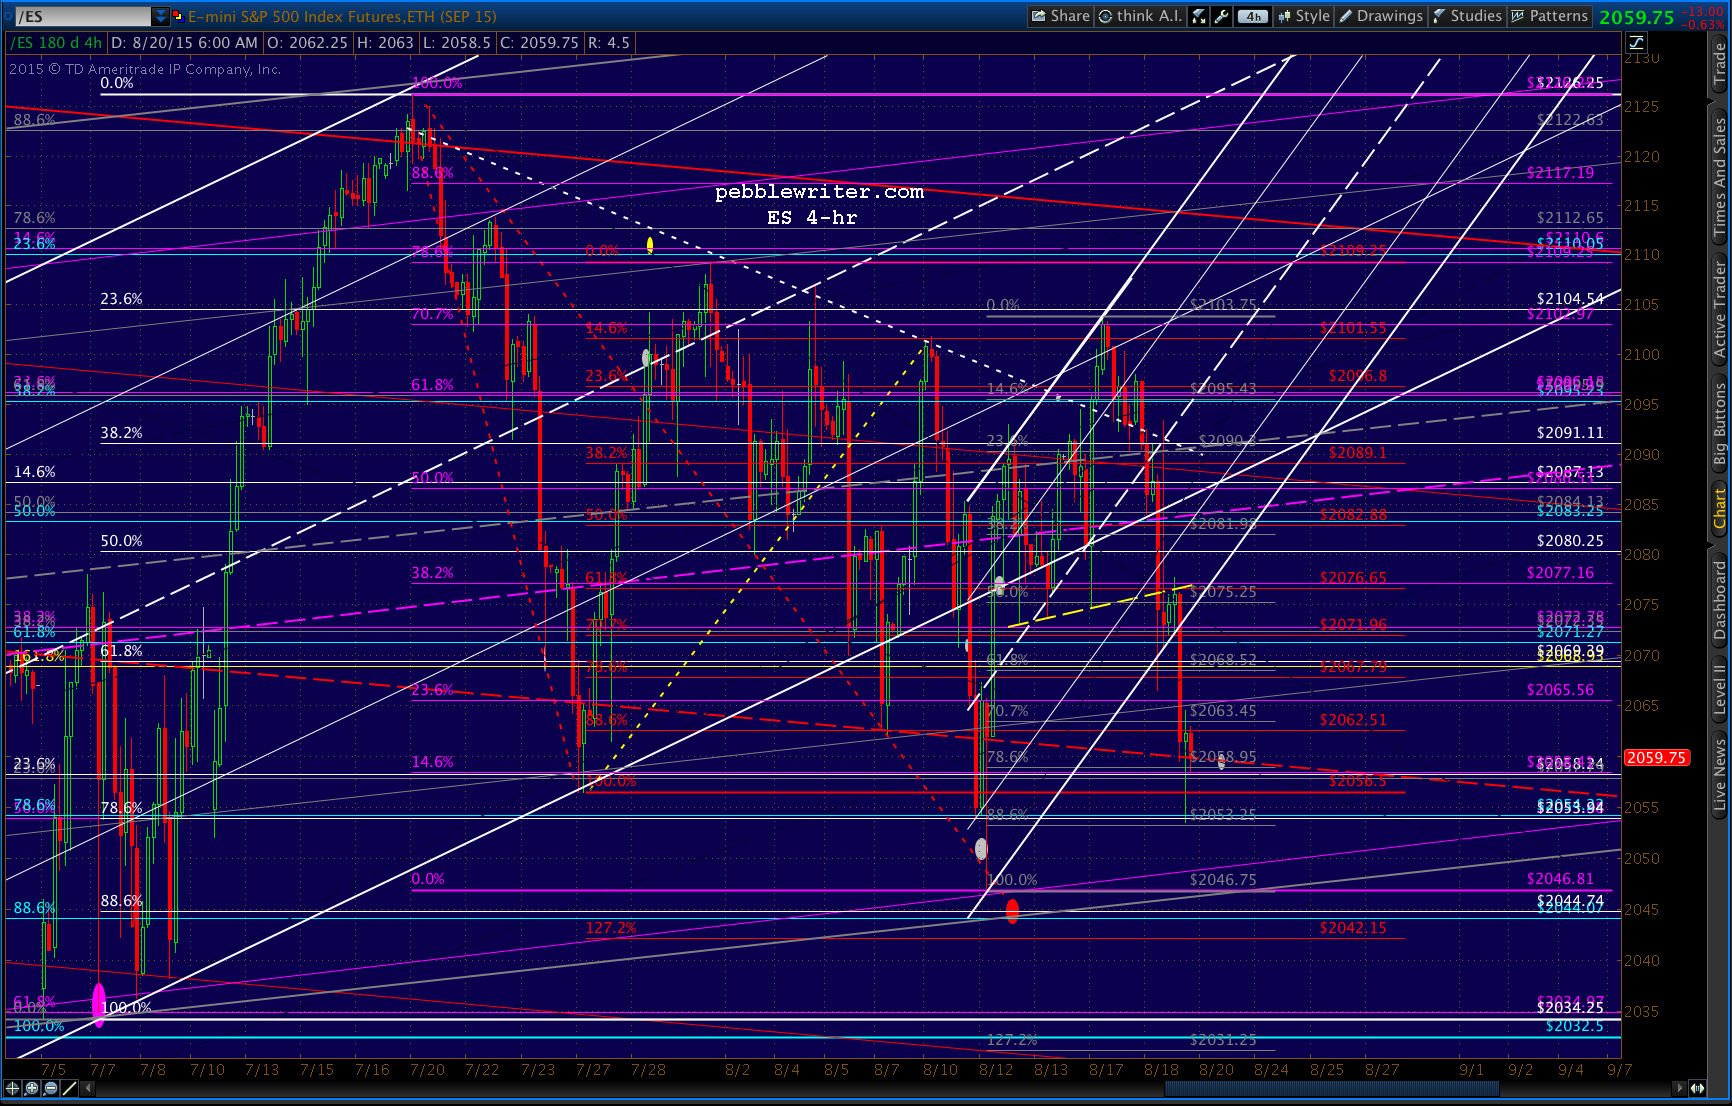 And, as we reported yesterday, CL may have reached bottom.
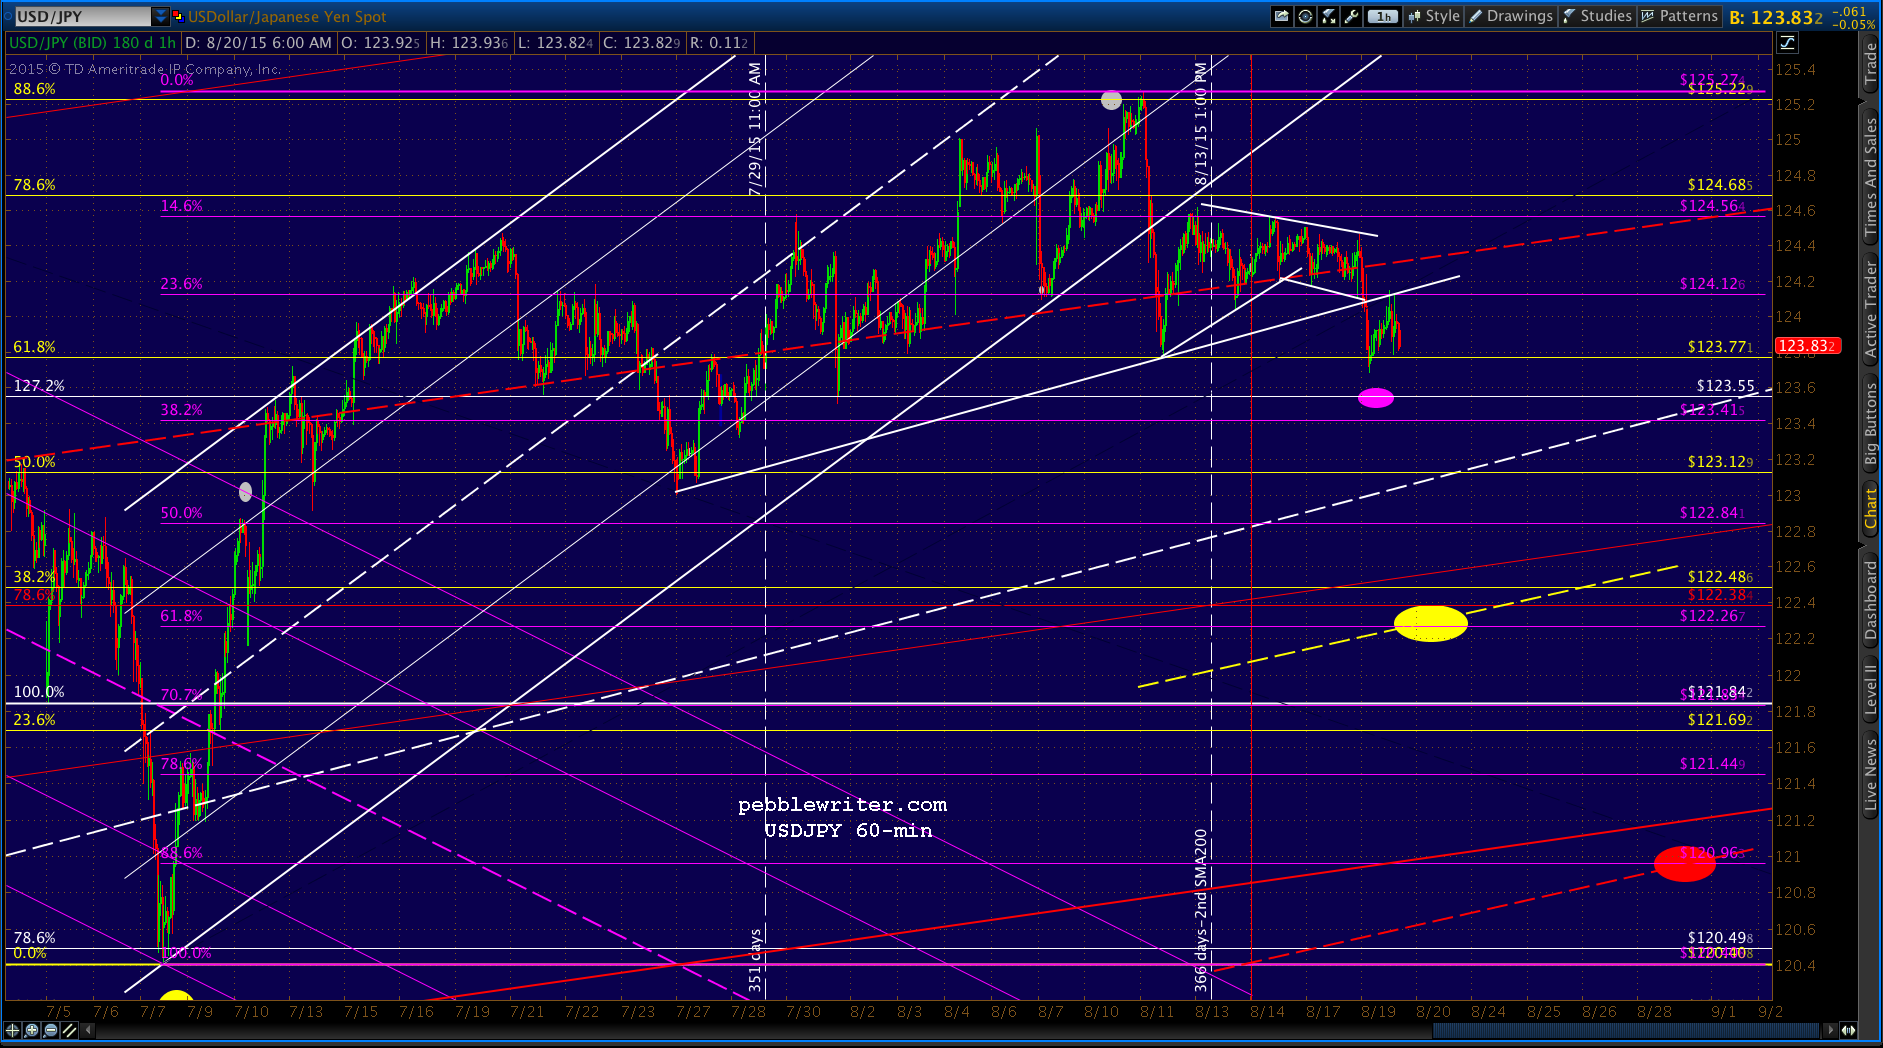
 The key will be USDJPY, which has not only shed the red midline once again, but the white TL it was respecting until yesterday has been broken and backtested. The SMA100 at 122.26 is looking more and more likely.
 UPDATE: 9:32 AM
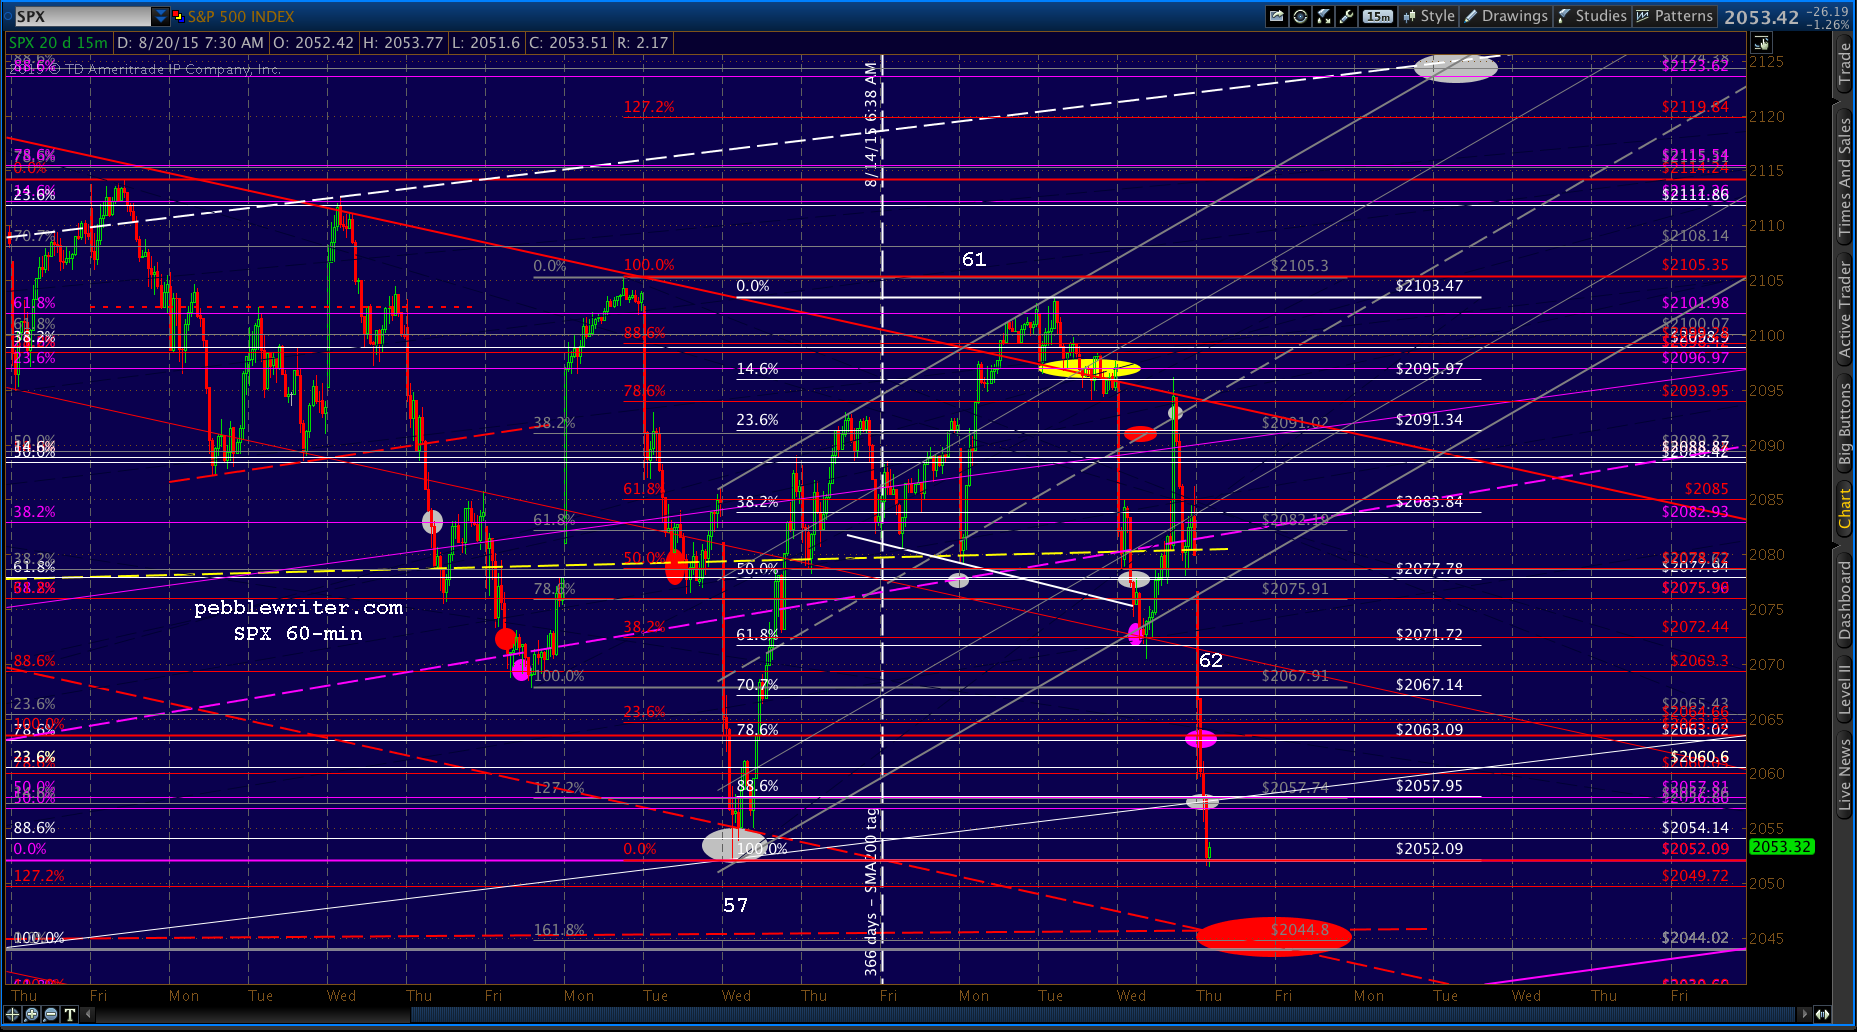
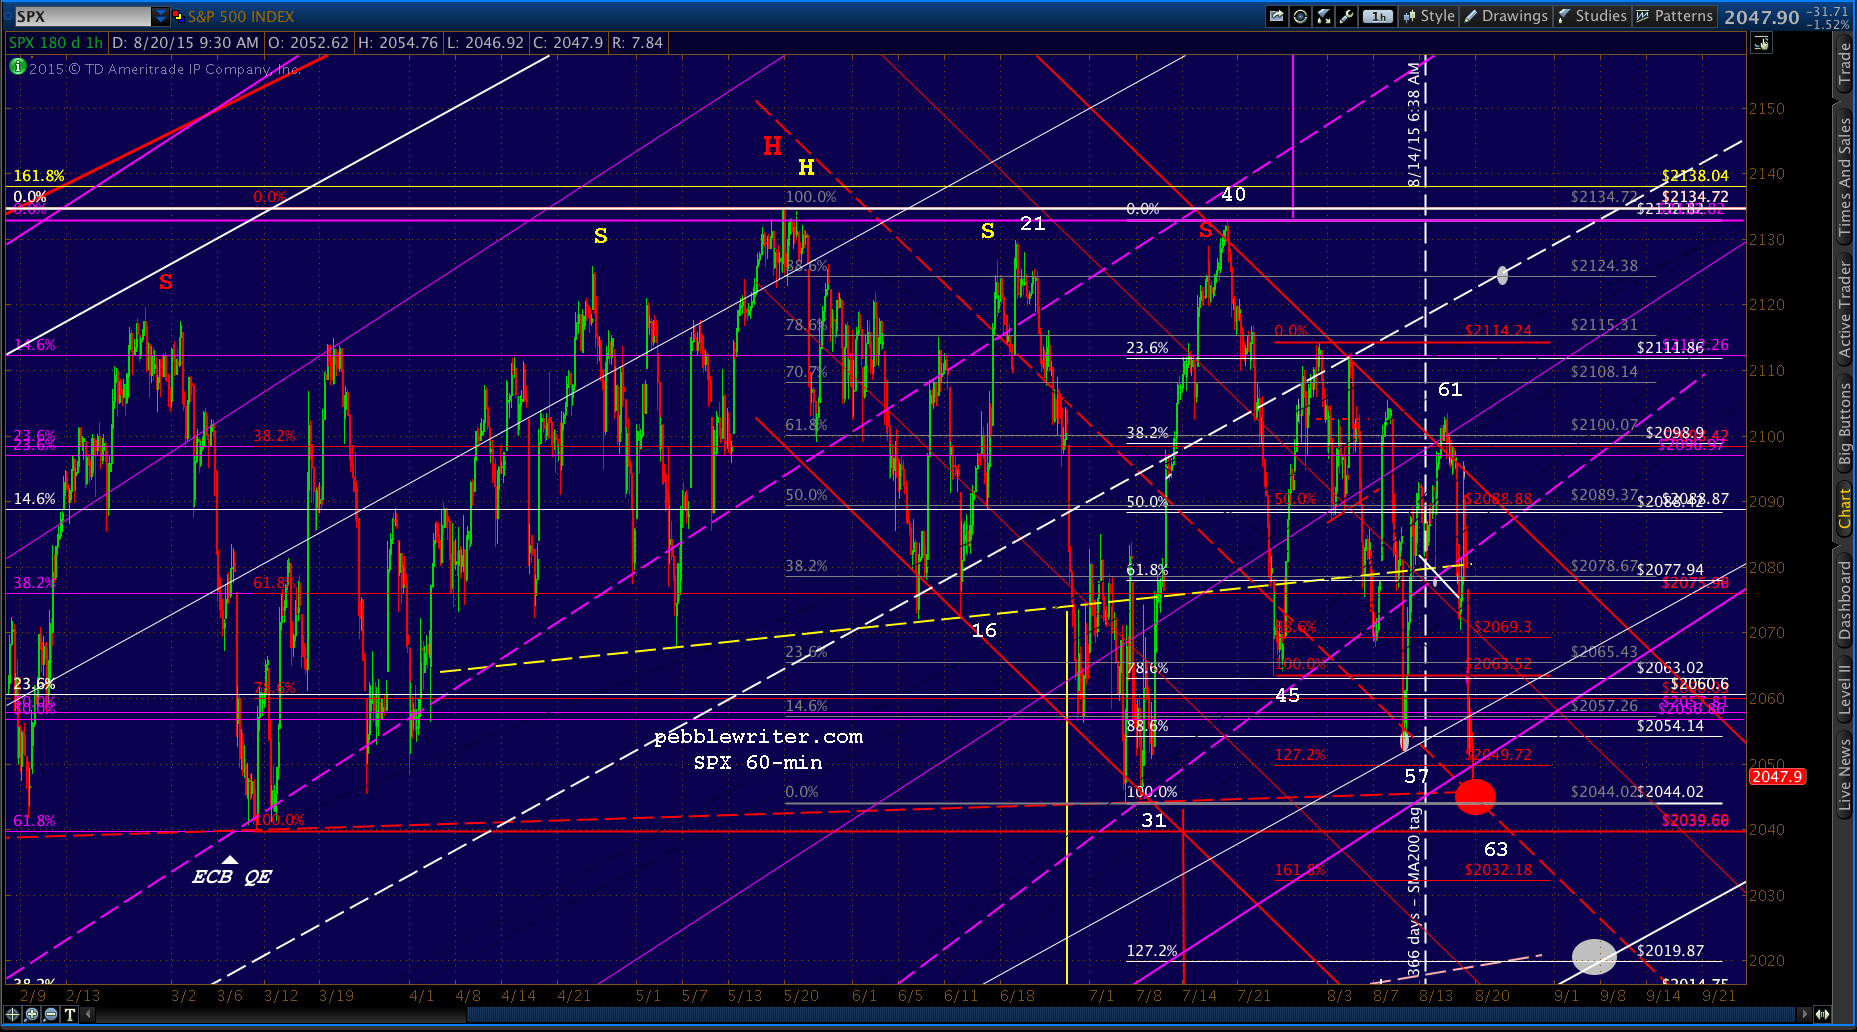
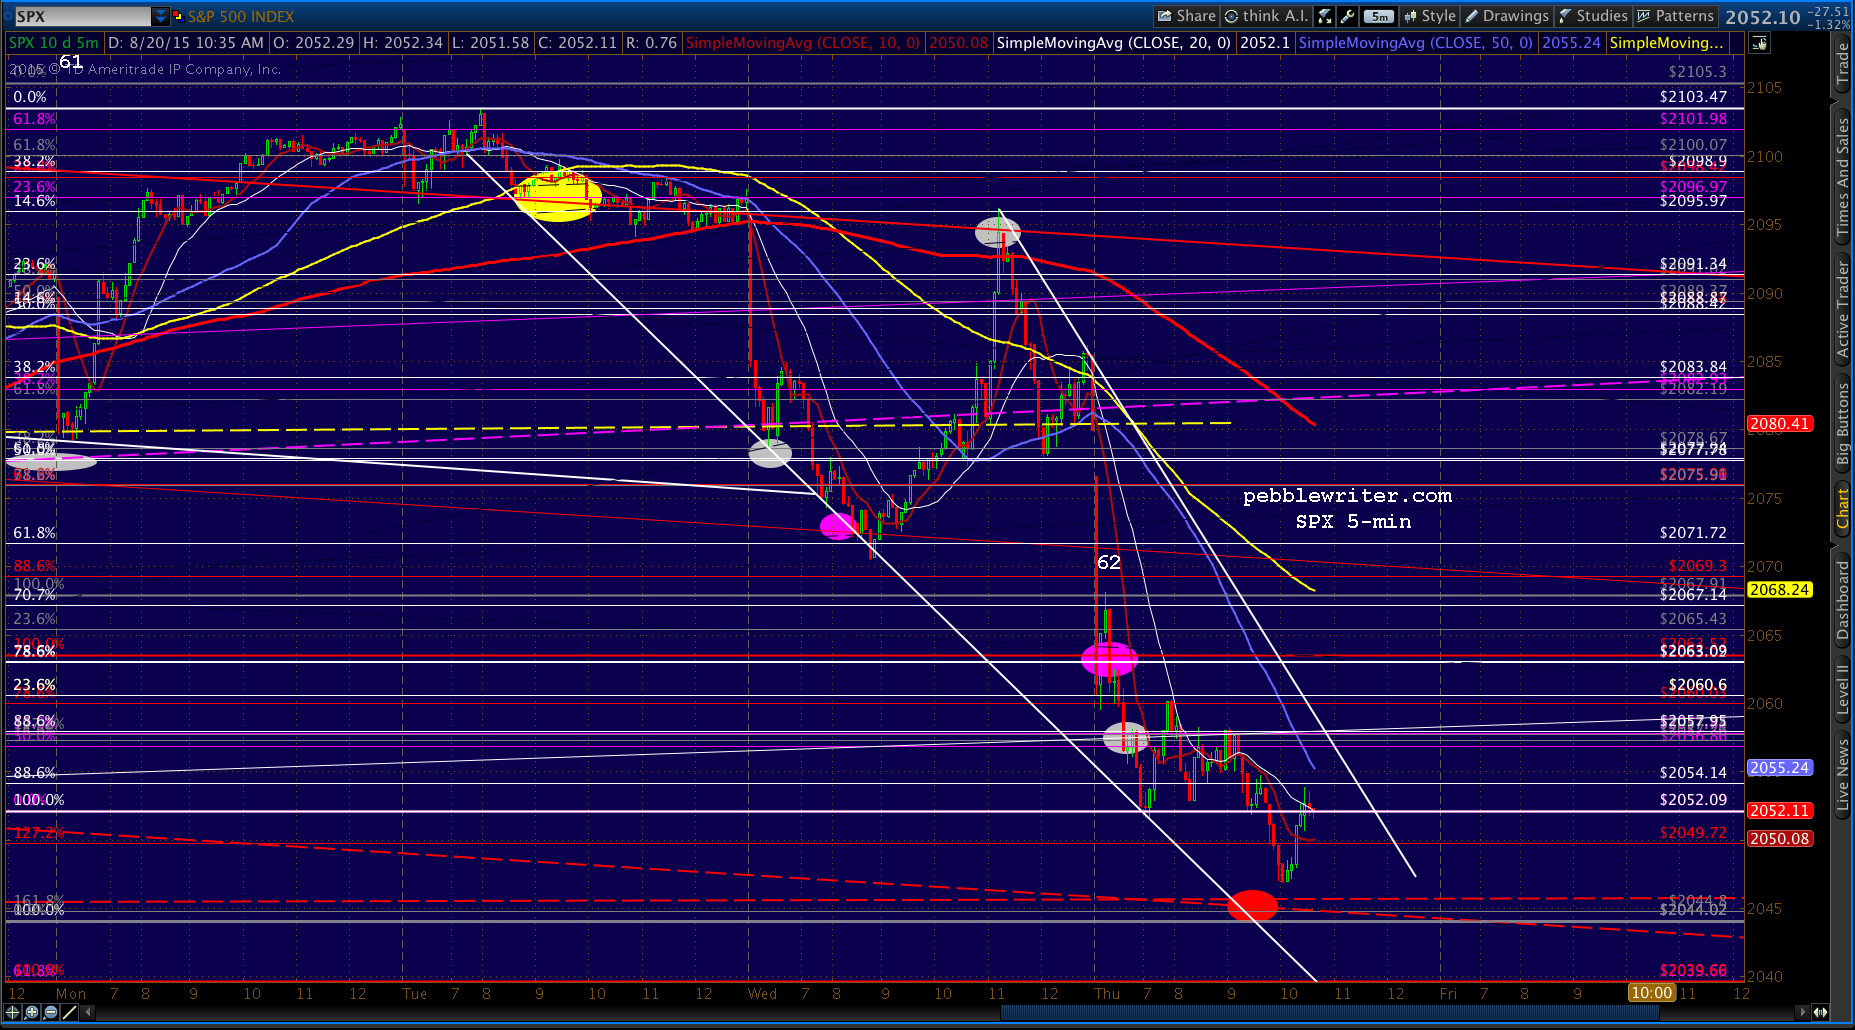
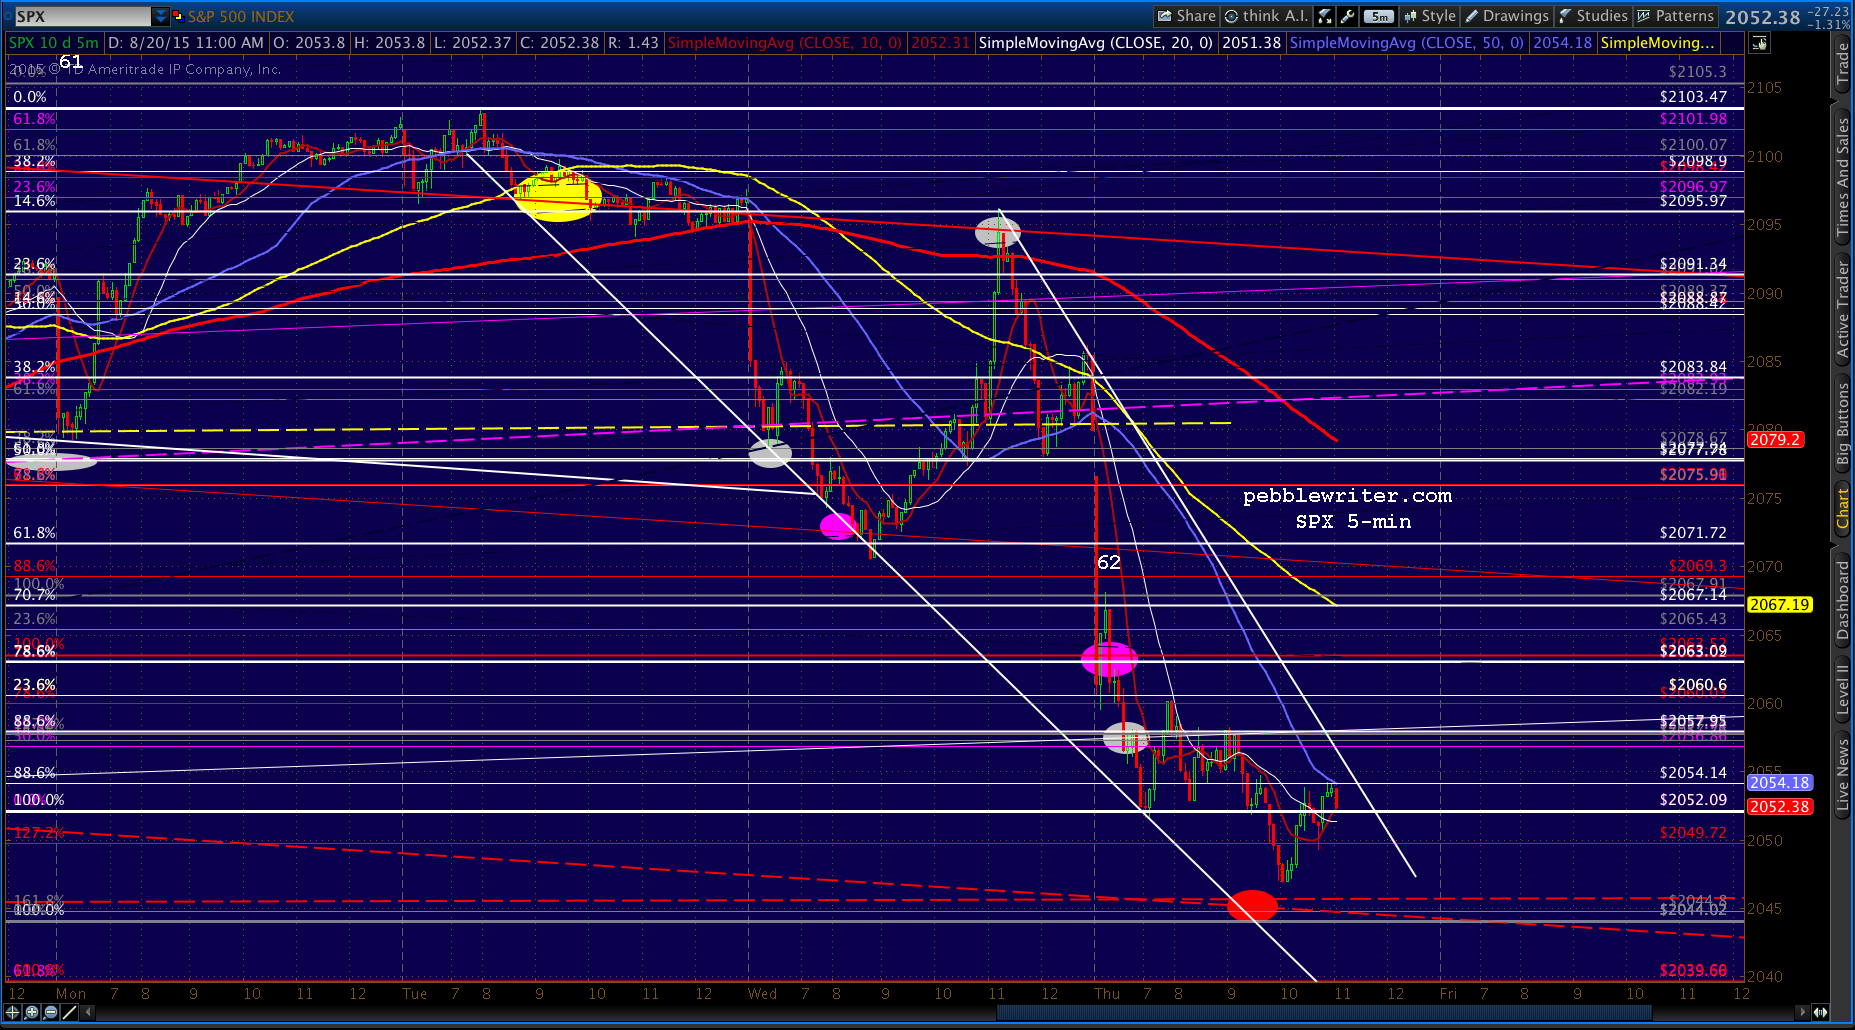
The purple TL from Oct 2014 has been broken again. The white .886 at 2057.95 is coming up. Note that it also marks a white channel line. I’ll put that chart up in a moment.
 Here’s a daily chart with some of the clutter removed.
 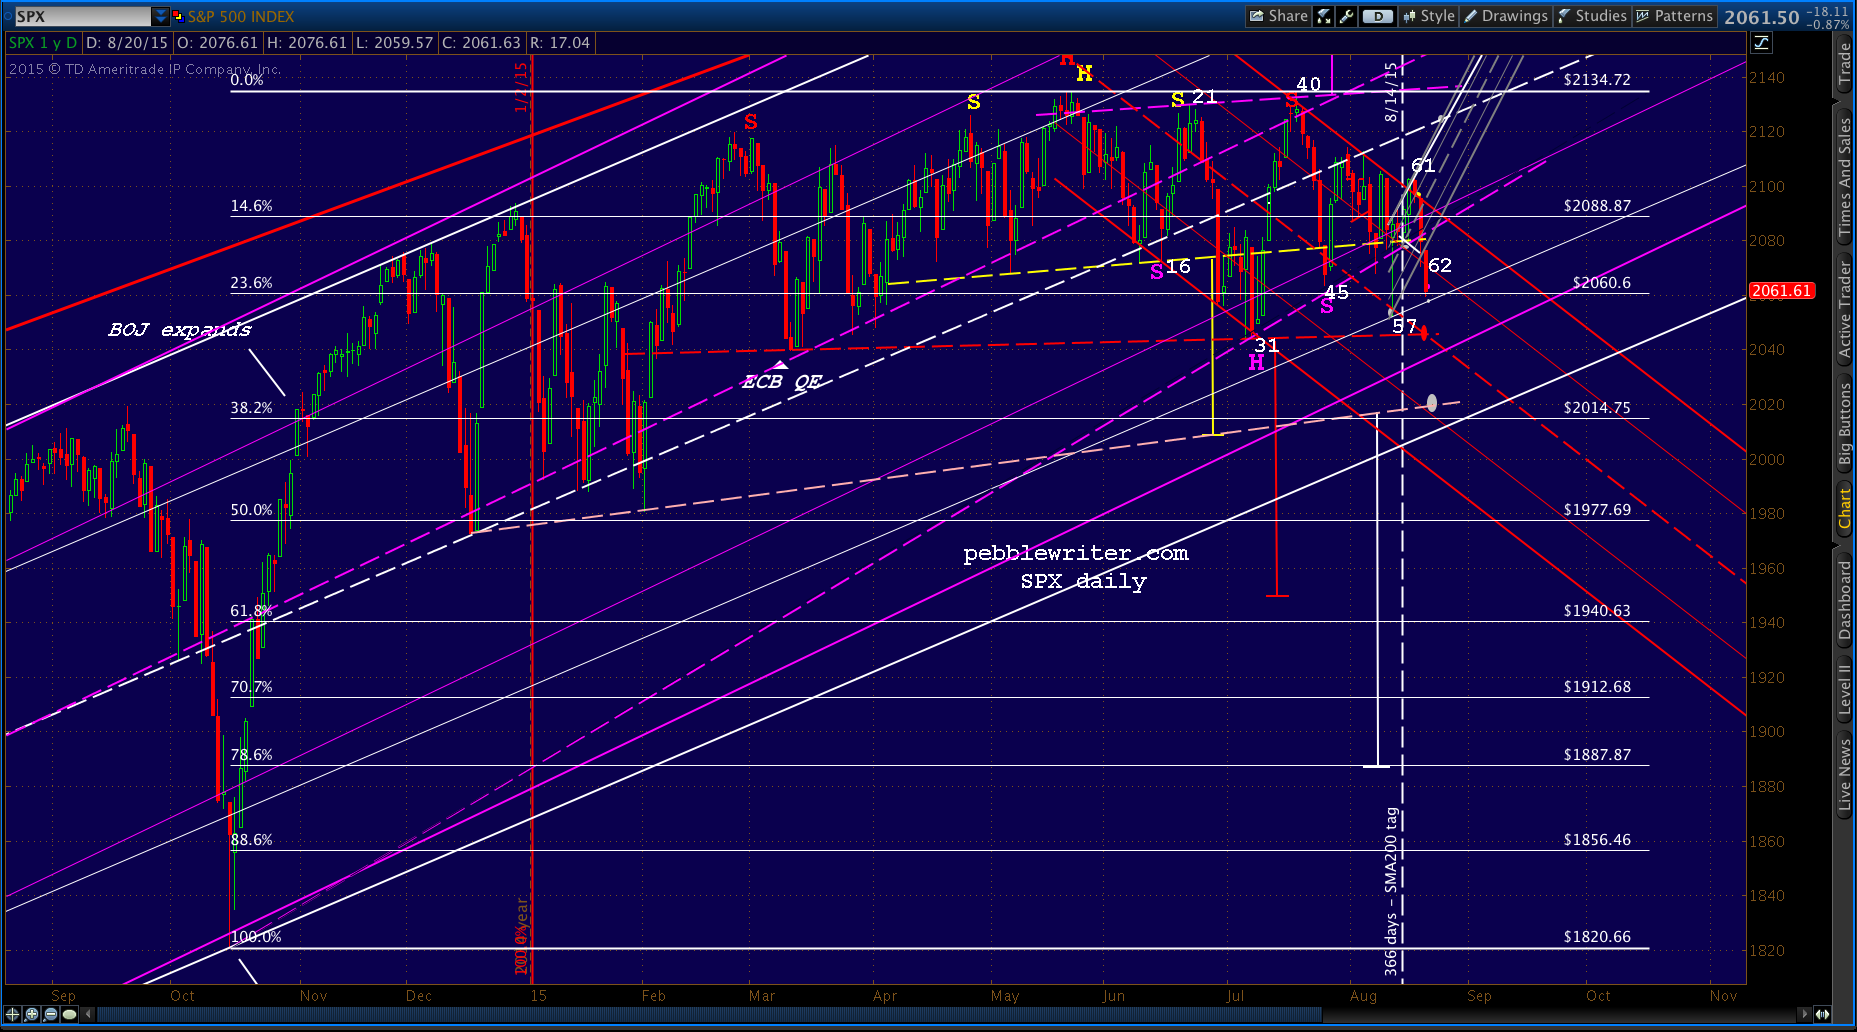 And, here’s the corresponding daily USDJPY chart showing the SMA100 support having reached the purple .618 and the SMA200 support approaching the red channel bottom.
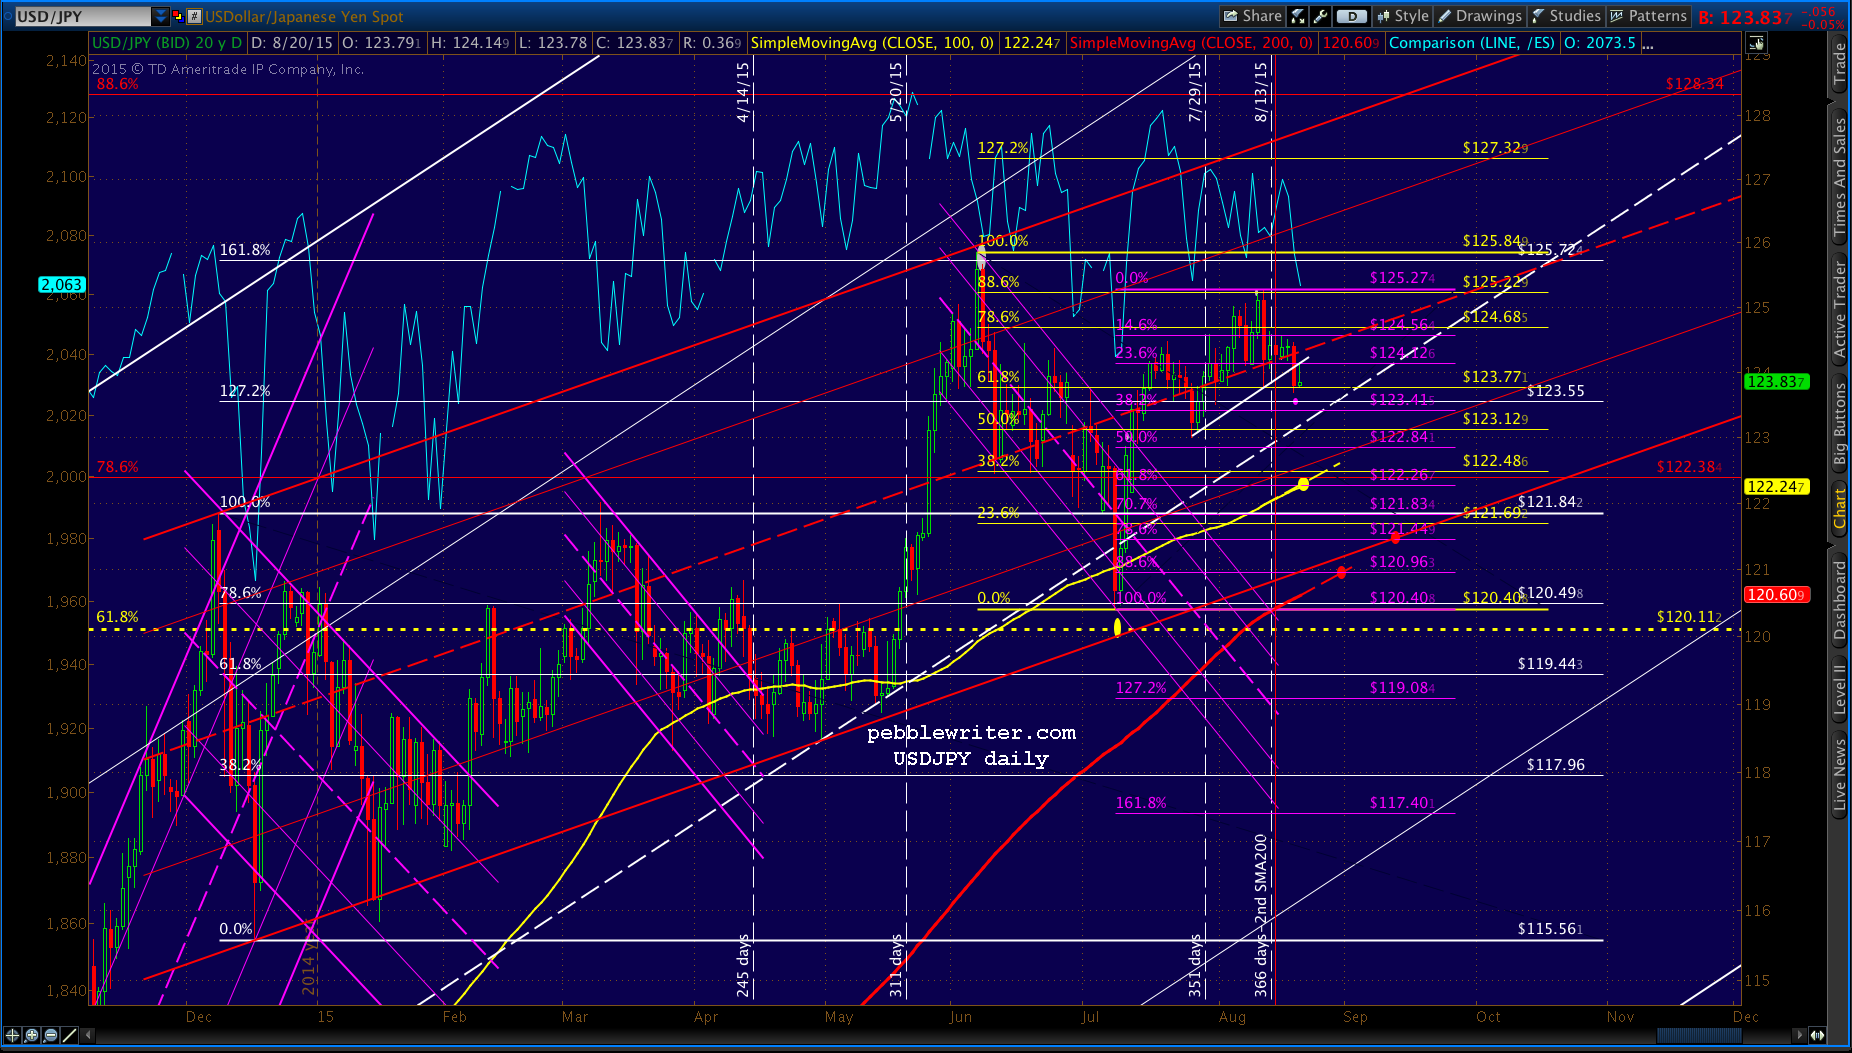 If it looks excessively bearish, the analog designers are doing their job. Remember, the whole point is to entice/force the BoJ to expand QQE, and, more importantly, drive the yen lower in order to support the yen carry trade.
UPDATE: 10:03 AM
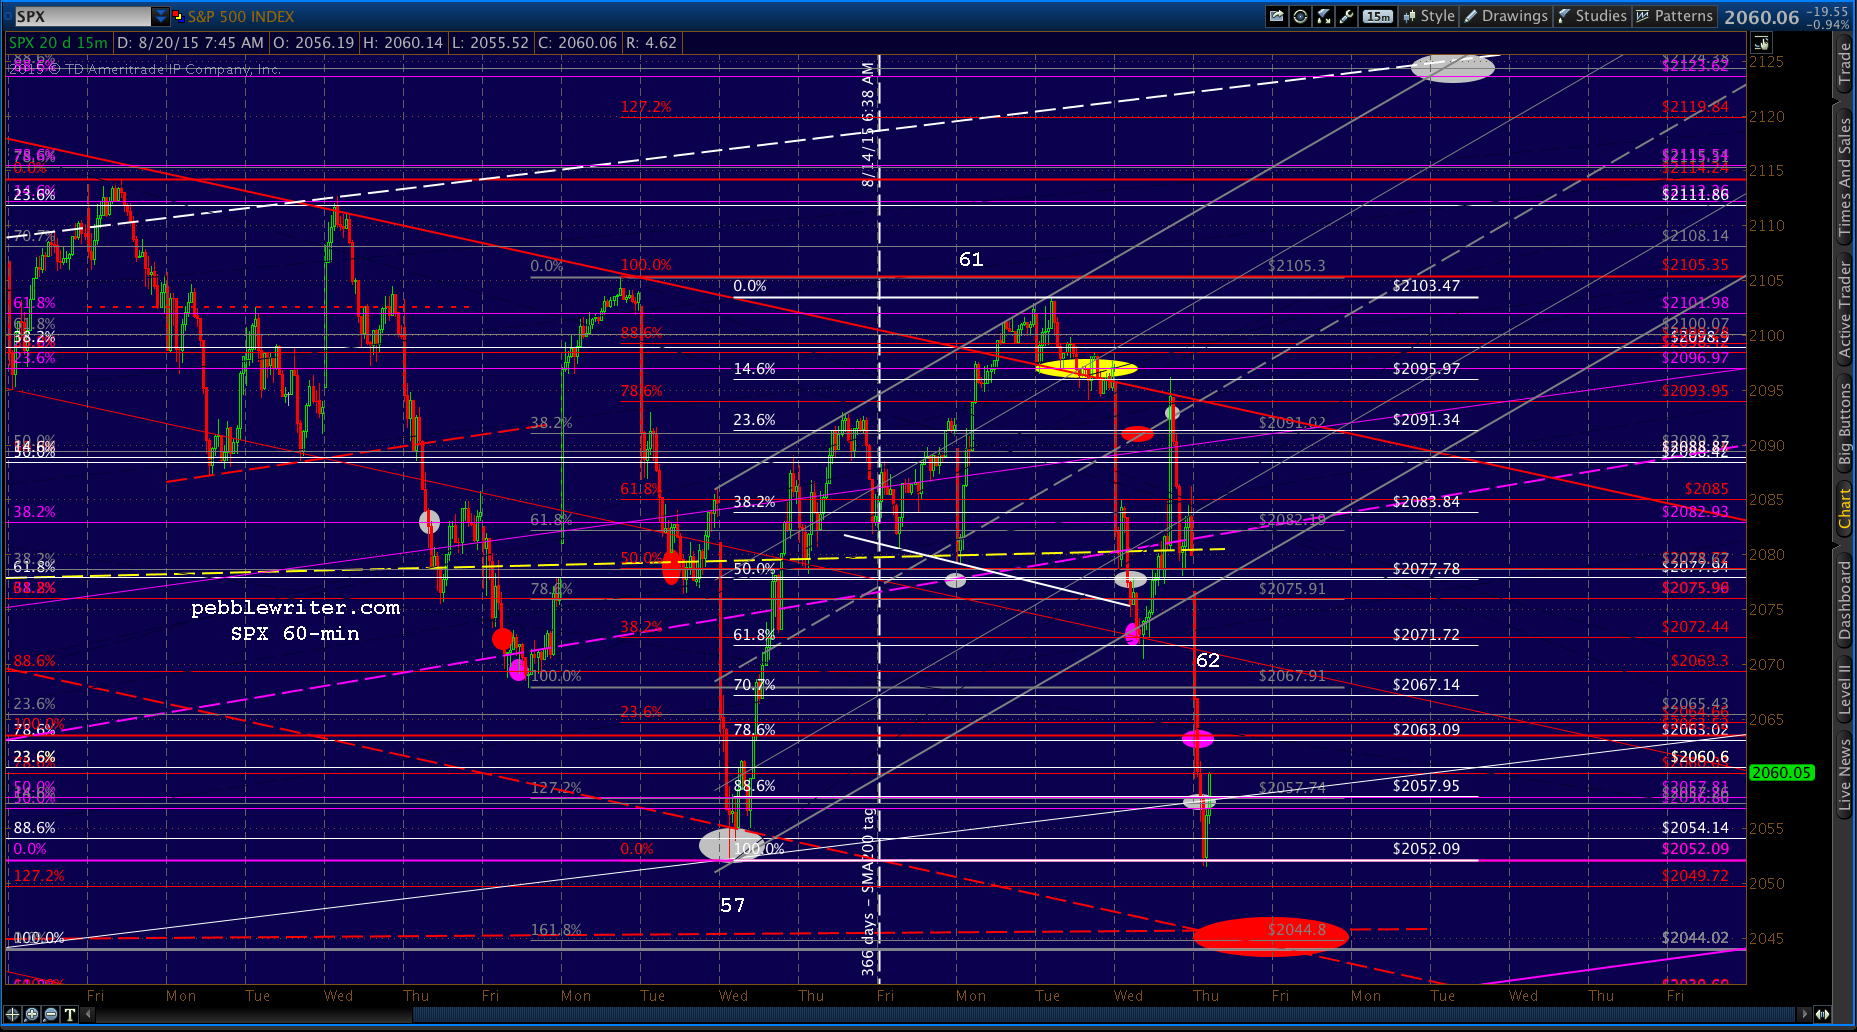
Just tagged the .886 at 2057.95. USDJPY and CL are both still heading south, so I’d wait for a spike higher before going long. A stop at 2058ish might be a better idea. Eyes on the 2044 target now (actually, the neckline looks like 2045.80 or so.)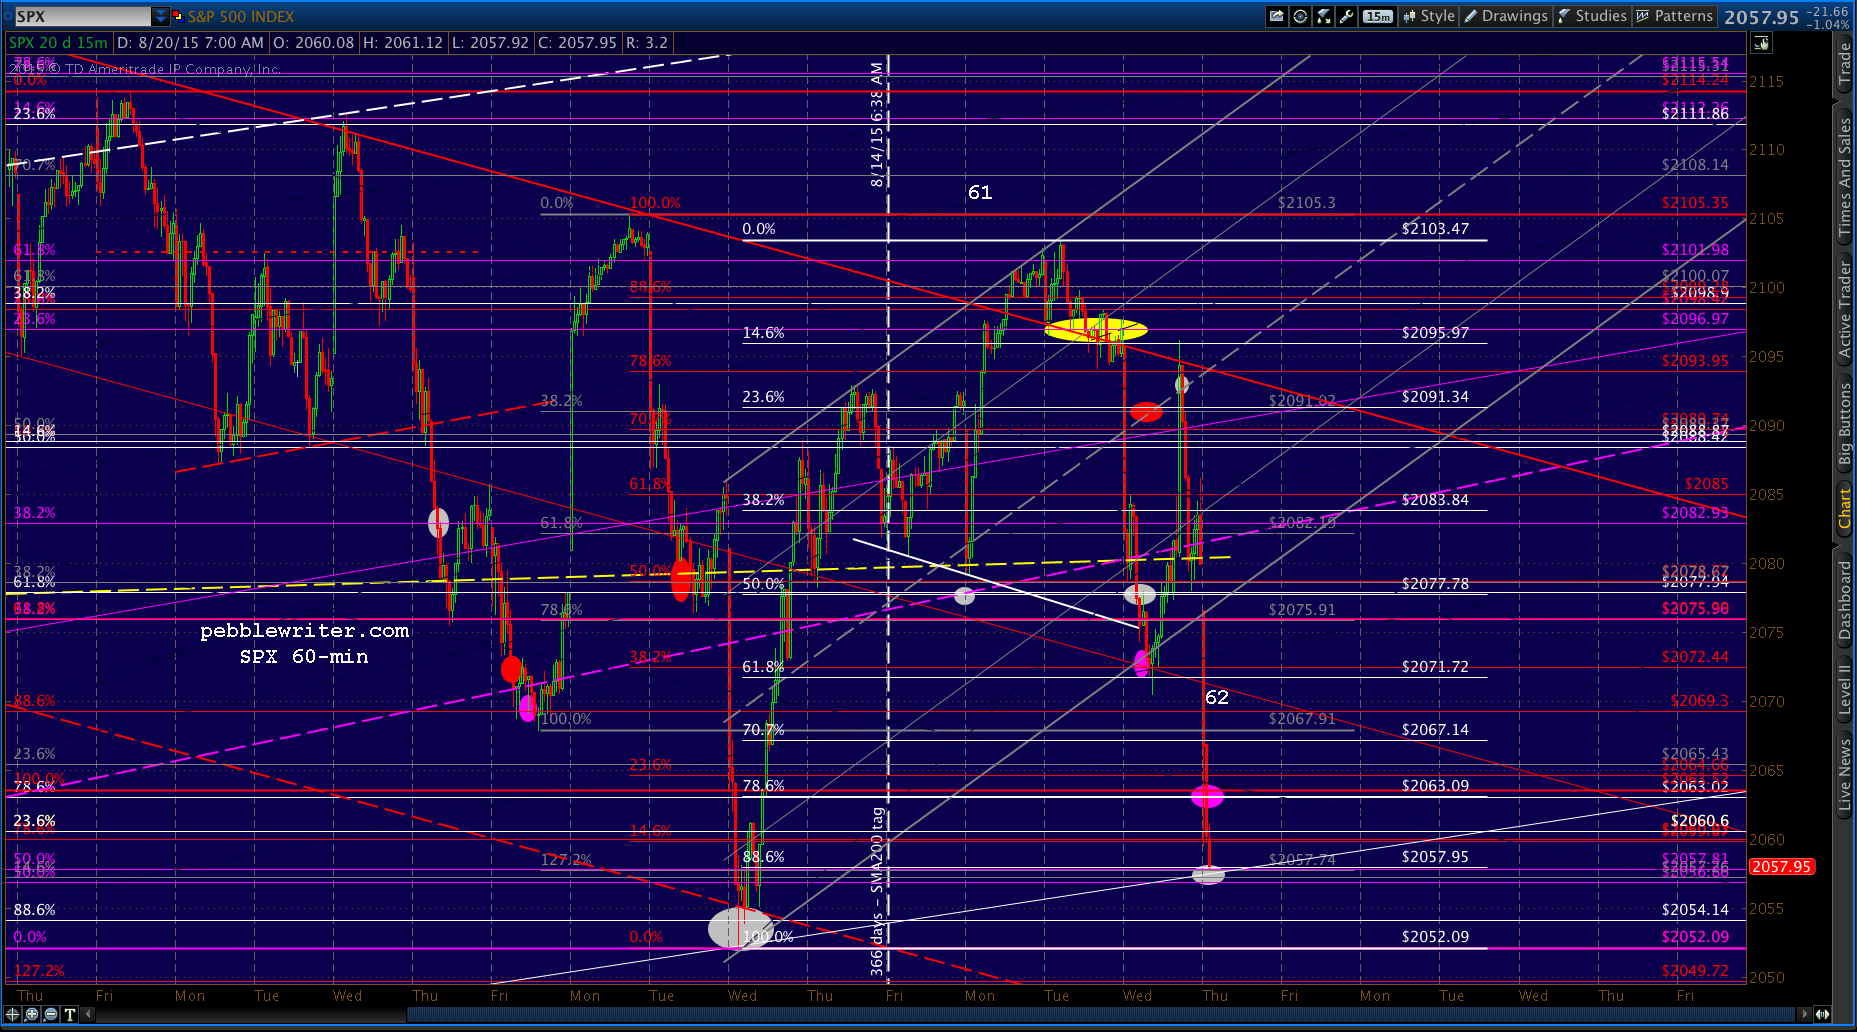 UPDATE: 10:36 AM
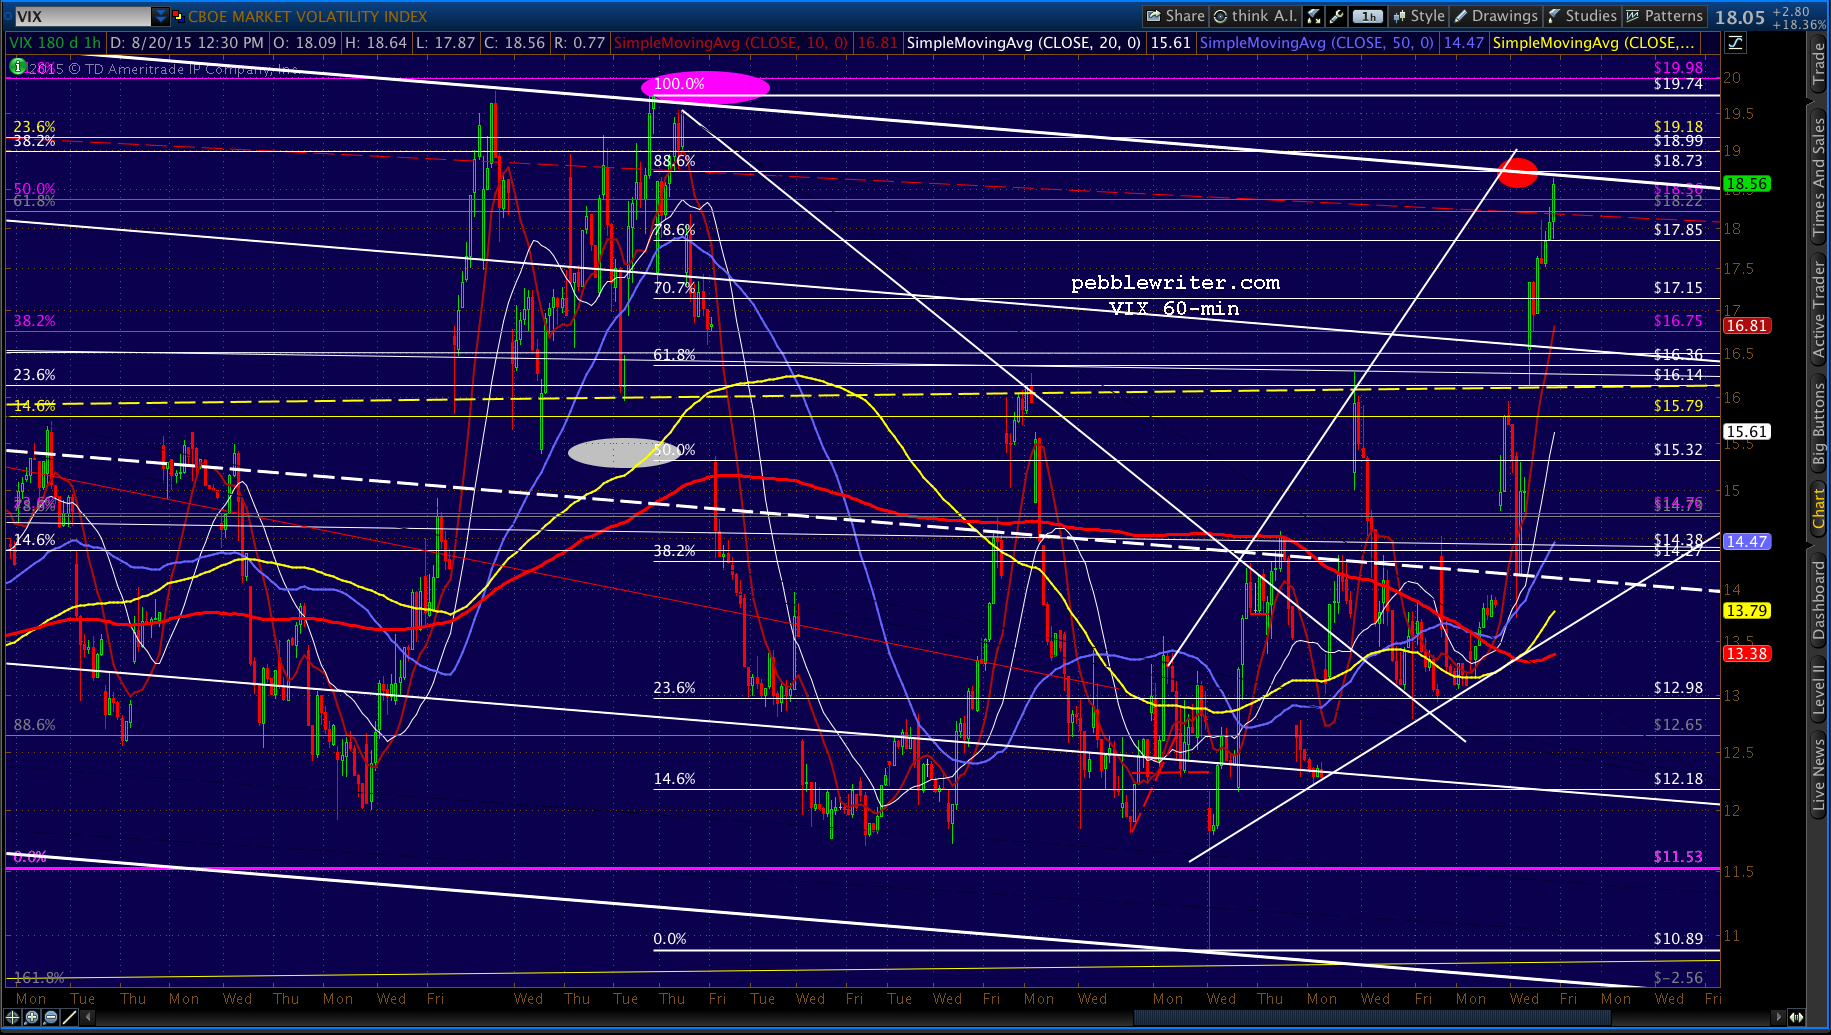
As an aside, two other key charts are confirming the move to 2045. VIX is closing in on the red target at 18.73. 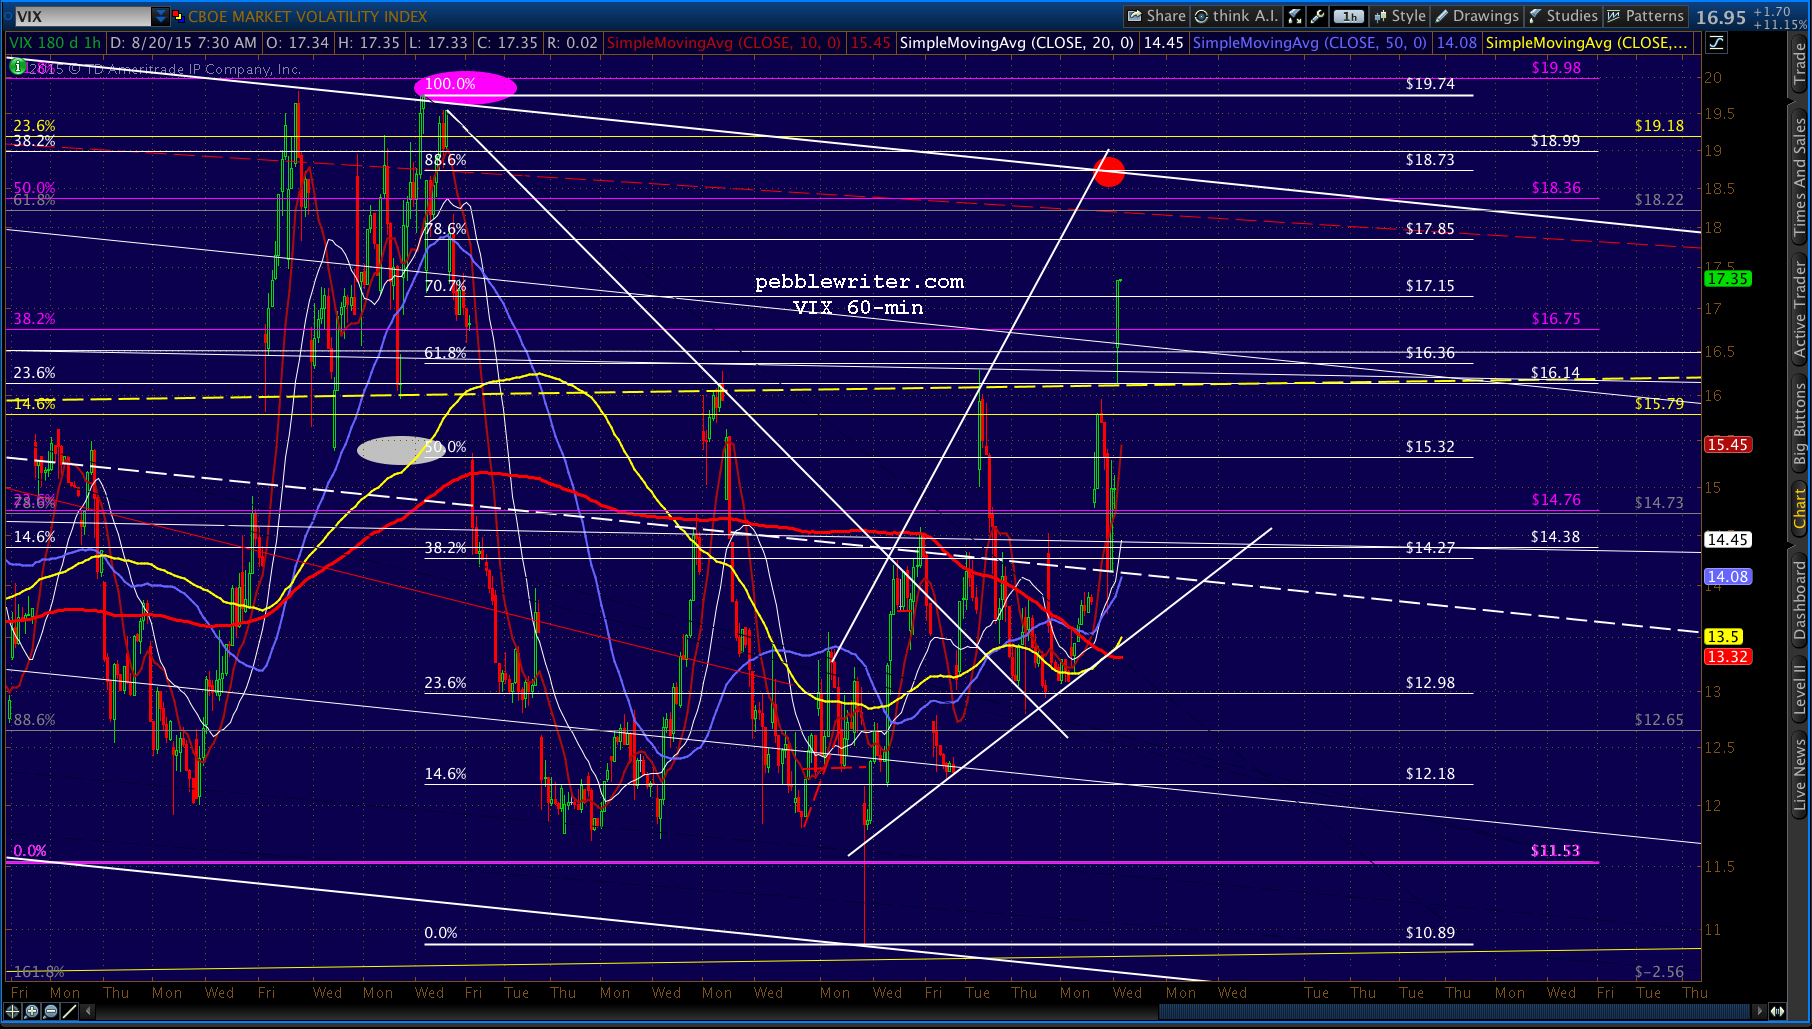 And, NKD has is testing the red .618/purple channel midline/white channel .236 line with the goal of the red H&S neckline at 19,240 clearly in sight. Any time the Nikkei declines more than 1%, it’s because the BoJ let it. In other words: it’s intentional.
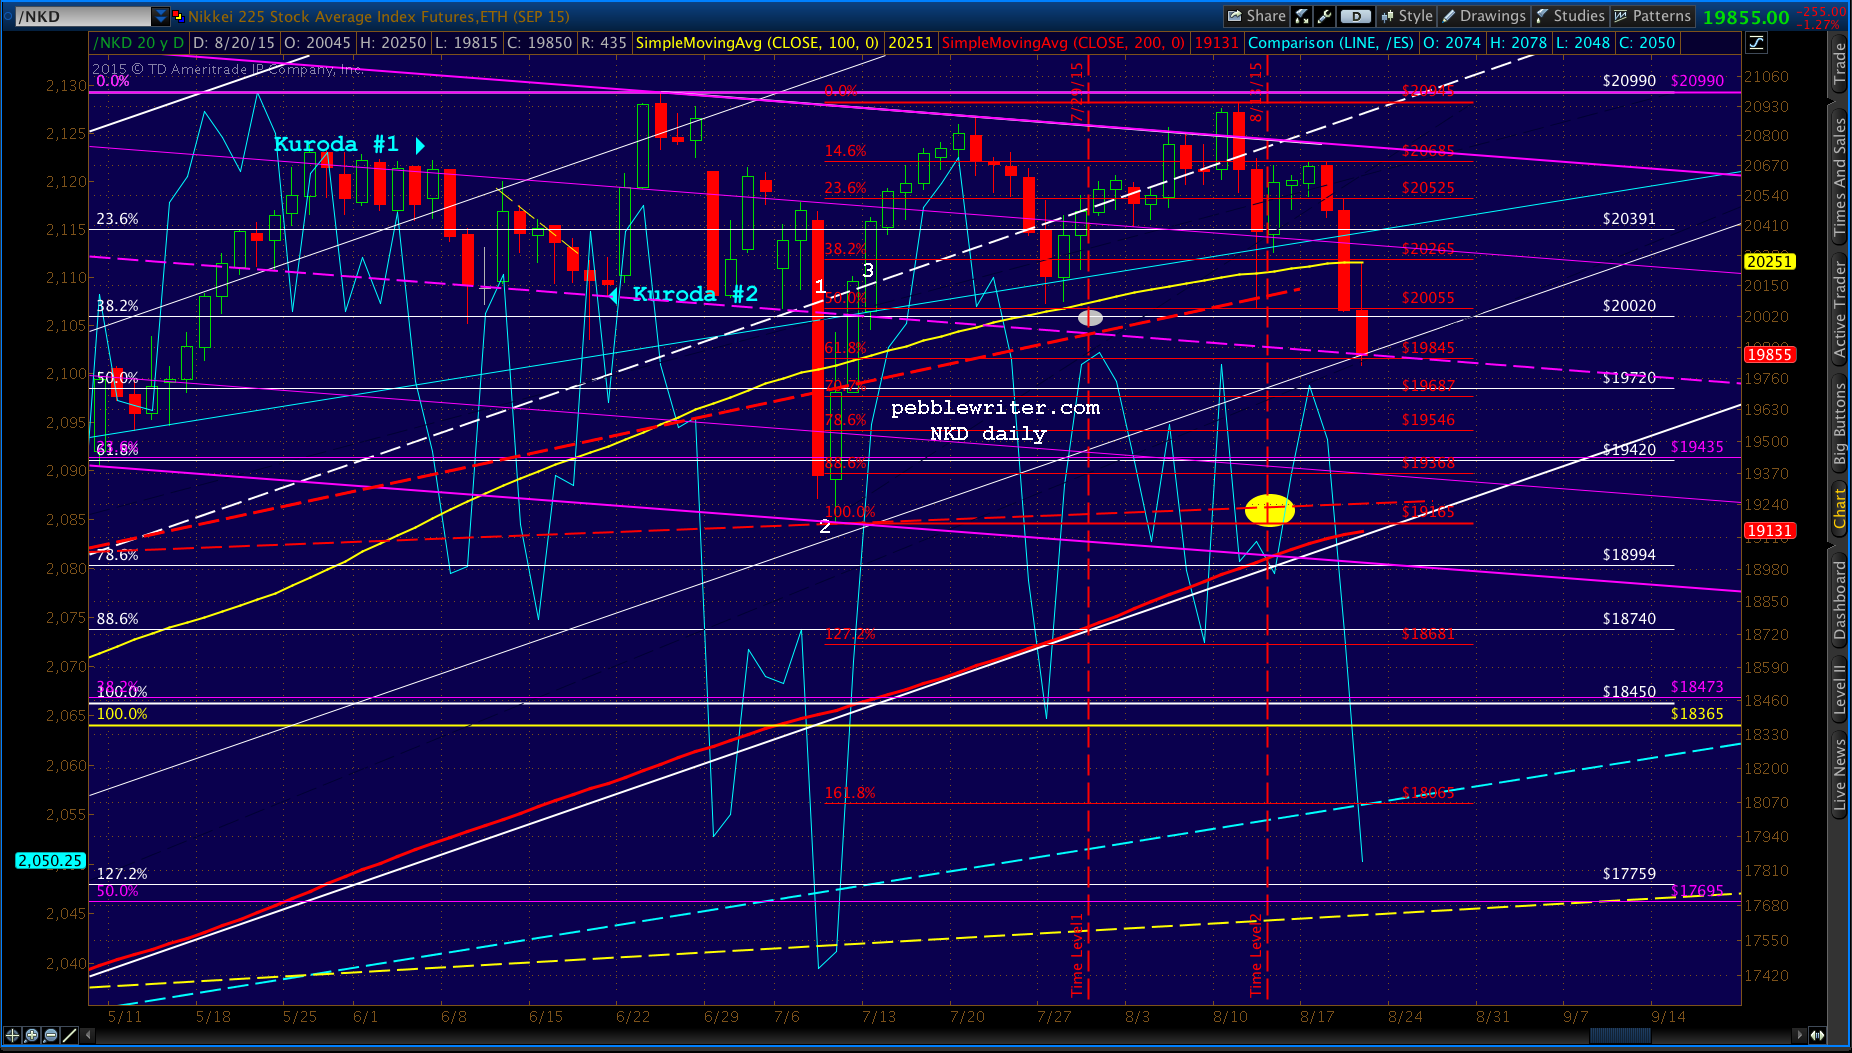
 If NKD pushes through 19,845, I’d get short again in a hurry.
UPDATE: 10:58 AM
 UPDATE: 11:08 AM
Getting close. Wondering whether it’ll respect the H&S neckline or dip below, which would obviously have more of an impact. I think at least a bounce for starters, but maybe falters after that? I’d keep a very close eye on NKD, USDJPY, CL and VIX as the moment approaches.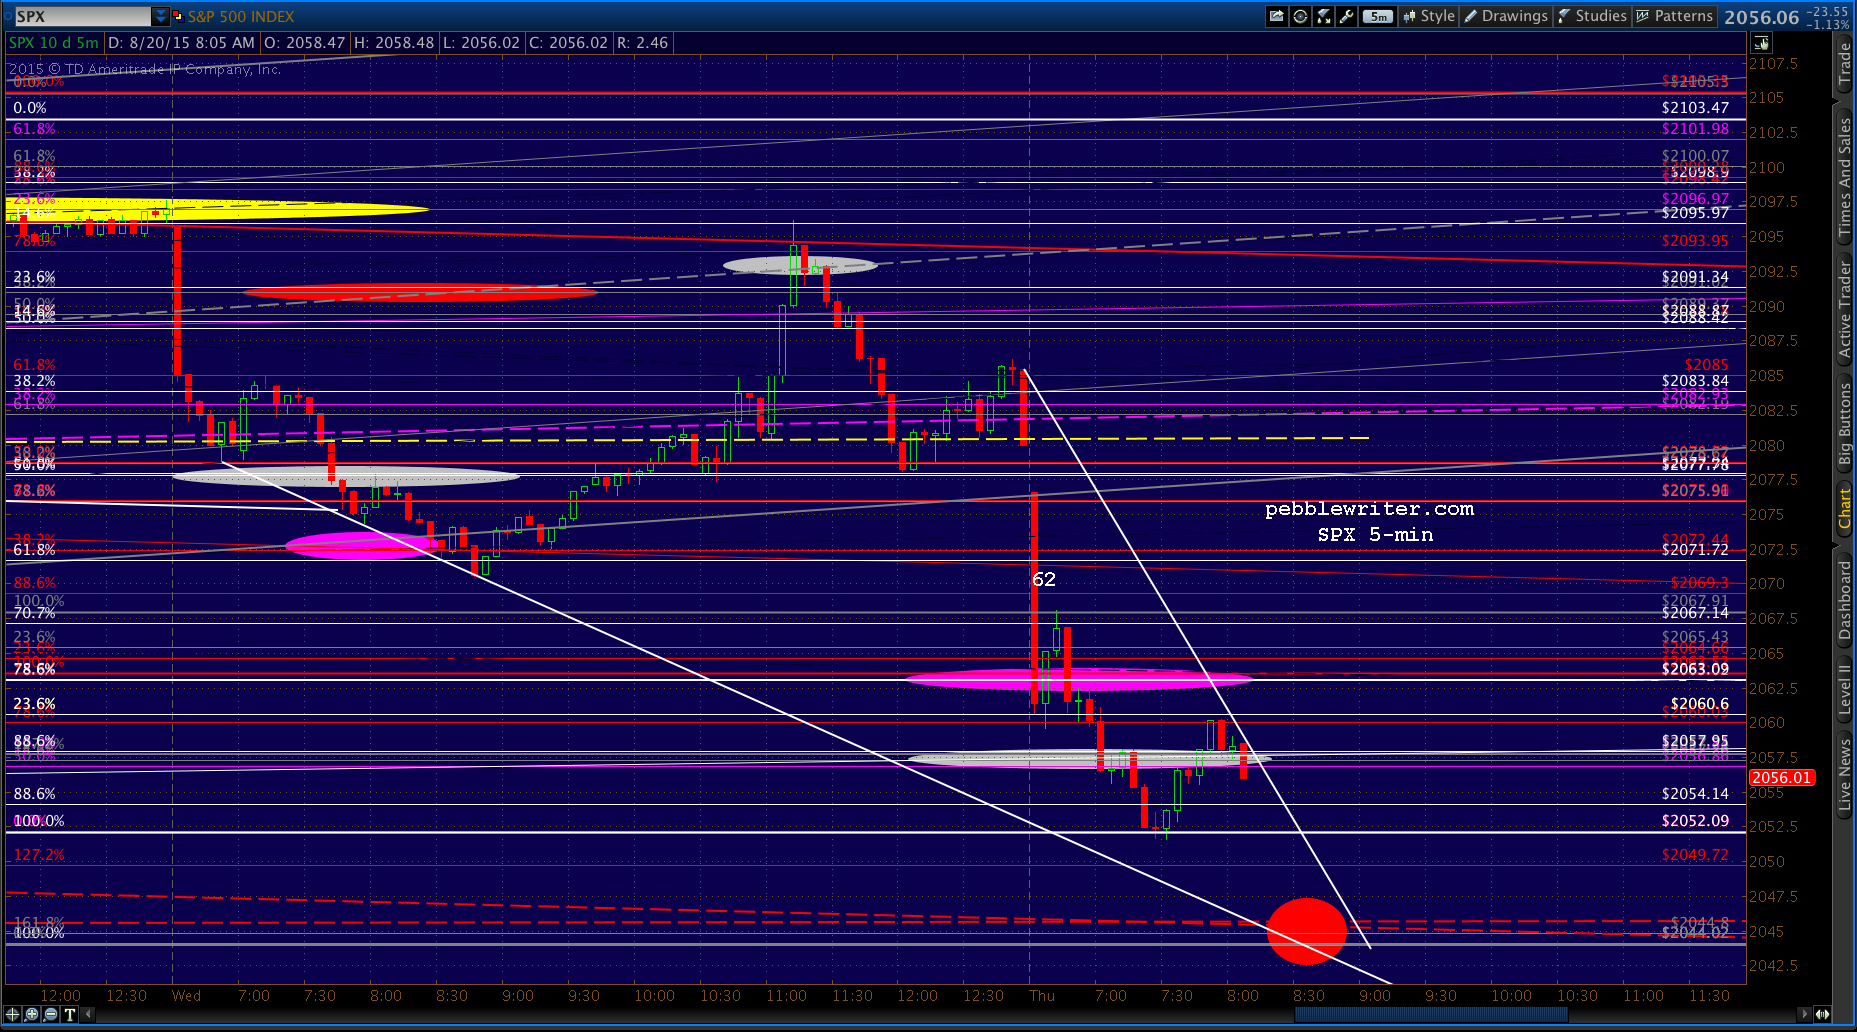 UPDATE: 1:14 PM
 Just know that there’s some more potential downside if they decide to make things “perfect.” For instance, note that VIX completed a Gartley at the .786 rather than a turn at the .886 as expected.
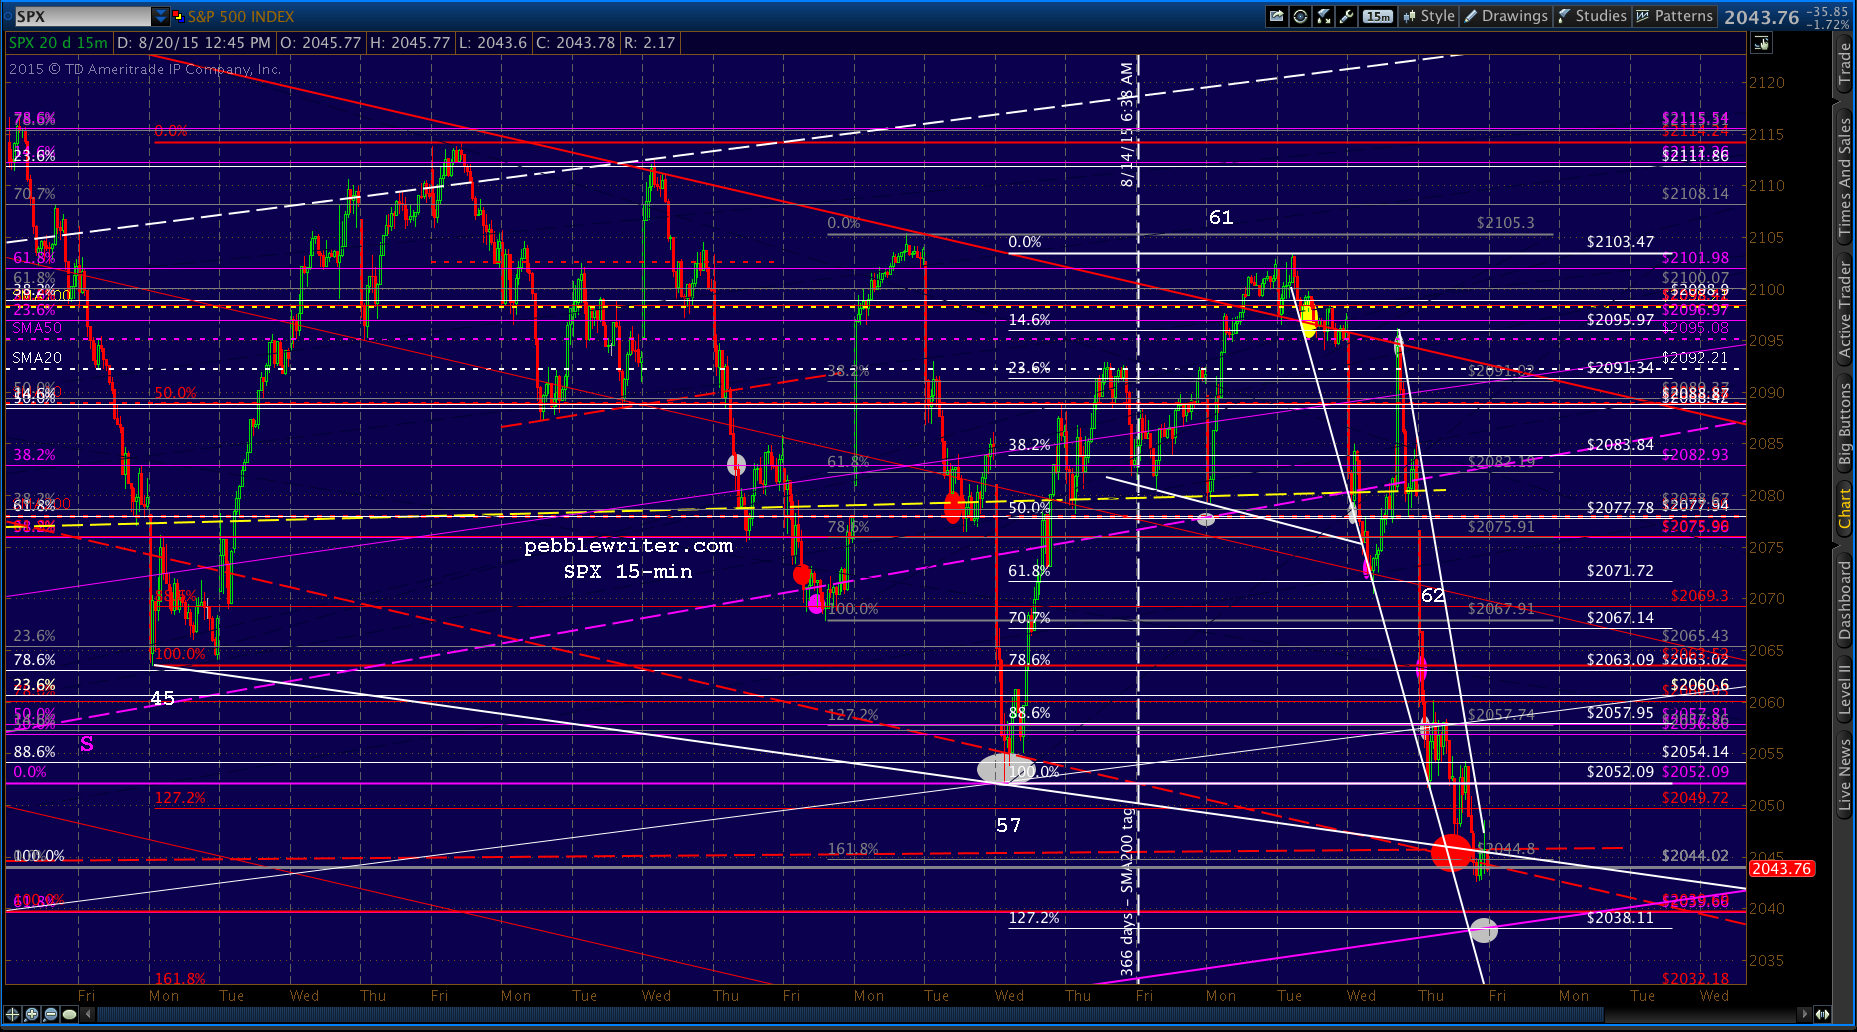
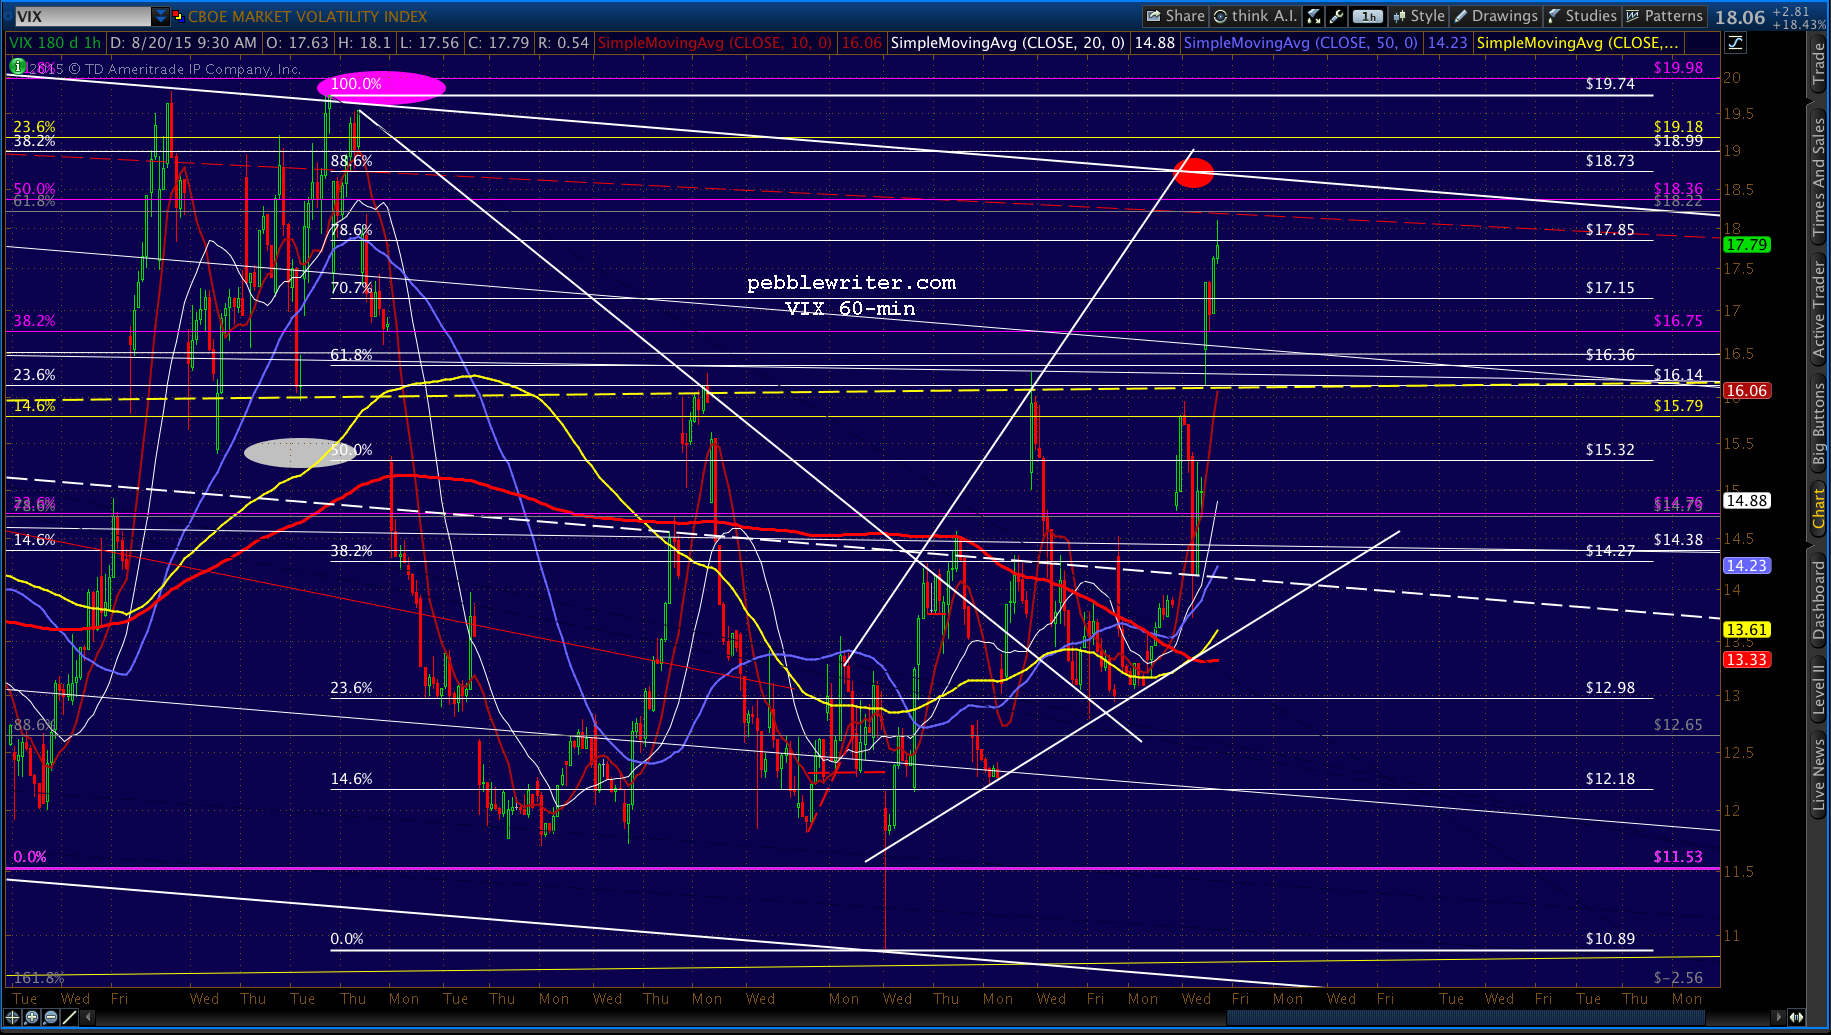 If USDJPY and NKD, in particular, don’t climb rapidly, I’ll assume this means an actual 2044 tag. Would want to see them pop through 5-min SMA10/20, for starters.
BIG PICTURE STUFF: Note that this completed H&S Pattern targets 1950, which is darn close to the white .618 and purple 1.272. It shouldn’t be that big a deal that SPX has trouble retracing .618 of its rise from Oct 15, but it has been. In spades.
It certainly wouldn’t be a threat to the bull market per se. But, it will require some fancy footwork with respect to the existing channels.
 UPDATE: 1:38 PM
Looks like there could be one last little leg down. Note that CL is potentially reversing at the red channel line. Keep an eye on USDJPY and CL.
 I’m still very enthusiastic about the 2015-2020 area. Just can’t see it happening without at least a bounce here.
Note that while ES didn’t quite drop to the TL connecting the Jul 27 and Aug 12 lows — or the 1.272 at 2042.15, for that matter — it is back above the neckline of its own red H&S Pattern. I would also watch this relationship very closely.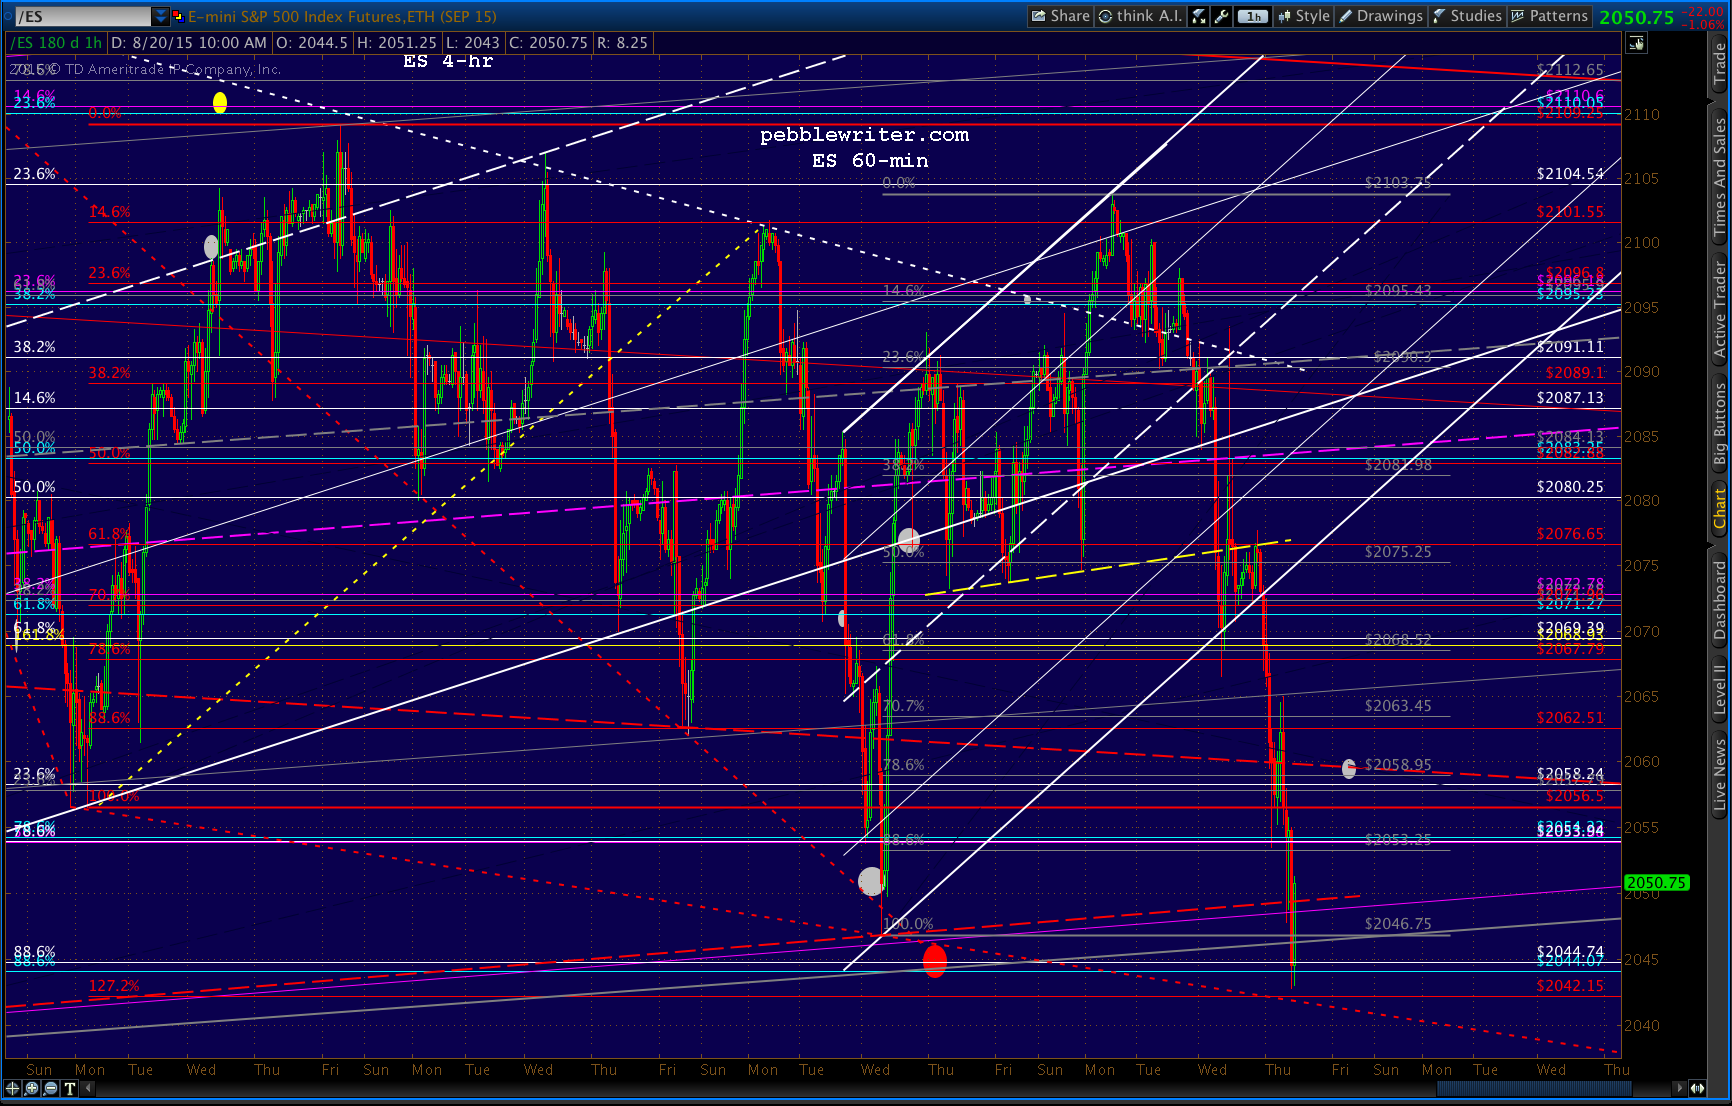 UPDATE: 2:03 PM
 UPDATE: 2:34 PM
 Note that ES tagged that TL.
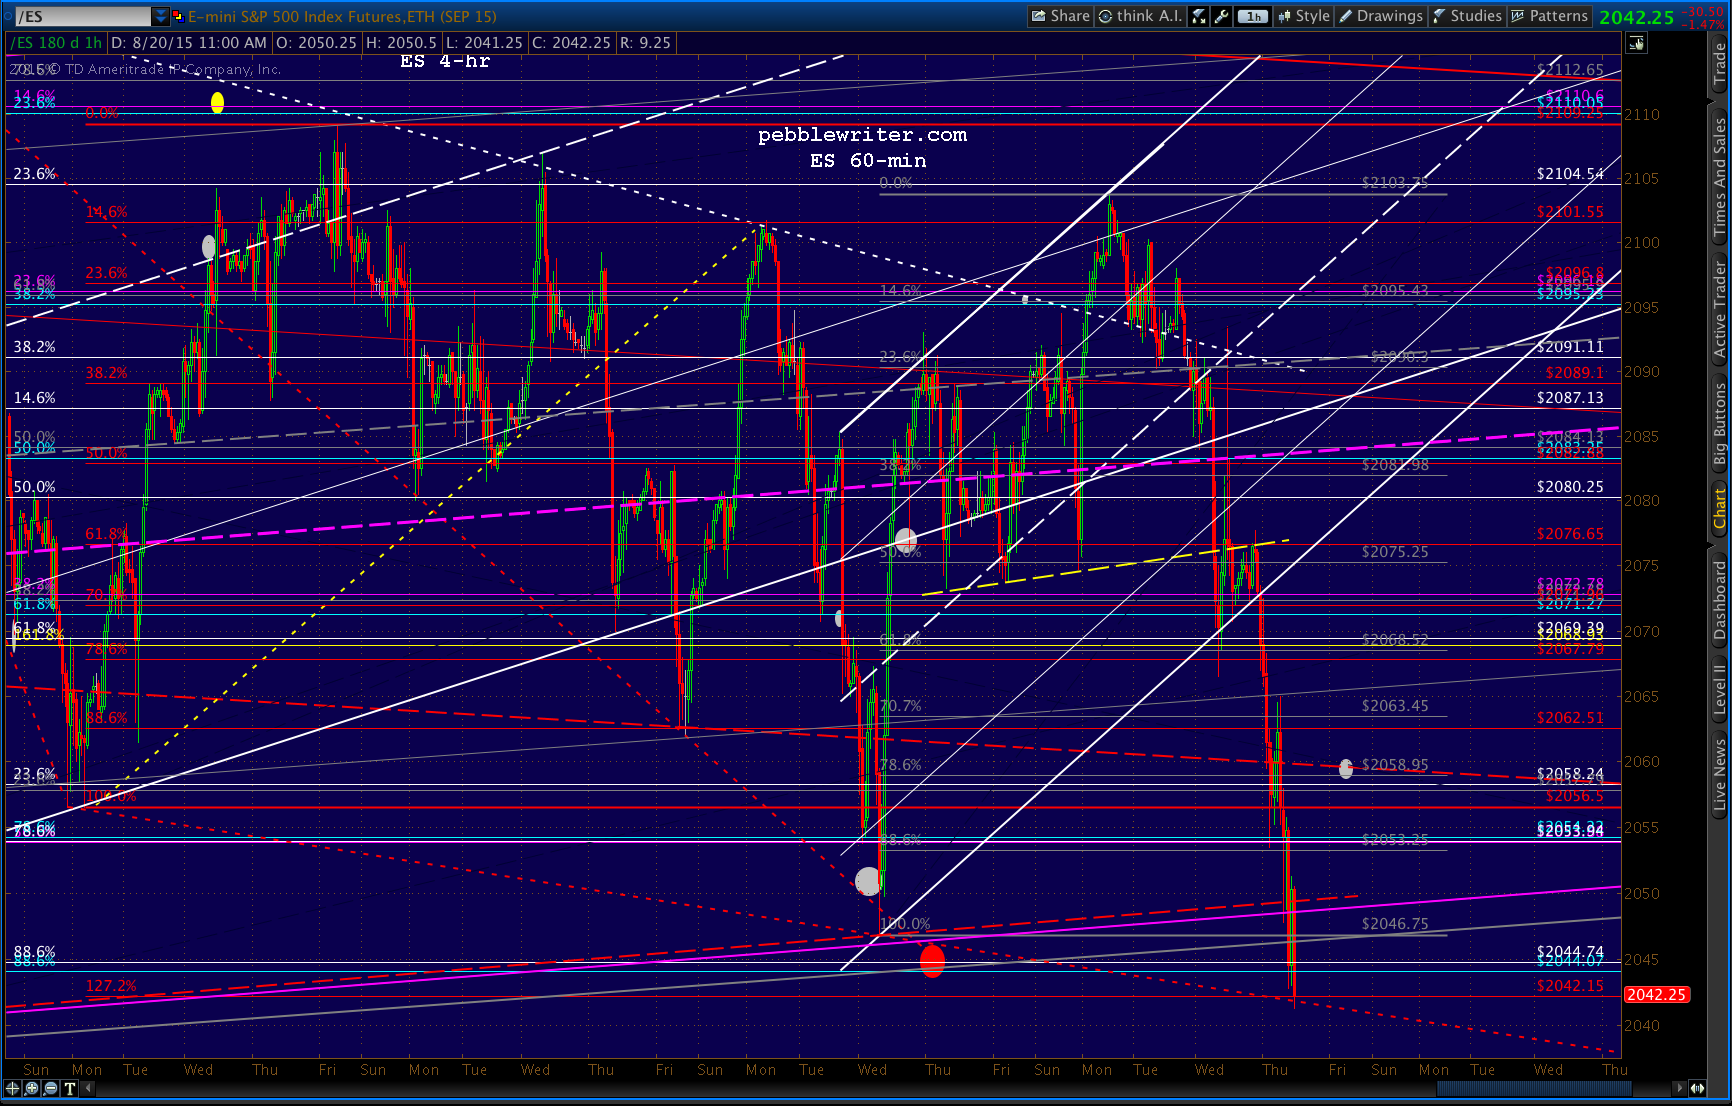 UPDATE: 3:48 PM
 UPDATE: 3:58 PM
 Check out VIX:
Comments
2 responses to “Analog Still Going?”
We close outside of 3 STD on Bollinger bands, I don’t know if I have ever seen that.
John
After all these months of going nowhere, this is a lot of movement. It’s a few days later than we planned, but it appears USDJPY is finally going to deliver.