

One of my favorite simple indicators of momentum shifts is the 10/20 cross. If the 10-day moving average moves above the 20-day, it indicates a bullish shift in momentum. If it moves below, it indicates a bearish shift.
The last time VIX experience a bullish cross was on Jun 12, whereupon ES completed a 300-pt plunge. The subsequent bearish cross on July 2 ushered in a 400-pt meltup for stocks.  Today, VIX will experience a bullish cross again. With most of our indicators agreeing, we should finally get that backtest we’ve been expecting.
  continued for members…
The SPX version:
 Arguing against a huge selloff just yet, VIX’s SMA50 (the purple line) is still below its SMA200 (thick red line.) Until this reverses, we’ll assume this isn’t the Big One as occurred back in February. The real test should come as ES/SPX backtest their Feb highs.
 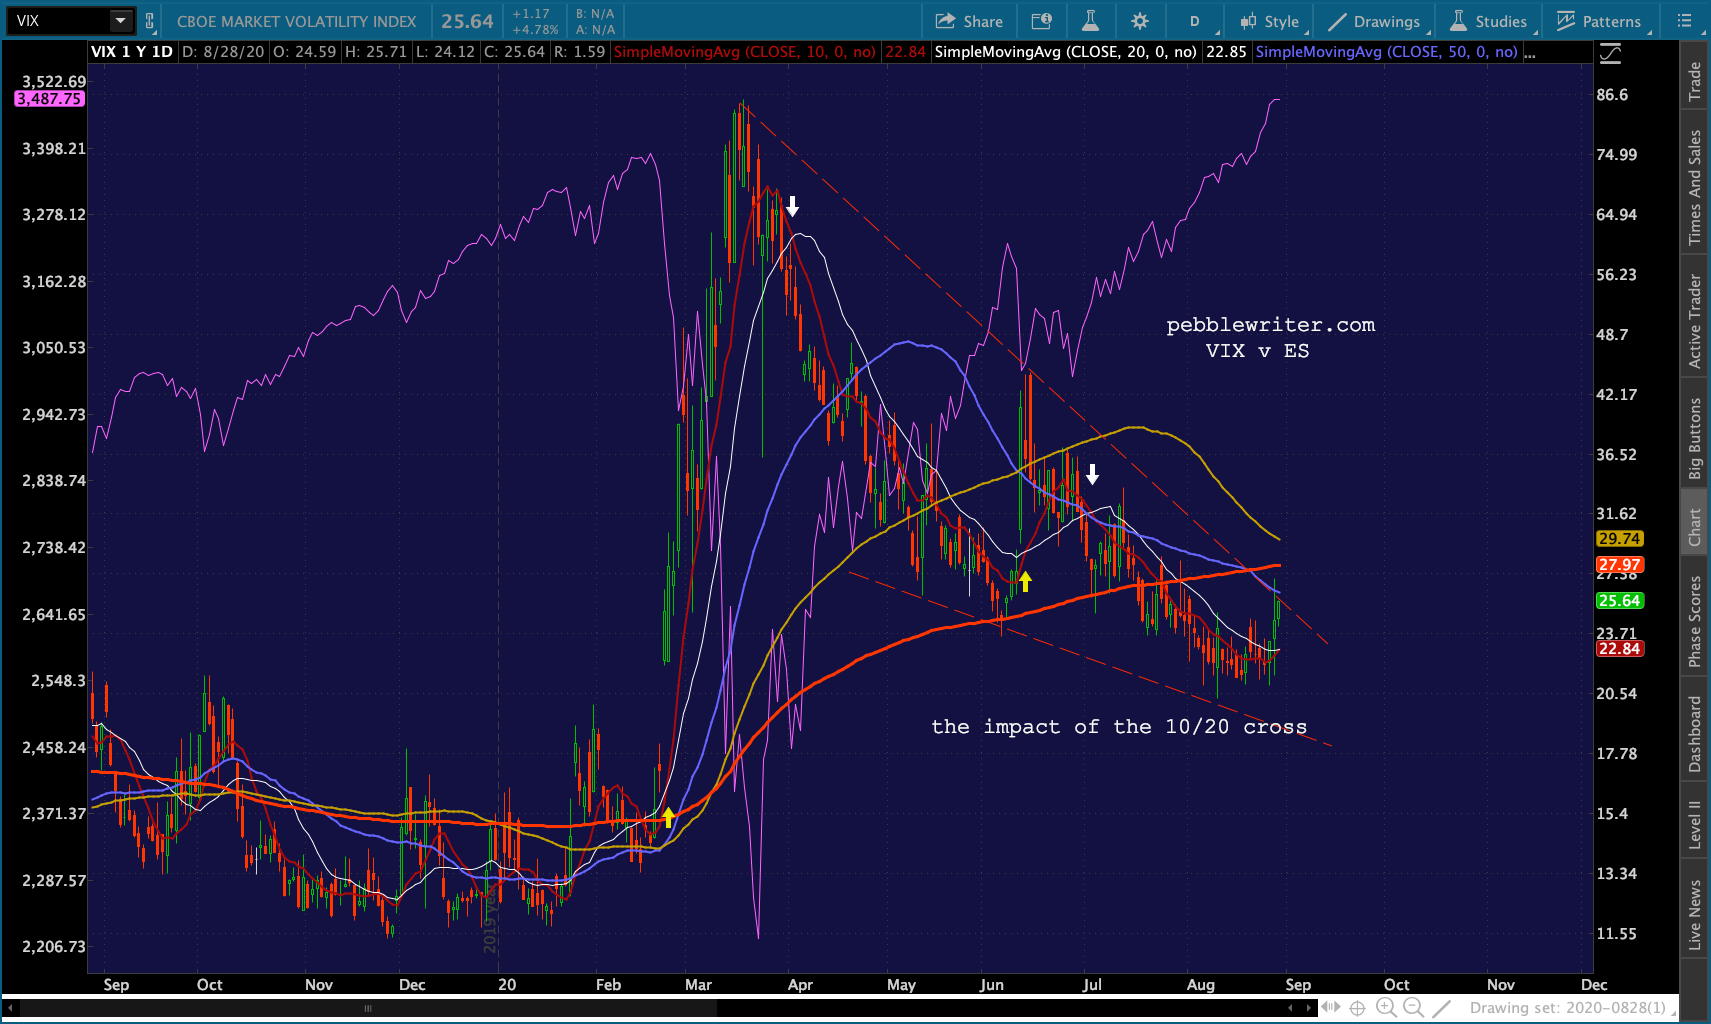 The bears are getting a little help this morning from USDJPY. The yen is strengthening on news that Abe is resigning for health issues. Abe was the first leader of a major economy to embrace negative rates and massive QE in the wake of the GFC.
 This puts pressure on the NKD, which is back below its red .886 – four separate failures to break out, now.
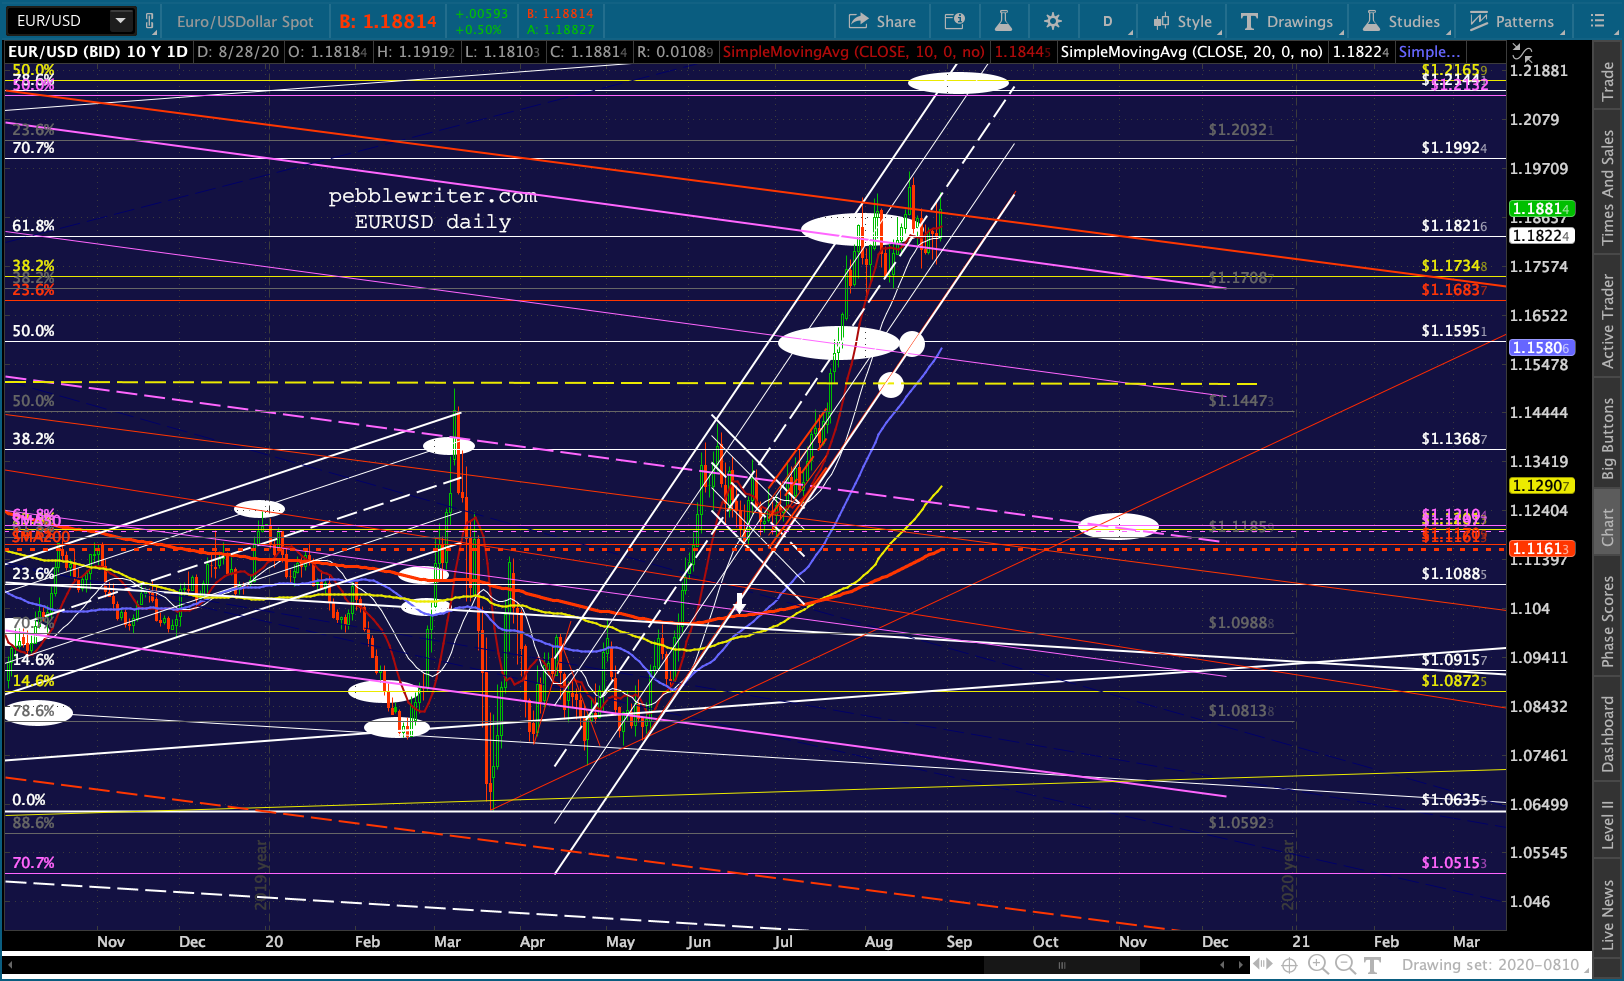
 This will also nudge DXY that much closer to our 91.358 target and again put pressure on EURUSD to break out.
 It should also provide a boost to GC and SI which have been threatening to break TL support for the past two weeks. The Fed’s newfound fondness for inflation as expressed yesterday hasn’t hurt.
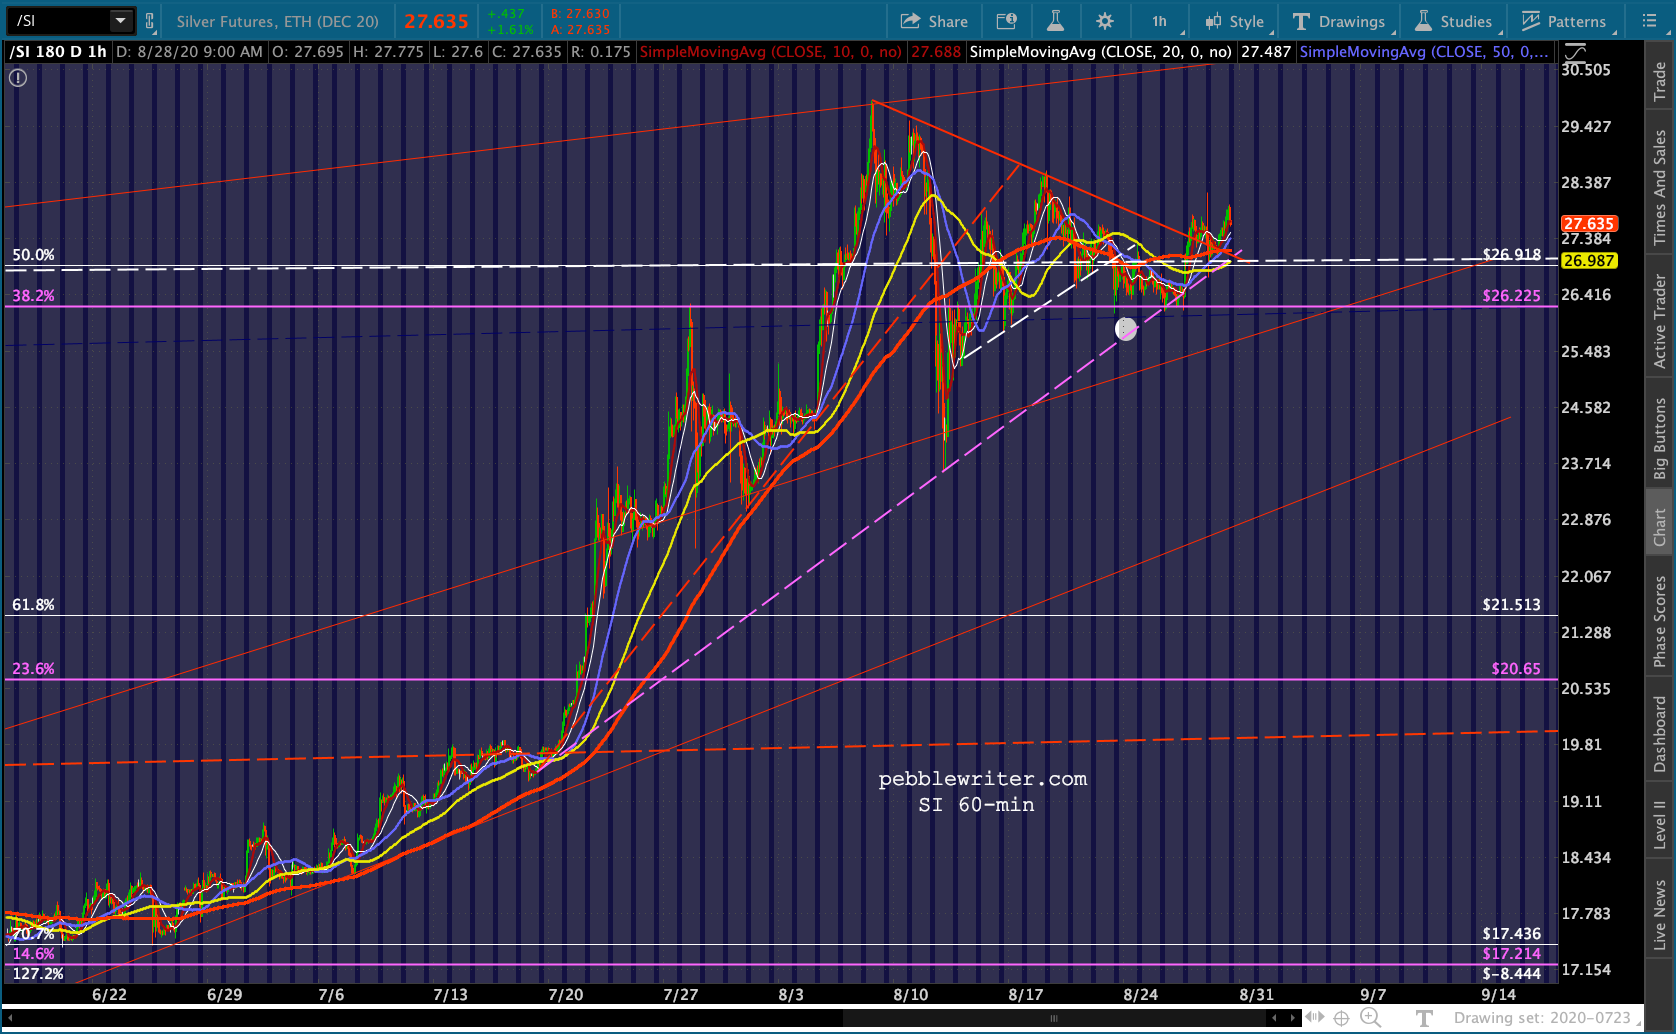
 It has also jolted rates. The 10Y popped up to .746% yesterday, but is since settling lower. Remember, a sharp decline in stocks would remedy that in a jiffy.
 Note from the close-up below that we’ll get plenty of warning when a breakdown occurs.
 Oil and gas have each located a new TL of support affording a higher low but (for now) preventing a breakdown. Since the hurricane was mostly a non-event and summer is pretty much over, it will be harder to come up with any fundamental excuses for higher prices.

Last, note that AAPL, AMZN and COMP are all still failing to break out. When leadership fails, it makes a correction that much more likely.

 UPDATE: 2:50 PM
So far, we’ve seen VIX get hammered 14.4% from yesterday’s highs — all in order to save ES/SPX from breaking down. Note that at this point, the 10/20 cross has been unraveled. If VIX were to continue collapsing, the cross could probably be averted altogether.
Don’t be surprised if taking a short position means taking a leap of faith that the market will gap down on Sunday/Monday. I have to jump on a long conference call at 3, so will catch up with the market either later this evening or sometime tomorrow. 


 GLTA.
GLTA.
UPDATE: 4:50 PM
A 16.4% hammering for VIX, an unwinding of its bullish (bearish for stocks) 10/20 cross, and SPX/ES broke out of the little falling channels they were in for a gain on the day. It’s SPX’s 7th straight daily gain, 5th straight weekly gain and 5th straight monthly gain. So far, it’s the best August since 1986 when, as I recall, there was no pandemic to reckon with. But, no bubble here. No siree.


 I just came across this market commentary, which I’ll post as is.
Wall Street experts have suggested that stock prices had risen in the last few weeks on the erroneous notion that the nation’s economy was improving. If so, that would help corporate earnings to grow, presumably bringing a rise in the price of stocks.
Last week, for instance, the stocks of companies in the technology industry met a revival of interest as investors wagered that business conditions were improving enough to snap the yearlong order slump for computers and other sophisticated equipment.
”Everybody started making some very significant bets on the economy,” said Laszlo Birinyi, manager of equity market analysis for Salomon Brothers, the investment house. ”I think there really wasn’t any justification.”
With the economy and interest rates becoming too difficult to predict, many investors apparently decided it was time to pocket some of their paper profits. ”They just pulled the rug out from underneath the market,” Mr. Birinyi said.
Those who have been investing for more than a few years probably recognized a typo in the above: “Salomon Brothers?” This commentary was printed in the New York Times on September 12, 1986 following a 4.61% drop in the Dow the day before. The article, which is eerily evocative of today’s climate, makes for interesting reading. CLICK HERE.
Following a 25 year consolidation that included some nasty recessions, DJIA broke out and soared from 1000 in October 1982 to 2747 in October 1987.  But, it was in 1986 that it experienced one of its biggest single-day drops ever. You can’t even see it on the monthly chart above, as it’s dwarfed by the October 1987 crash. But, it’s pretty obvious on a close-up of the daily chart below.
 DJIA had gone through another consolidation phase, and made a slightly higher new high a few days before when, as the NYTimes described it…
Wall Street was badly shaken yesterday by a steep drop in stock prices as investors decided they had waited long enough for the bull market to resume.
The Dow Jones industrial average, which just last week seemed perched solidly at record heights, plunged 86.61 points, to 1,792.89, in the busiest session in New York Stock Exchange history. A record 237.6 million shares changed hands, up sharply from 140.3 million the day before.
Amid the frenzy of activity at the Big Board, stock market professionals expressed fear and puzzlement as the Dow Jones average plummeted more than 60 points by noon. Until yesterday the biggest drop in the Dow Jones average had been that of July 7, when it lost 61.87 amid growing concern about the nation’s economy. The previous volume record was 236.56 million shares, on Aug. 3, 1984.
Comparison With 1929
In percentage terms, however, yesterday’s decline – a 4.61 percent drop – was not nearly the worst ever seen. That occurred on Oct. 28, 1929, when the Dow Jones industrial average plunged 38.33 points, or 12.82 percent. Thus began the stock market crash that ushered in the Great Depression. Yesterday the Dow Jones average would have had to fall about 240 points to match the 1929 decline in percentage terms.
The market’s steep drop was touched off, as it had been several times before, by a deterioration in the bond market, where investors worried that foreign governments, particularly West Germany and Japan, were not cooperating with the United States in lowering interest rates. [ Page D1. ] The trading volume soared as big and small investors alike swamped brokers with sell orders after interest rates rose unexpectedly. The average share on the Big Board fell $1.76. In all, 1,695 issues declined in price while only 168 advanced.
”I’ve never seen anything like this,” said Stephen Weisglass, chairman of the executive committee at Ladenburg, Thalmann & Company, a brokerage firm. ”I think money managers panicked. A lot of stocks that ran up over the last six months have been sold indiscriminately.”
It’s a good thing we haven’t had any “very significant” yet “unjustified” bets on the economy lately.
 Have a great weekend, everyone.