Buy-and-hold investors are no doubt pleased with today’s new all-time highs. A review of the past two years, however, shows that traders who are tempted to chase stocks here should be very careful.
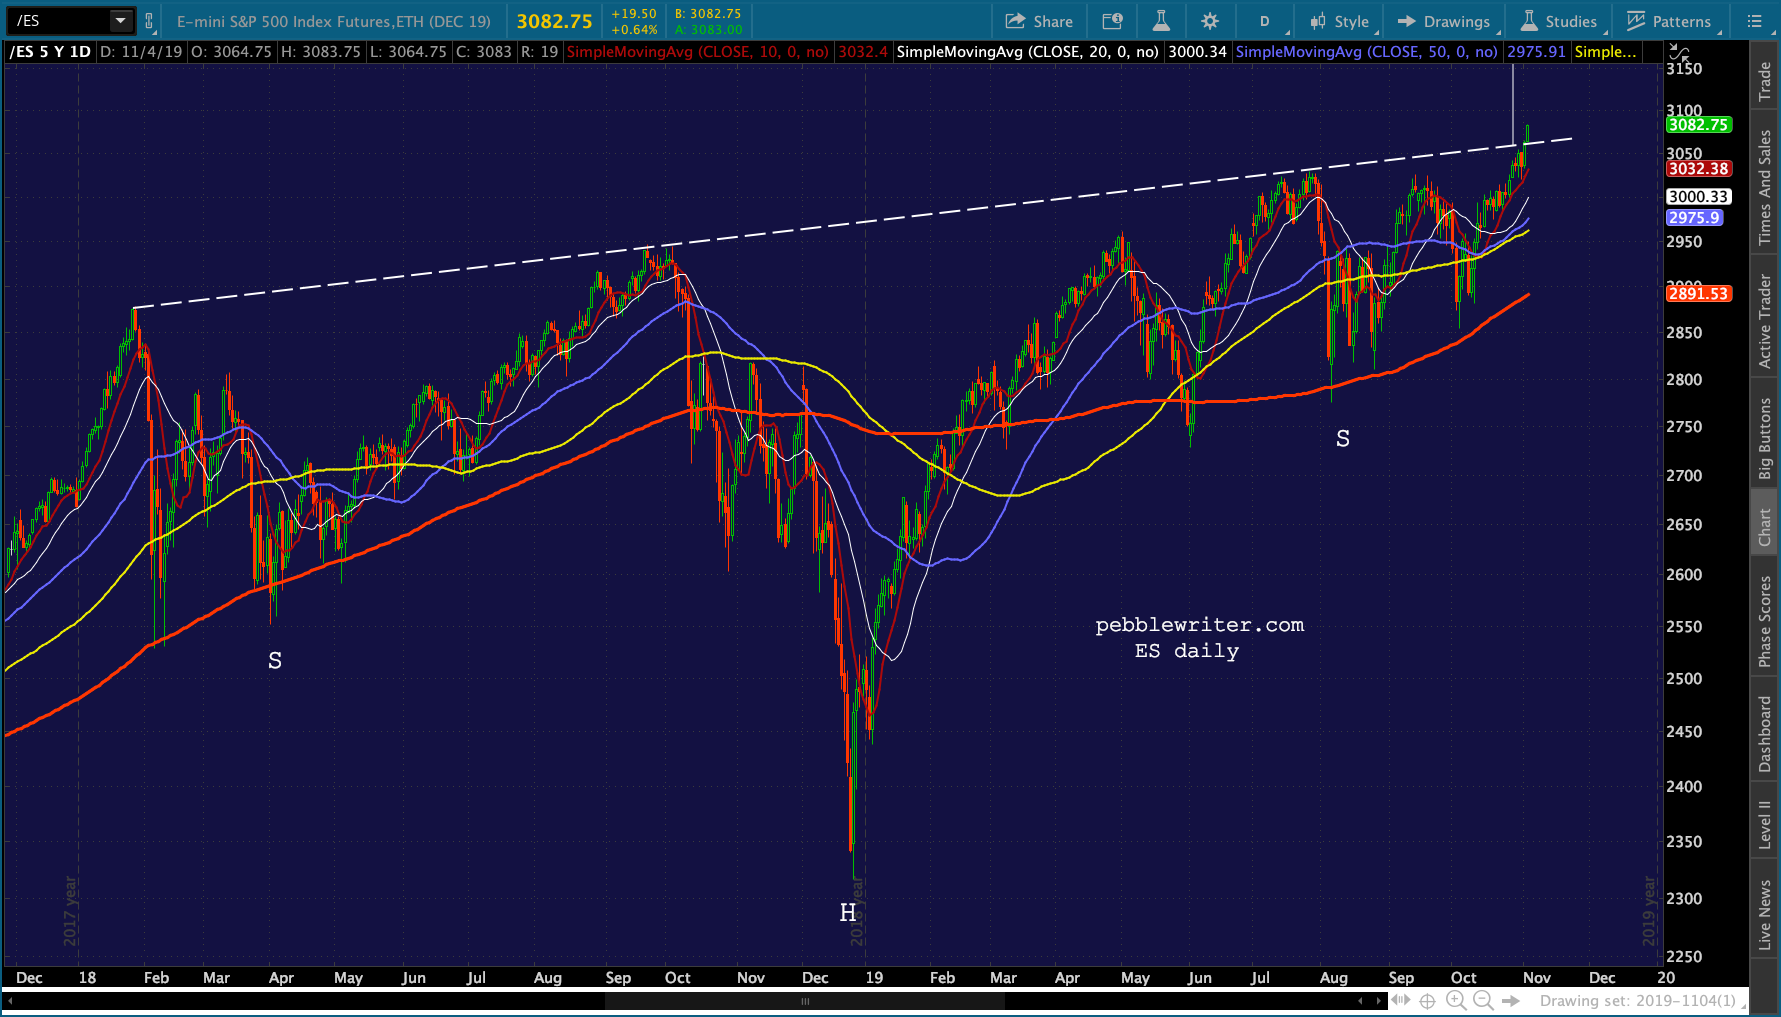
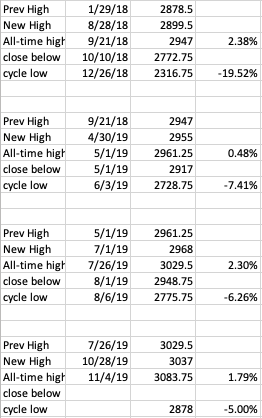
This is the 4th breakout to new highs since January 2018. The figures below show limited upside in the days following each breakout compared to the losses incurred once the breakout failed. The average cycle gains averaged only 1.29% while the subsequent losses averaged 8.30%.
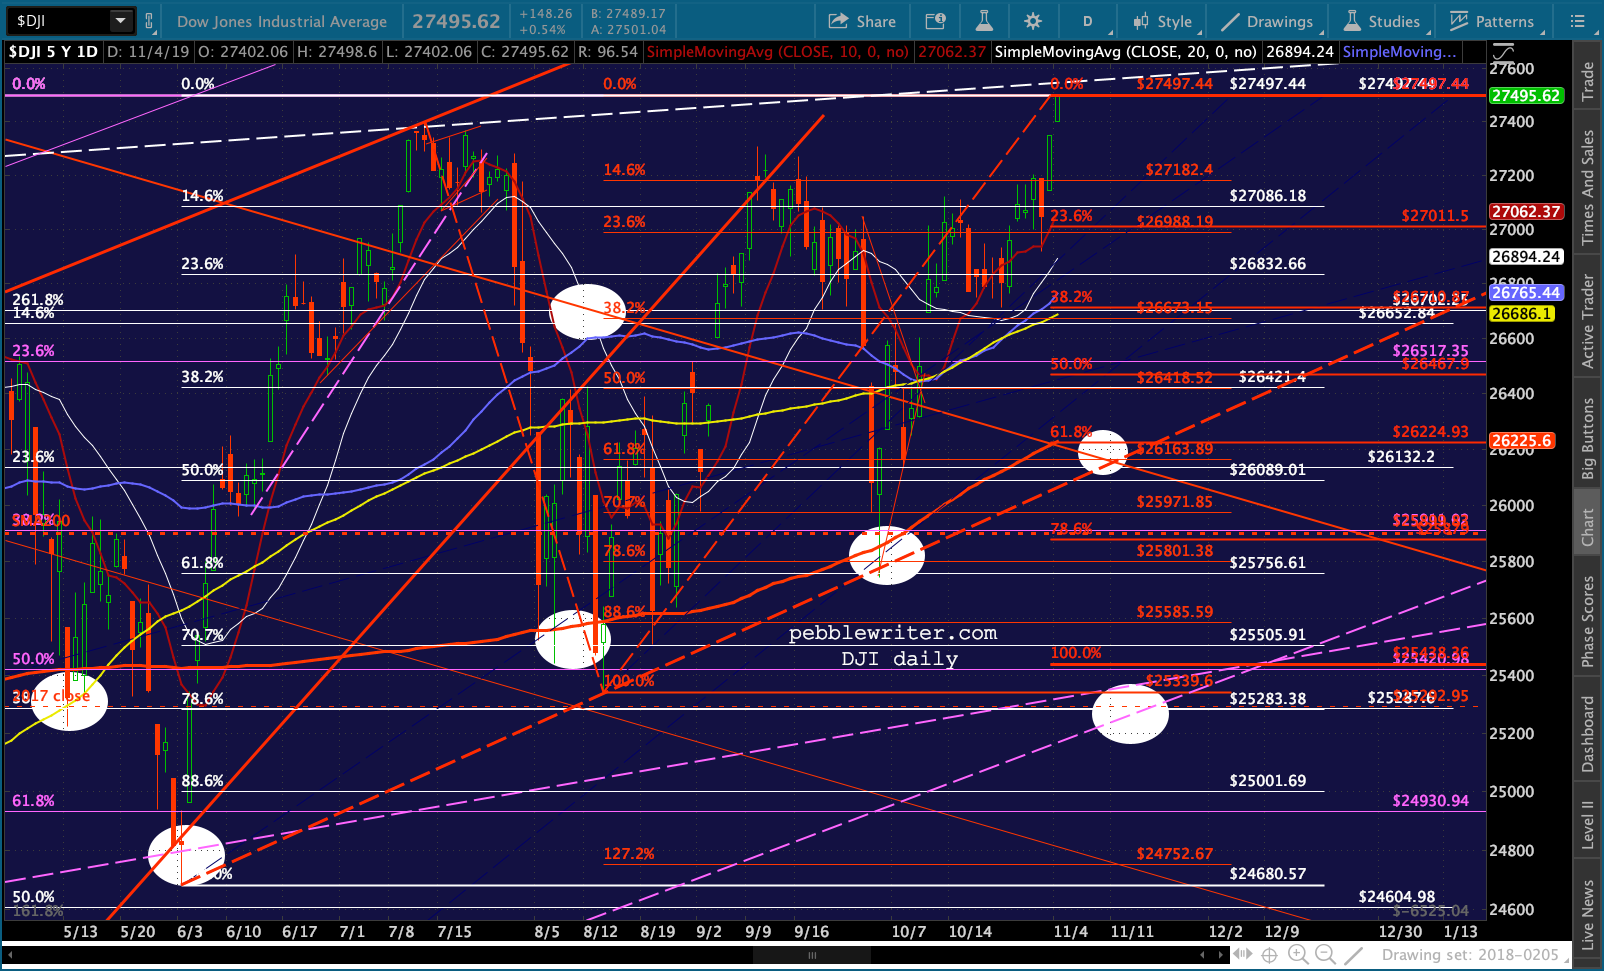
If ES were to top out here at 3083.75, it would represent a 1.79% gain above the Jul 26 highs — right in line with previous breakouts. A drop to the TL connecting previous lows, slightly below the SMA200 at 2891, would produce a 5% loss — the smallest of the four previous cycle drops.
 There’s something different about this breakout, of course. ES just completed an Inverted Head & Shoulders Pattern targeting 3717 — a 20% gain from here, if today’s new highs hold.
So, what happens next is critically important to the outcome for the coming year. Is the market really breaking out in pursuit of another 20% gain, or is this merely an exercise to ramp the Dow up to new highs? There are a lot of folks who need such a headline.
continued for members…
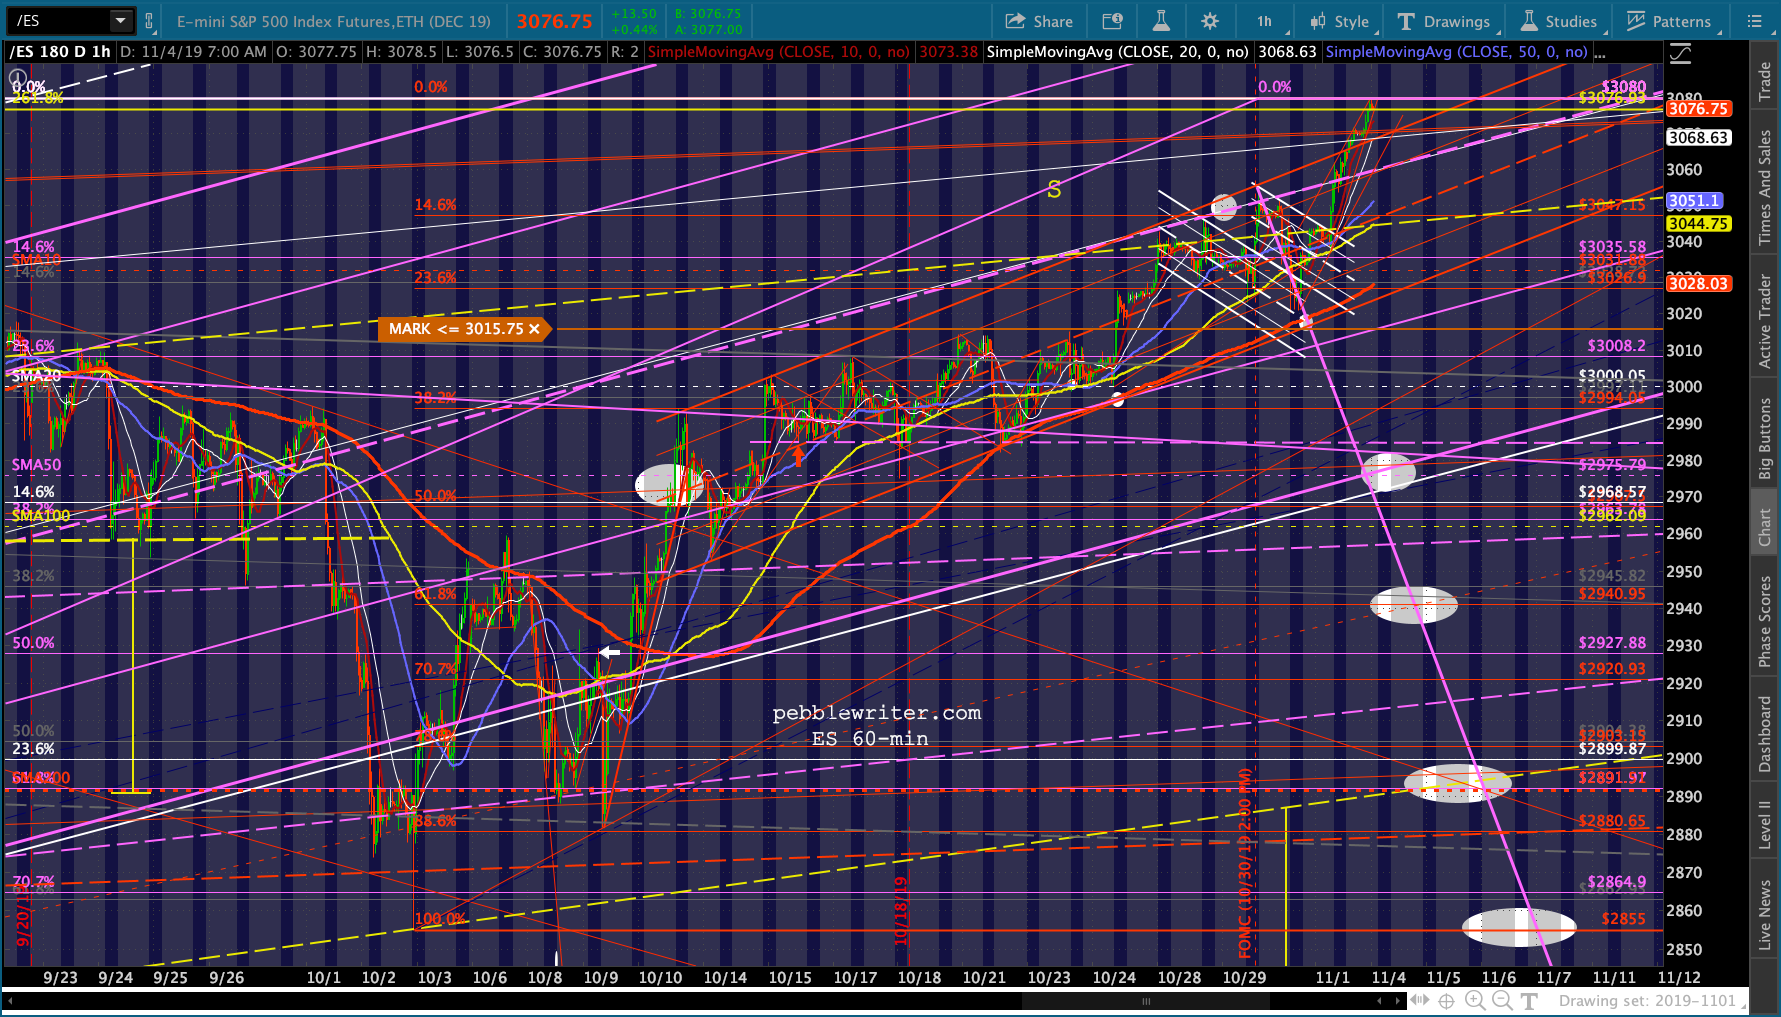
I sincerely doubt the IH&S will be allowed to hold — at least yet.
 The key will be holding ES’ 2.618 extension — which has clearly been the goal over the past 16 hours.
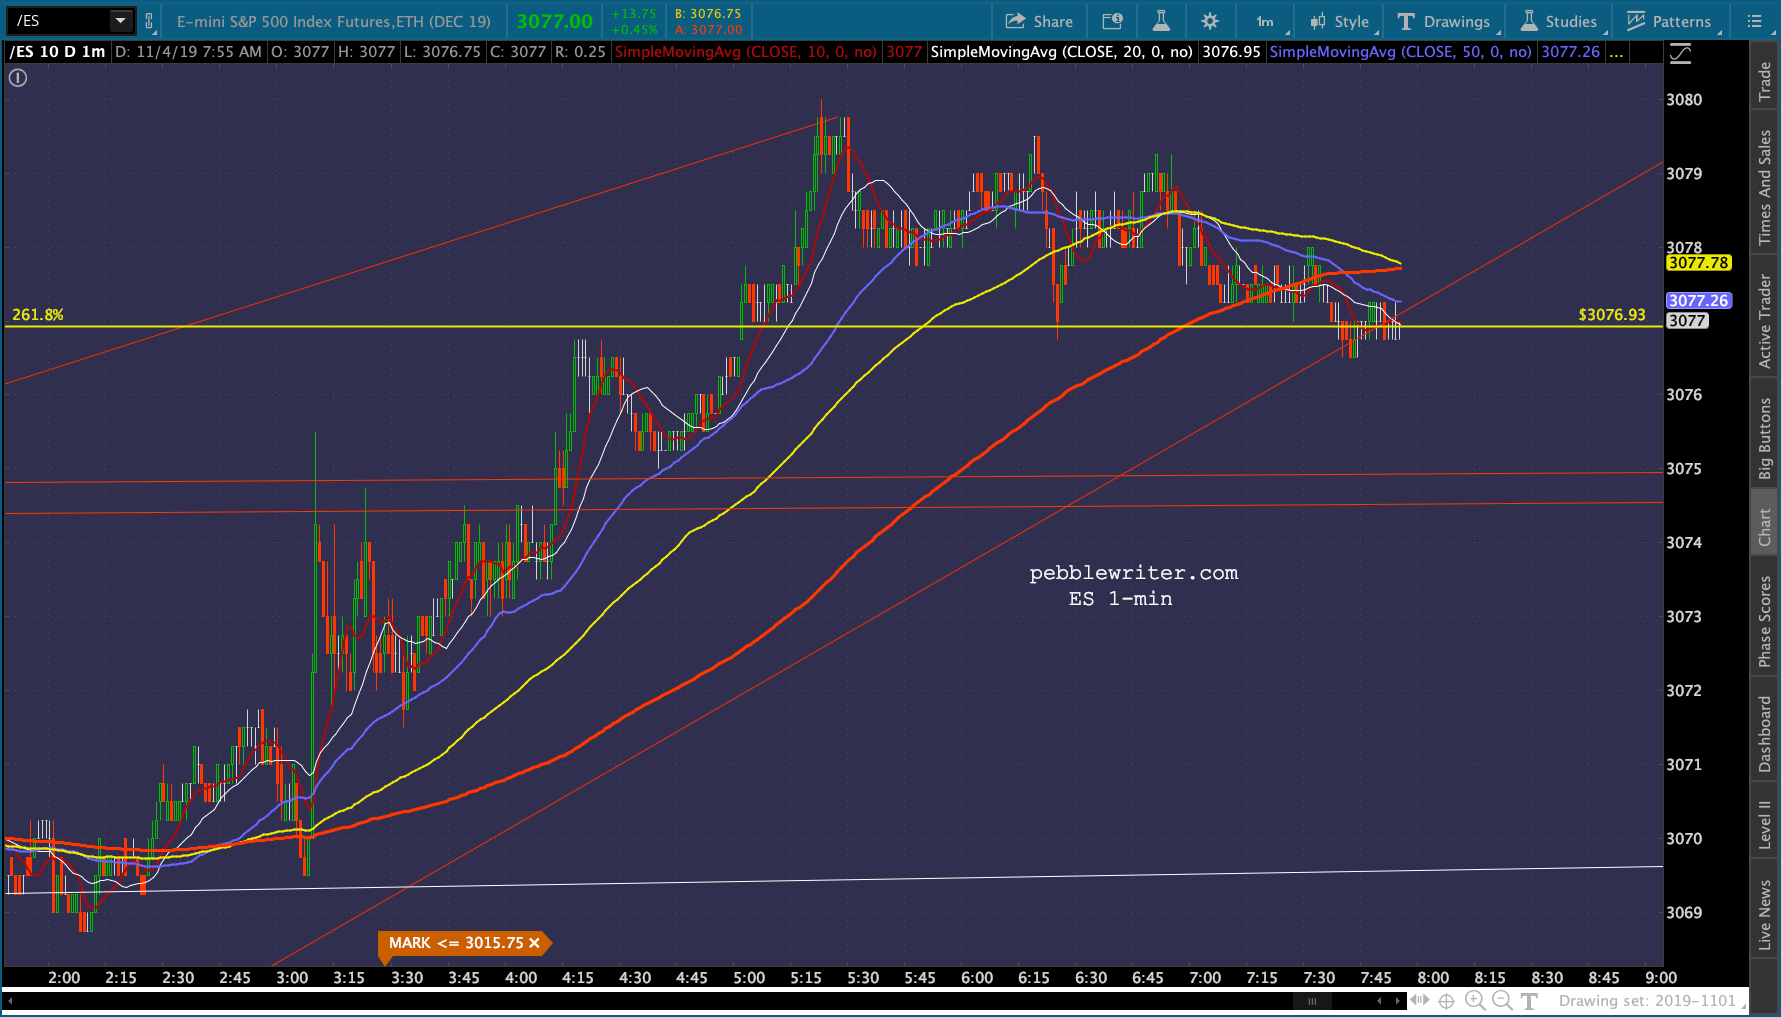
For those who love digging into the numbers…
 As we discussed last week, I think this is all about running stops and writing headlines for the Dow making new all-time highs. As of 9:40 AM:
 And, let’s not forget about RUT — which is testing 1600 for the 5th time since May.
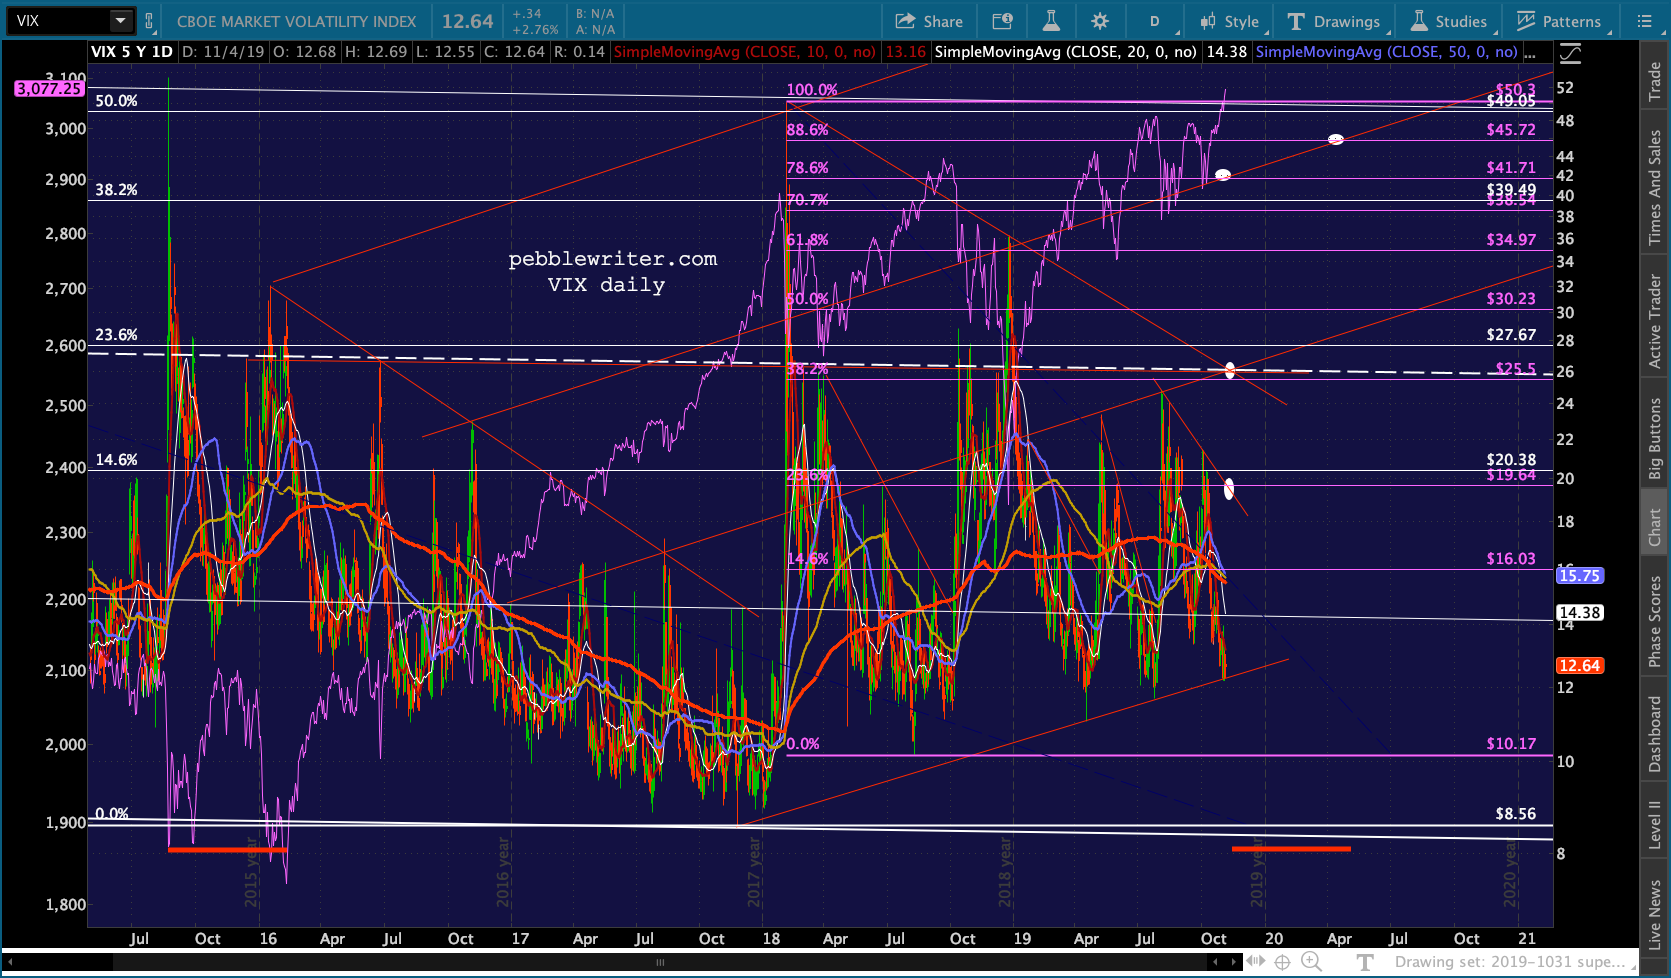
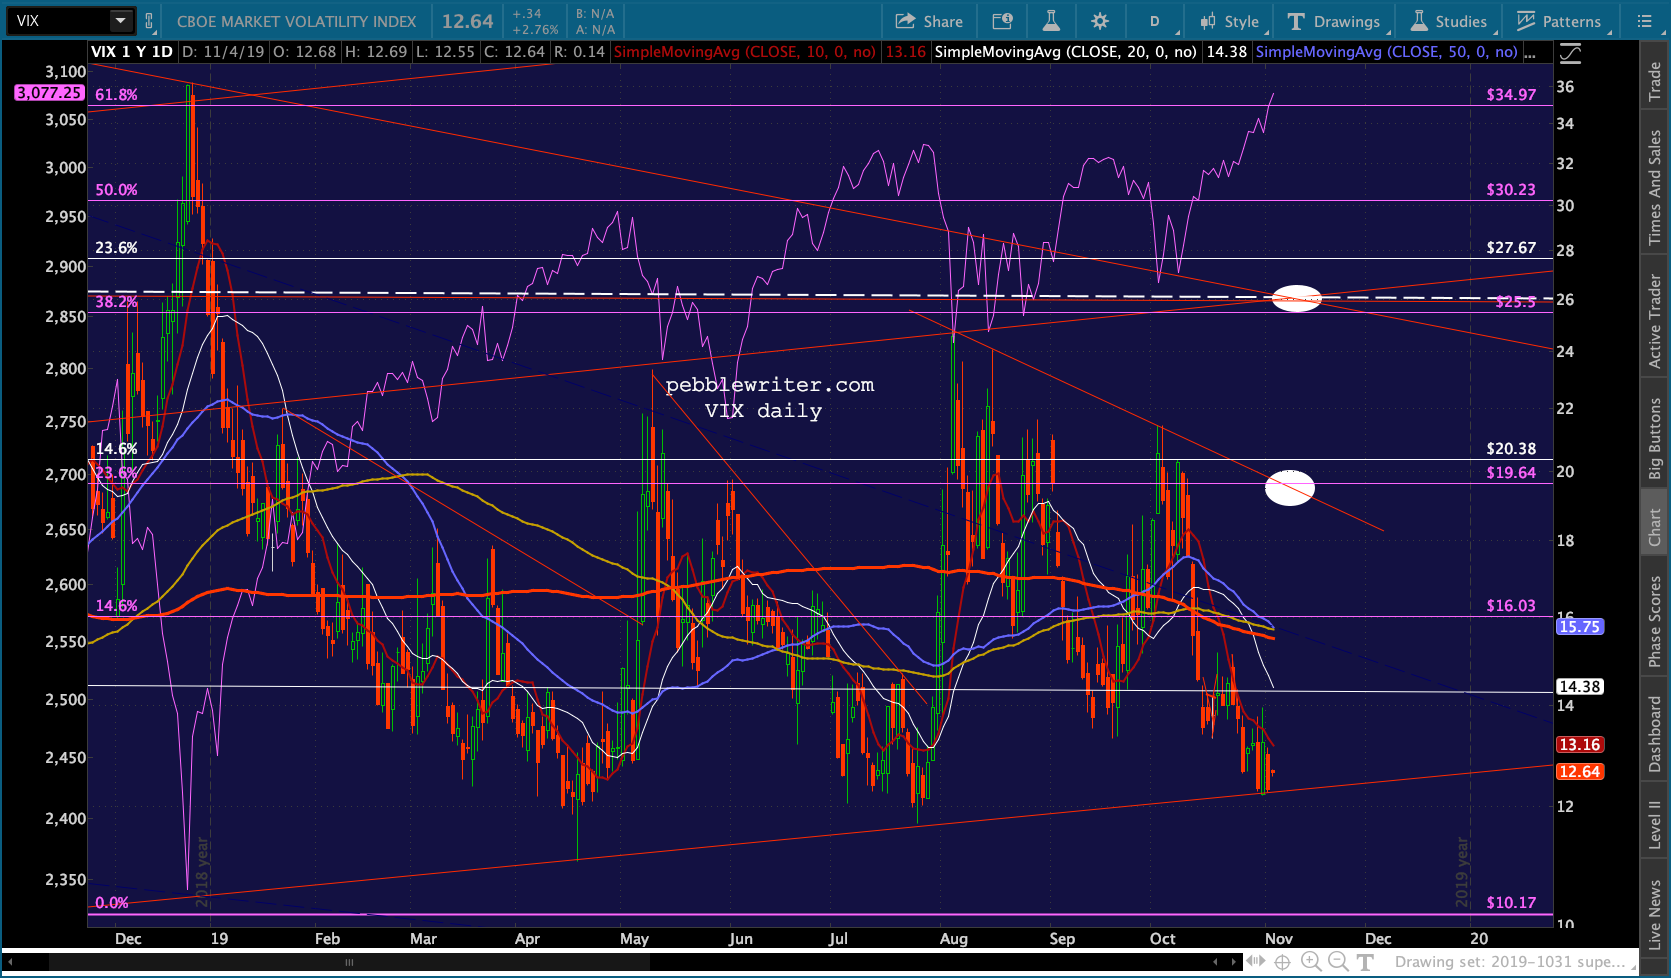
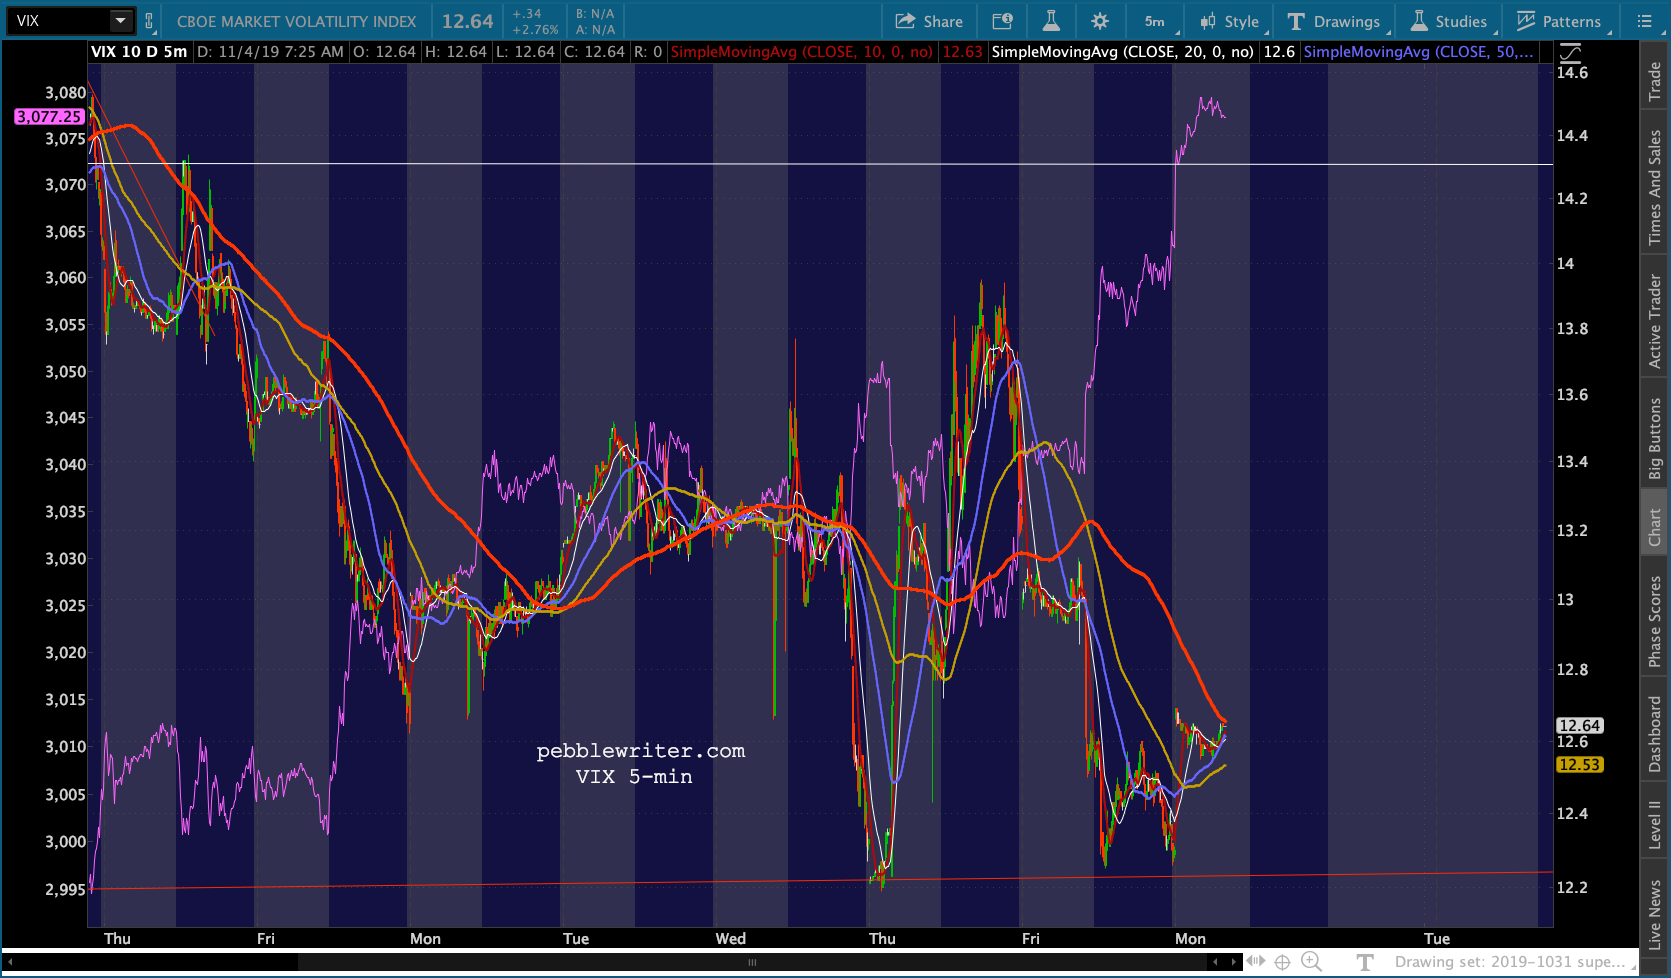
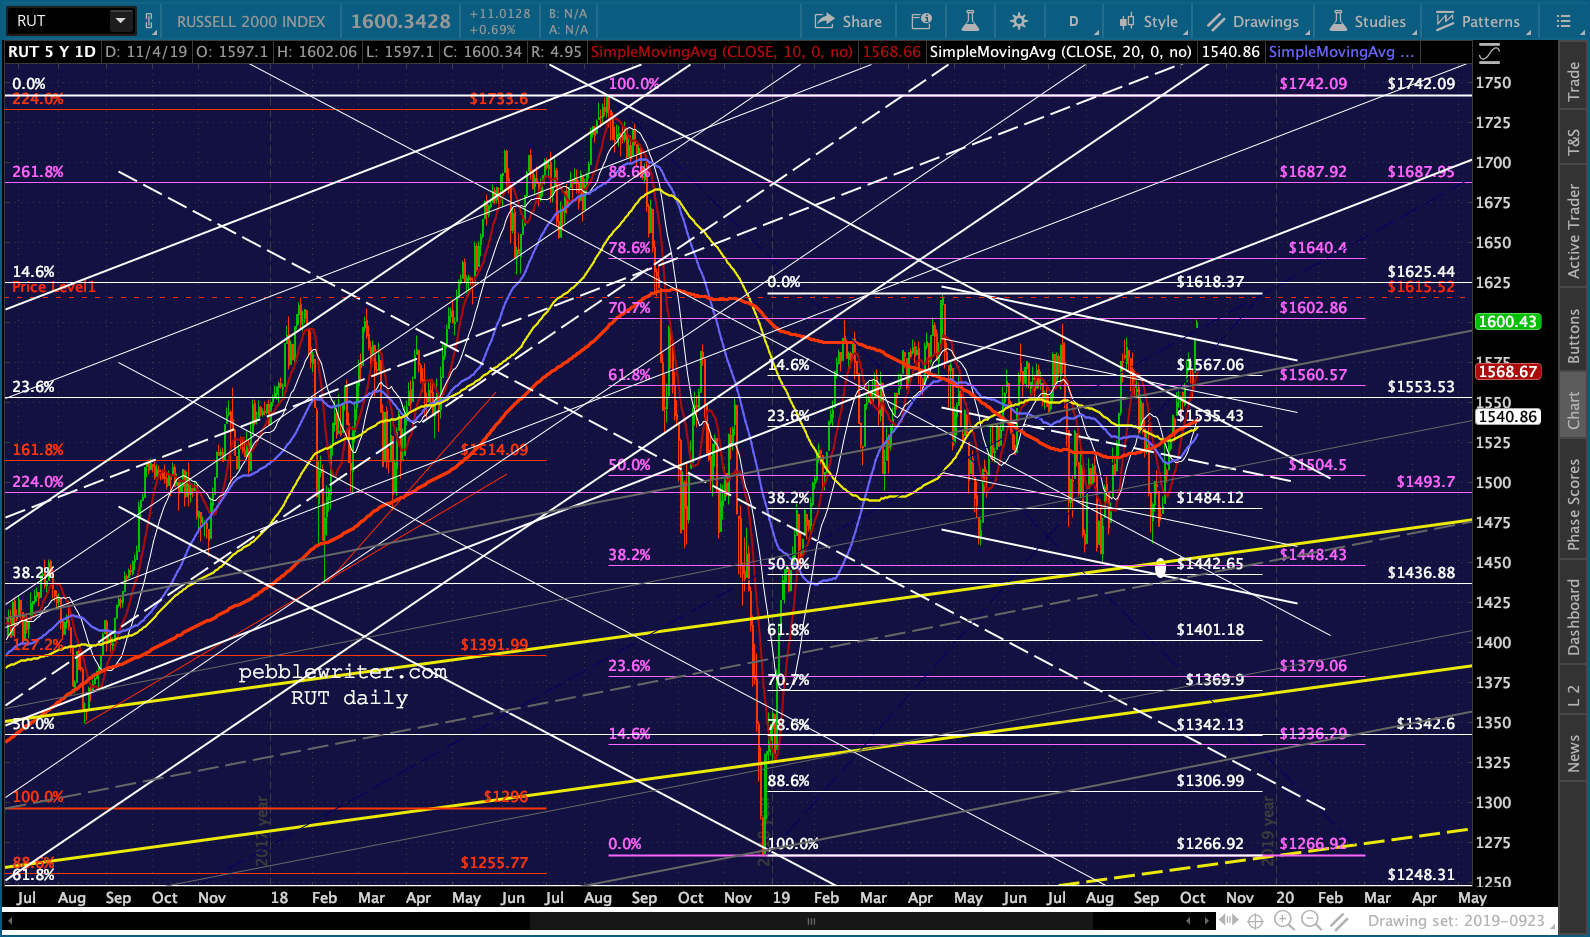 VIX is holding the line so far – suggesting stocks’ new highs won’t hold.
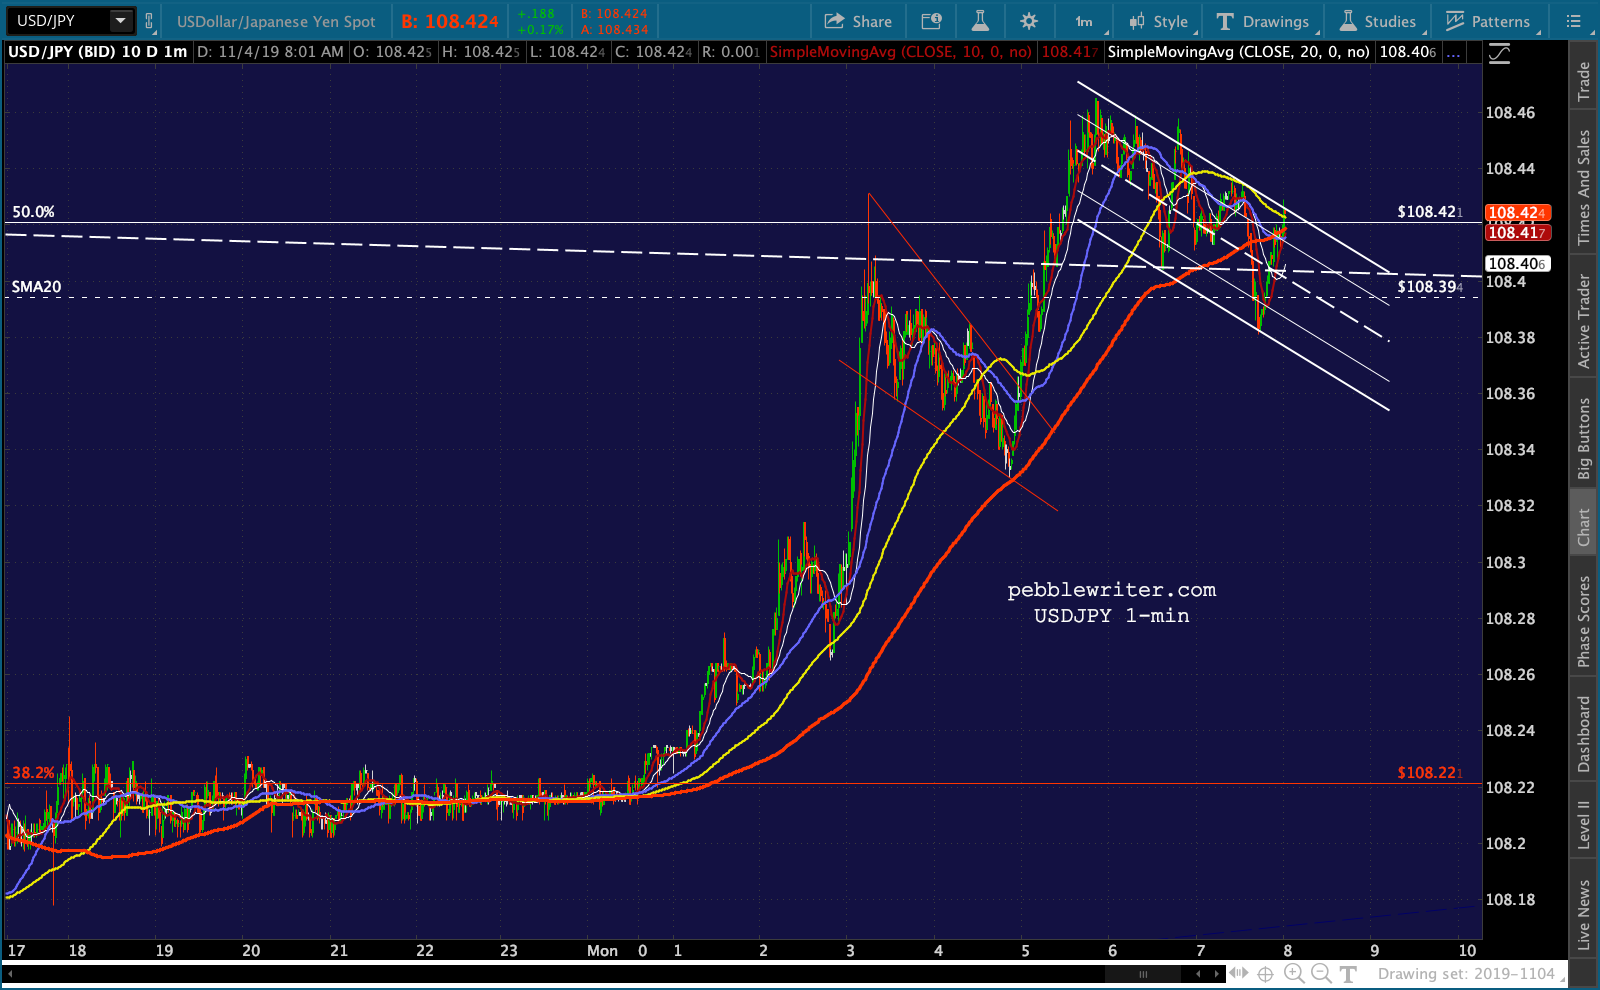
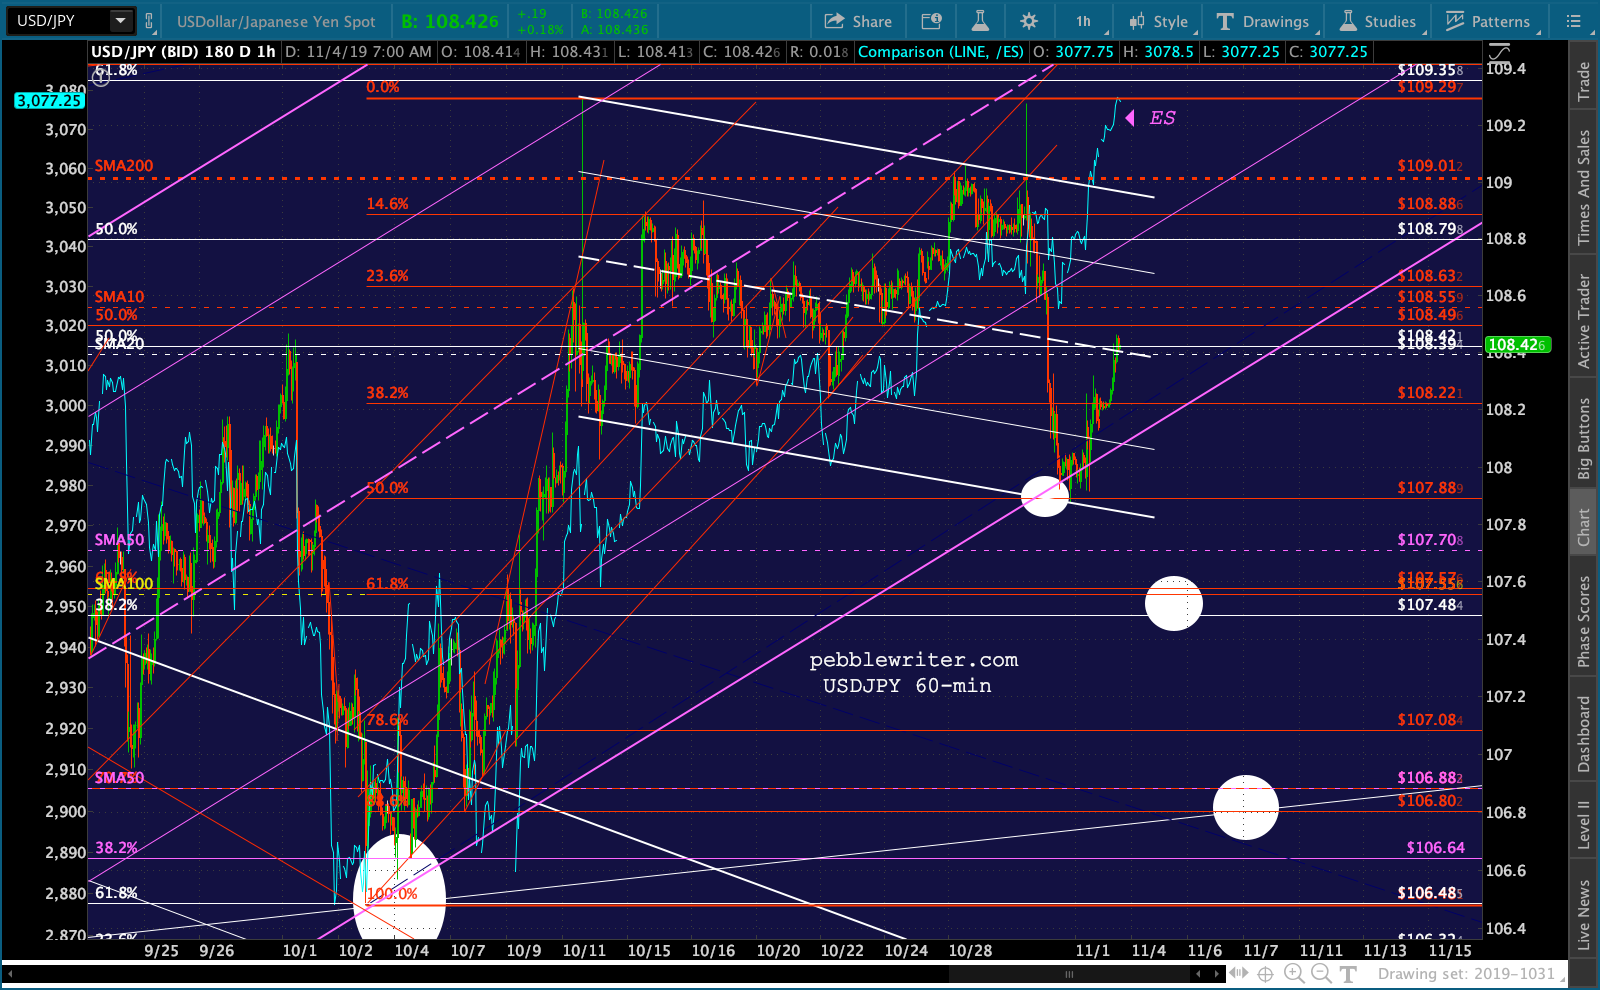
 But, USDJPY is very clearly on a mission to produce higher highs.
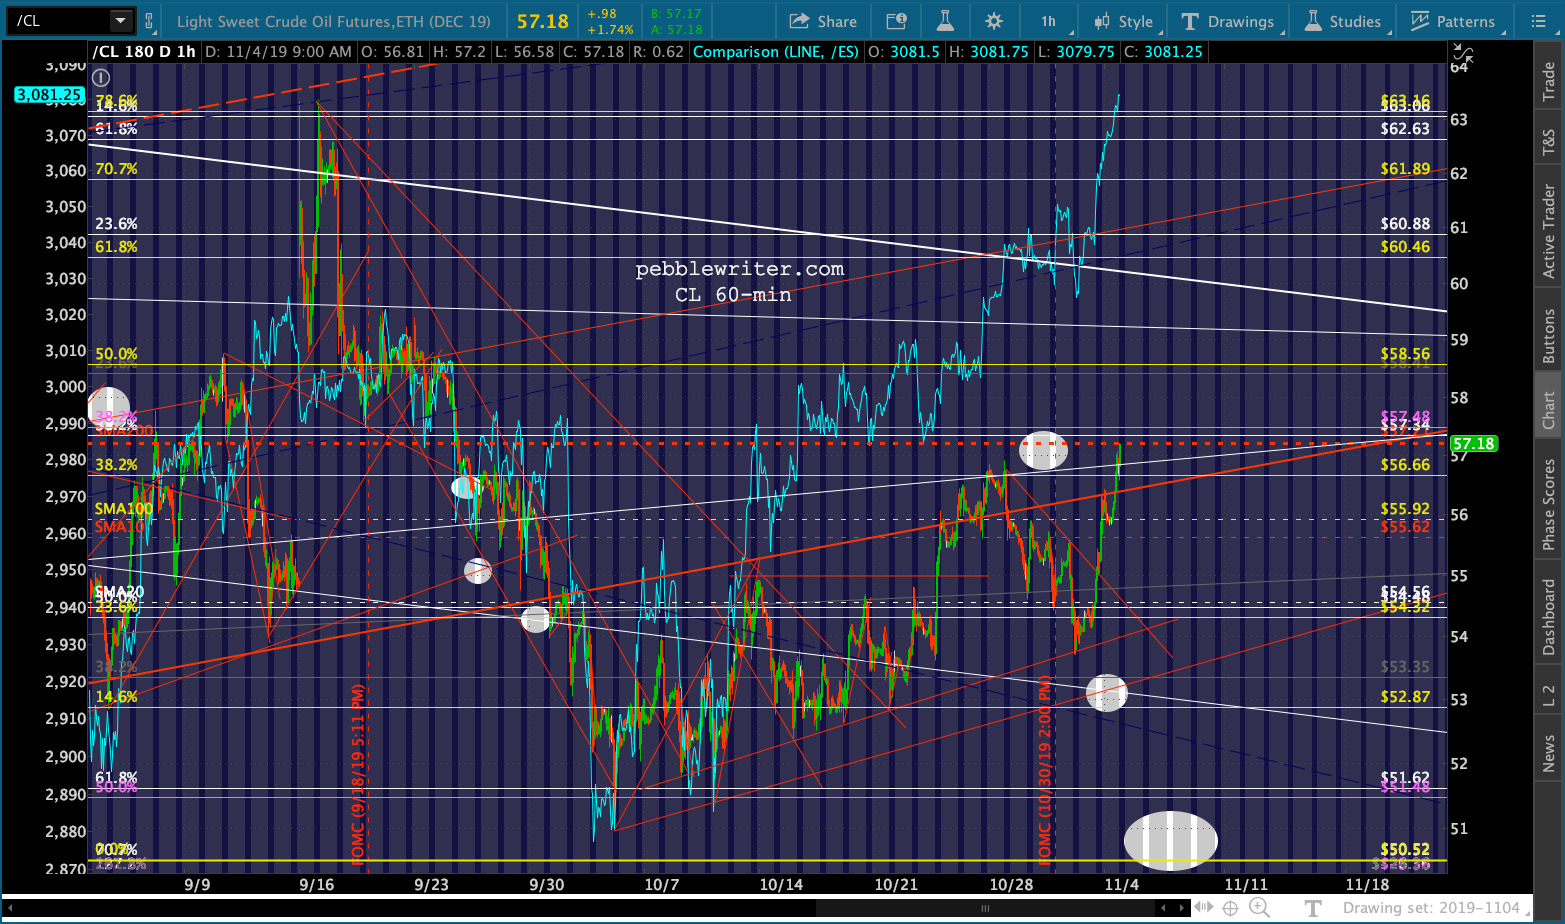
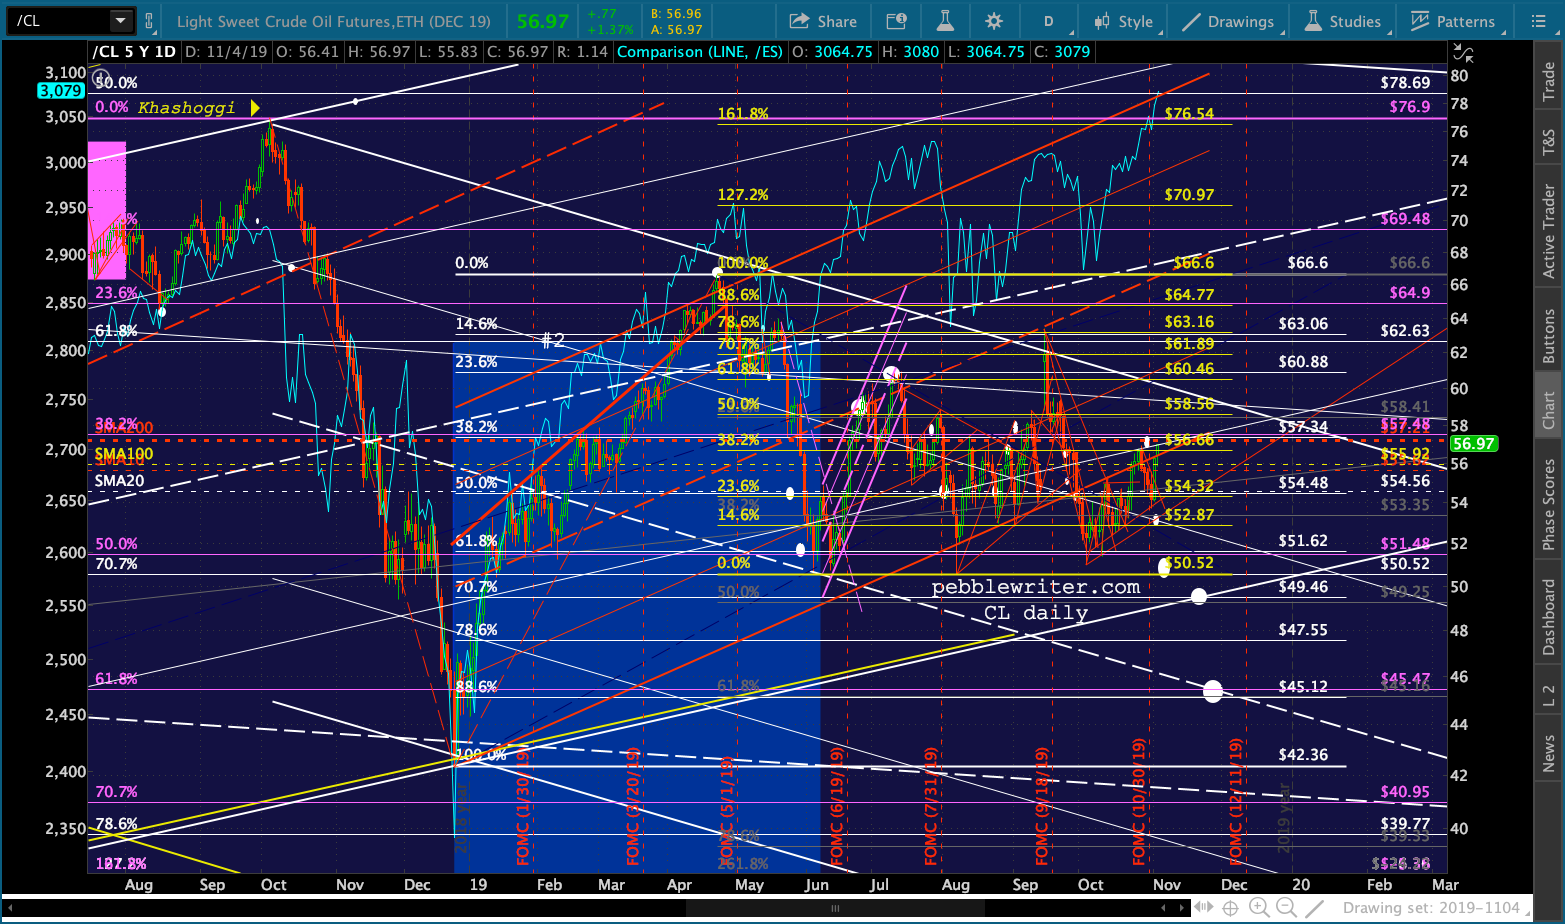
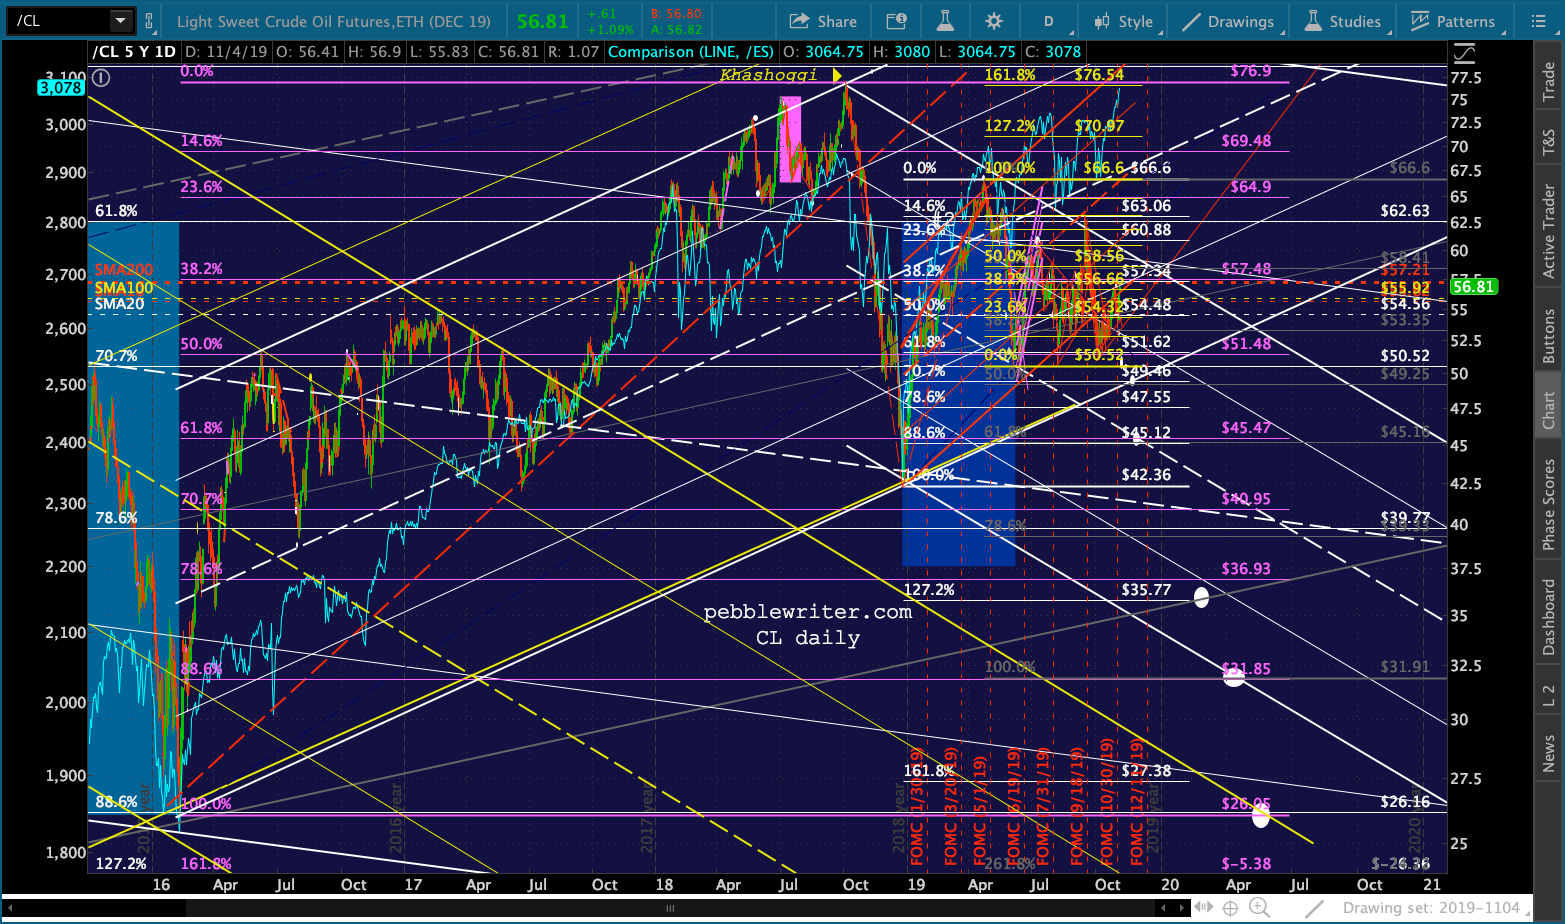
 CL has been very supportive thus far, but is running smack dab into its SMA200 — our upside target from last week. It should be shorted here with tight stops.
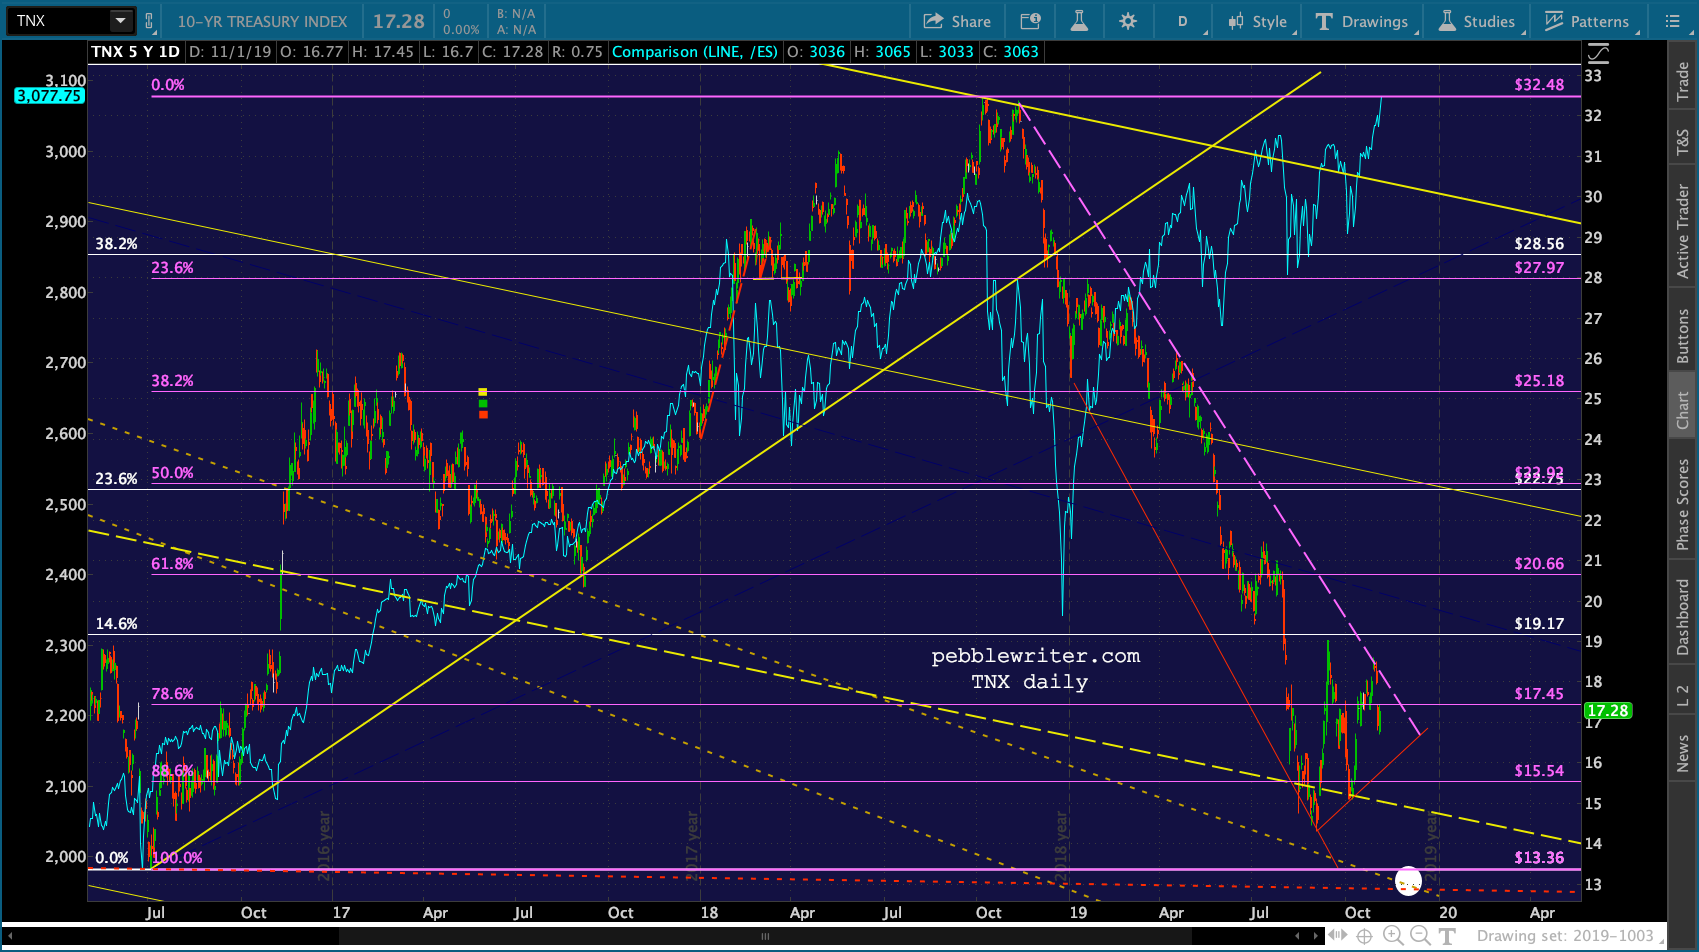
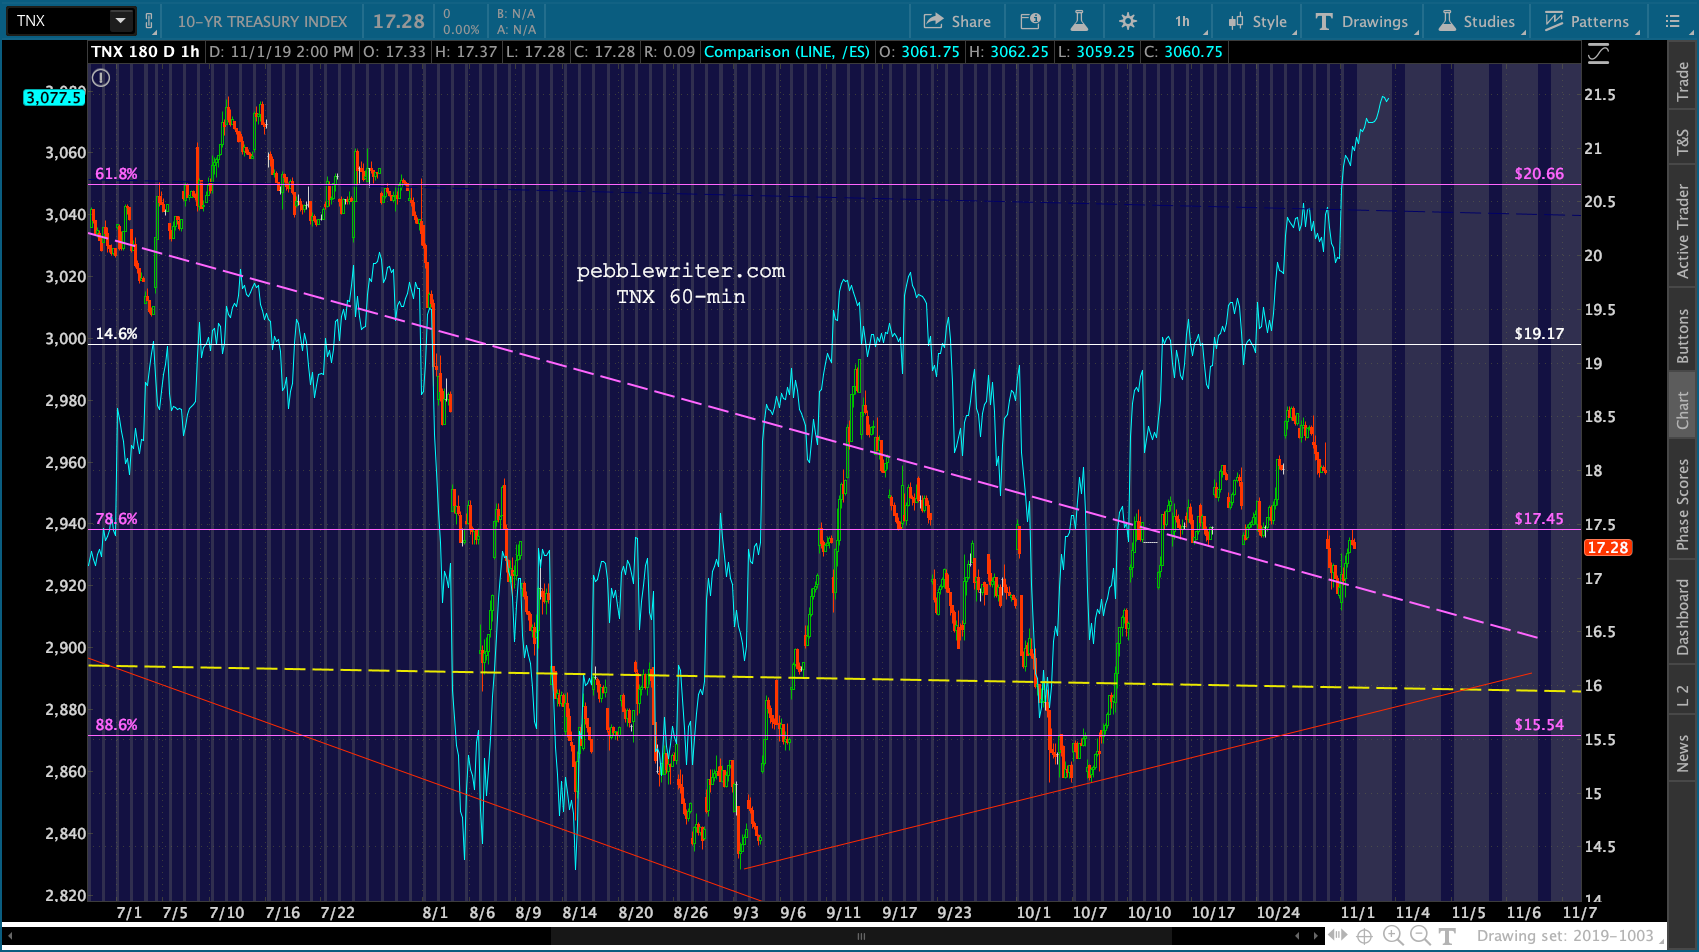
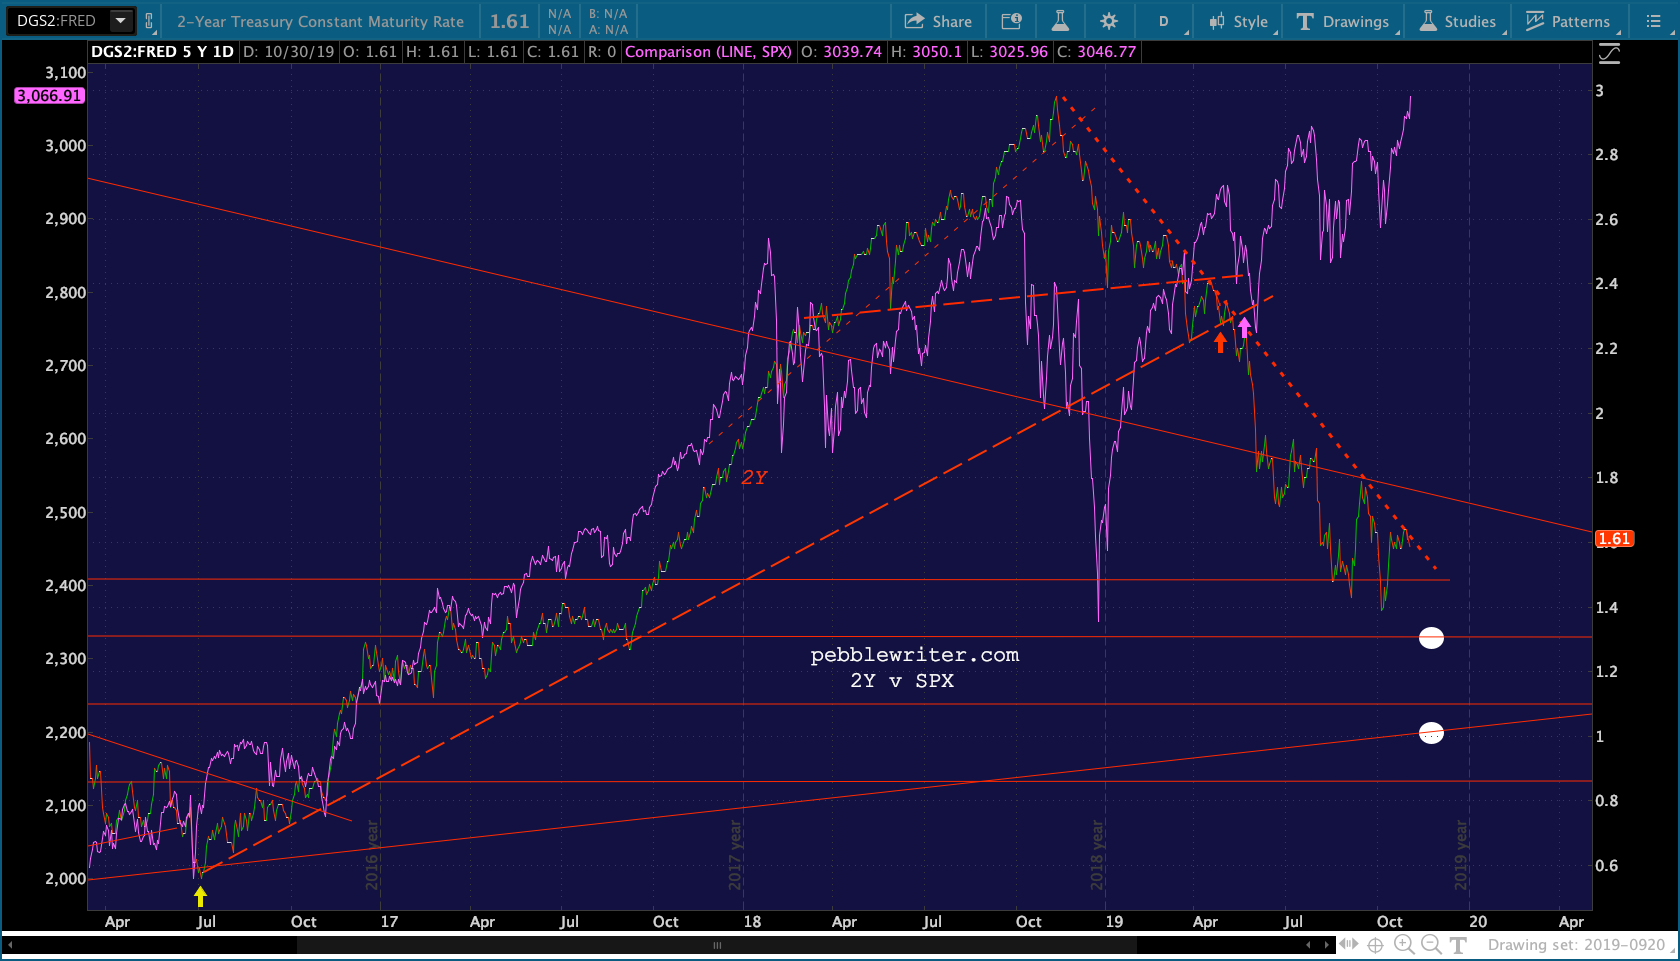
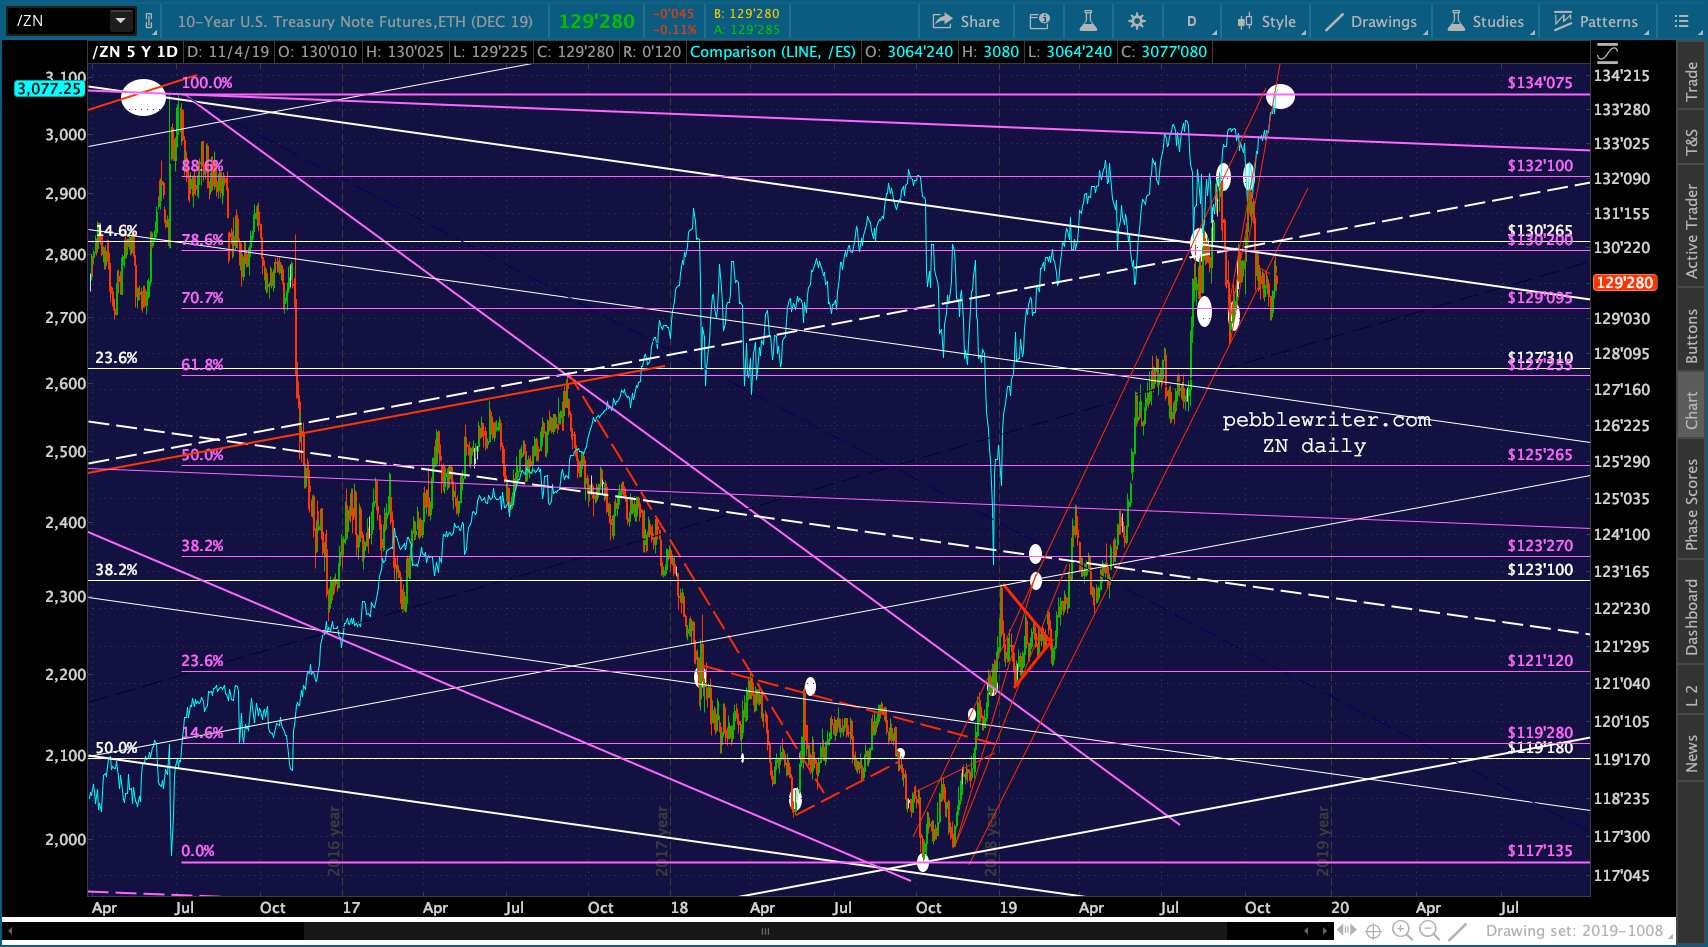
 The bond market has been pressed into service in facilitating the breakout, but the trend is still bearish.
 I assume that ES 3083.75 and SPX 3085.2 is the extent of this run.
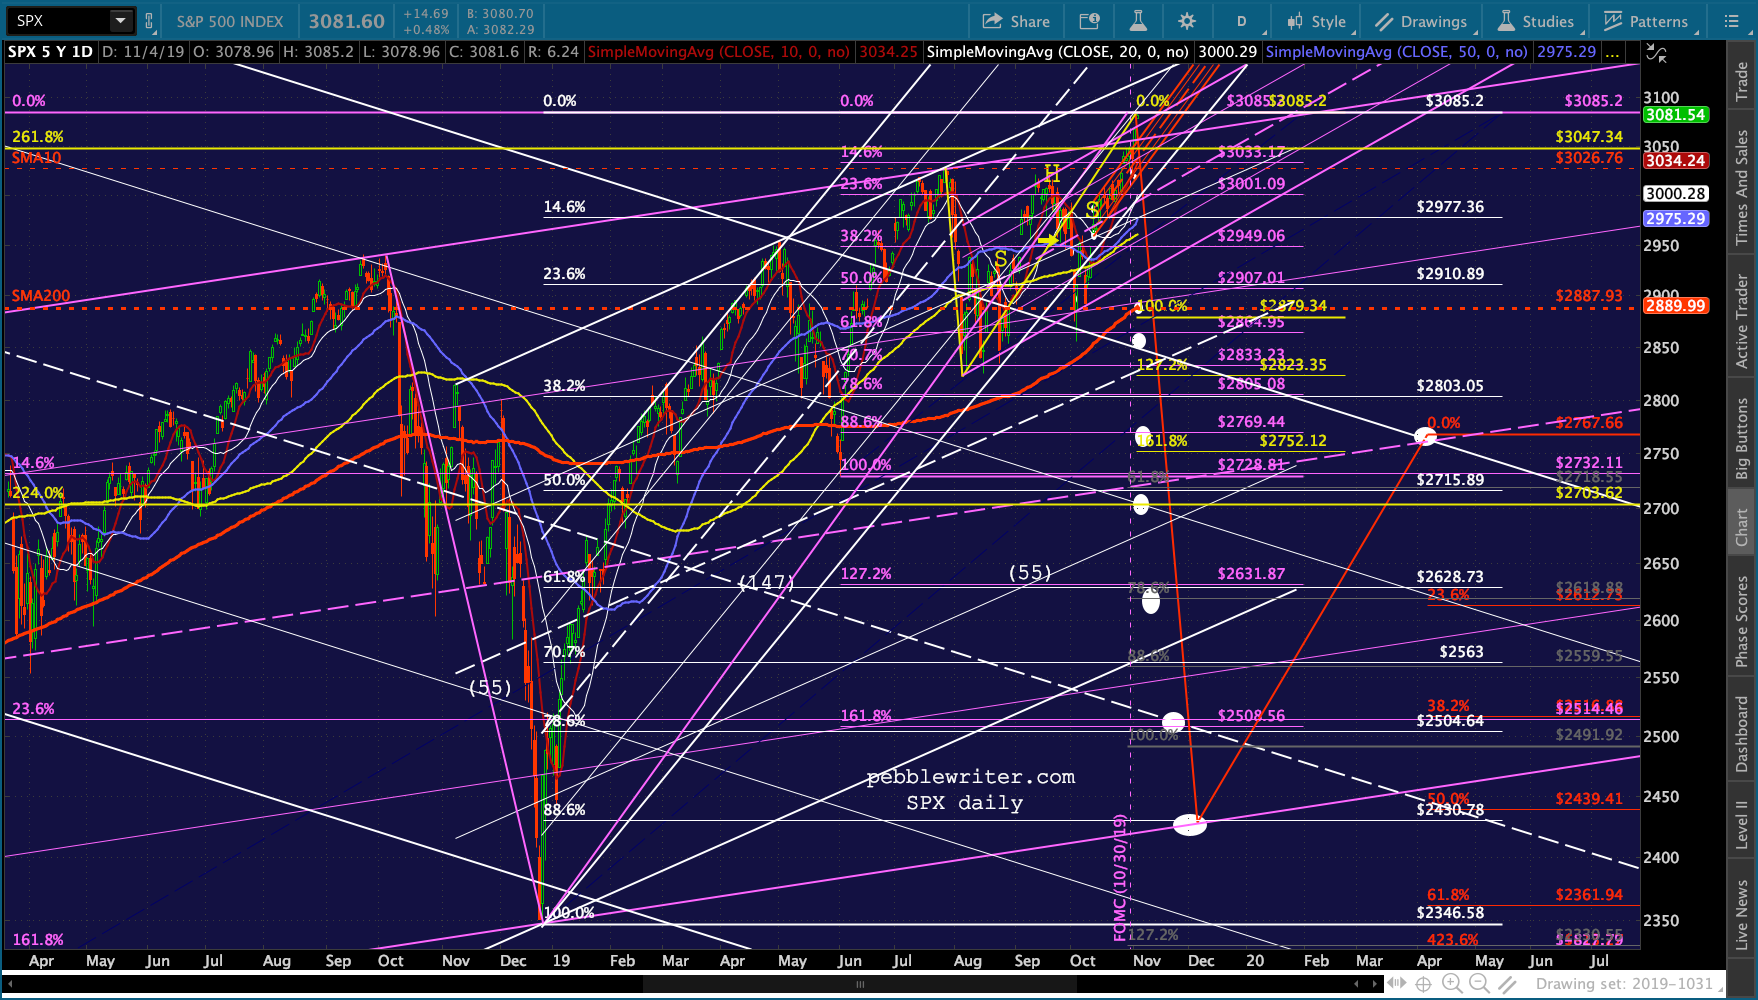 More bad news from the durable goods data coming out at 10AM?
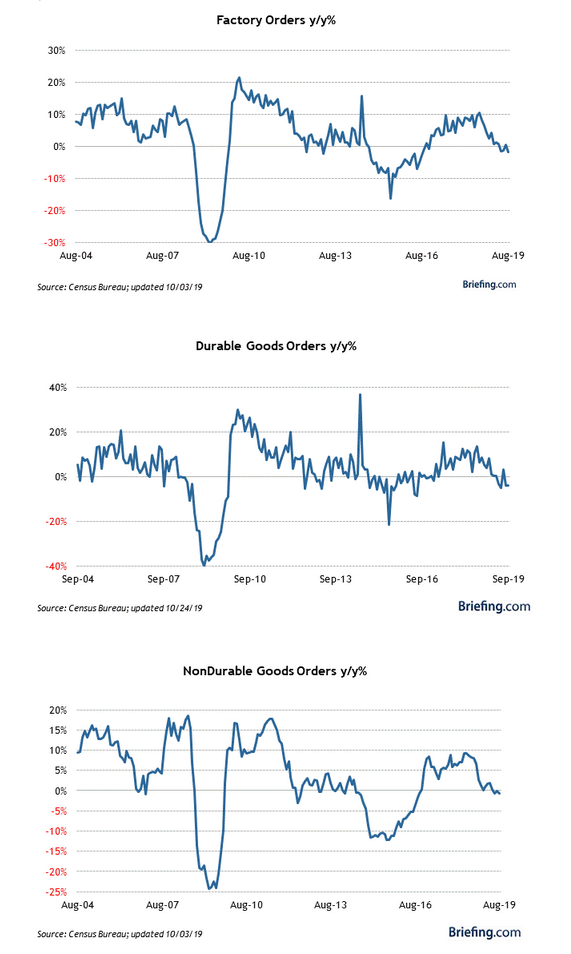
UPDATE: 10:30 AM
Sept durable goods generally missed and still point to economic contraction. Factory orders fell 0.6% versus a -0.4% estimate and a drop of 0.1% in August. Durable goods orders fell 1.2% MoM (versus last week’s -1.1% estimate) and 4.0% YoY. Non-durable goods rose 0.1% in the month. Manufacturing inventories grew 0.3% versus August’s 0.1%.
 UPDATE: 3:50 PM
The good news for bears is that ES is back below its 2.618 and even its SMA5 200. The bad news is that VIX is threatening to break below the little red TL, which would send ES back above 3076.93.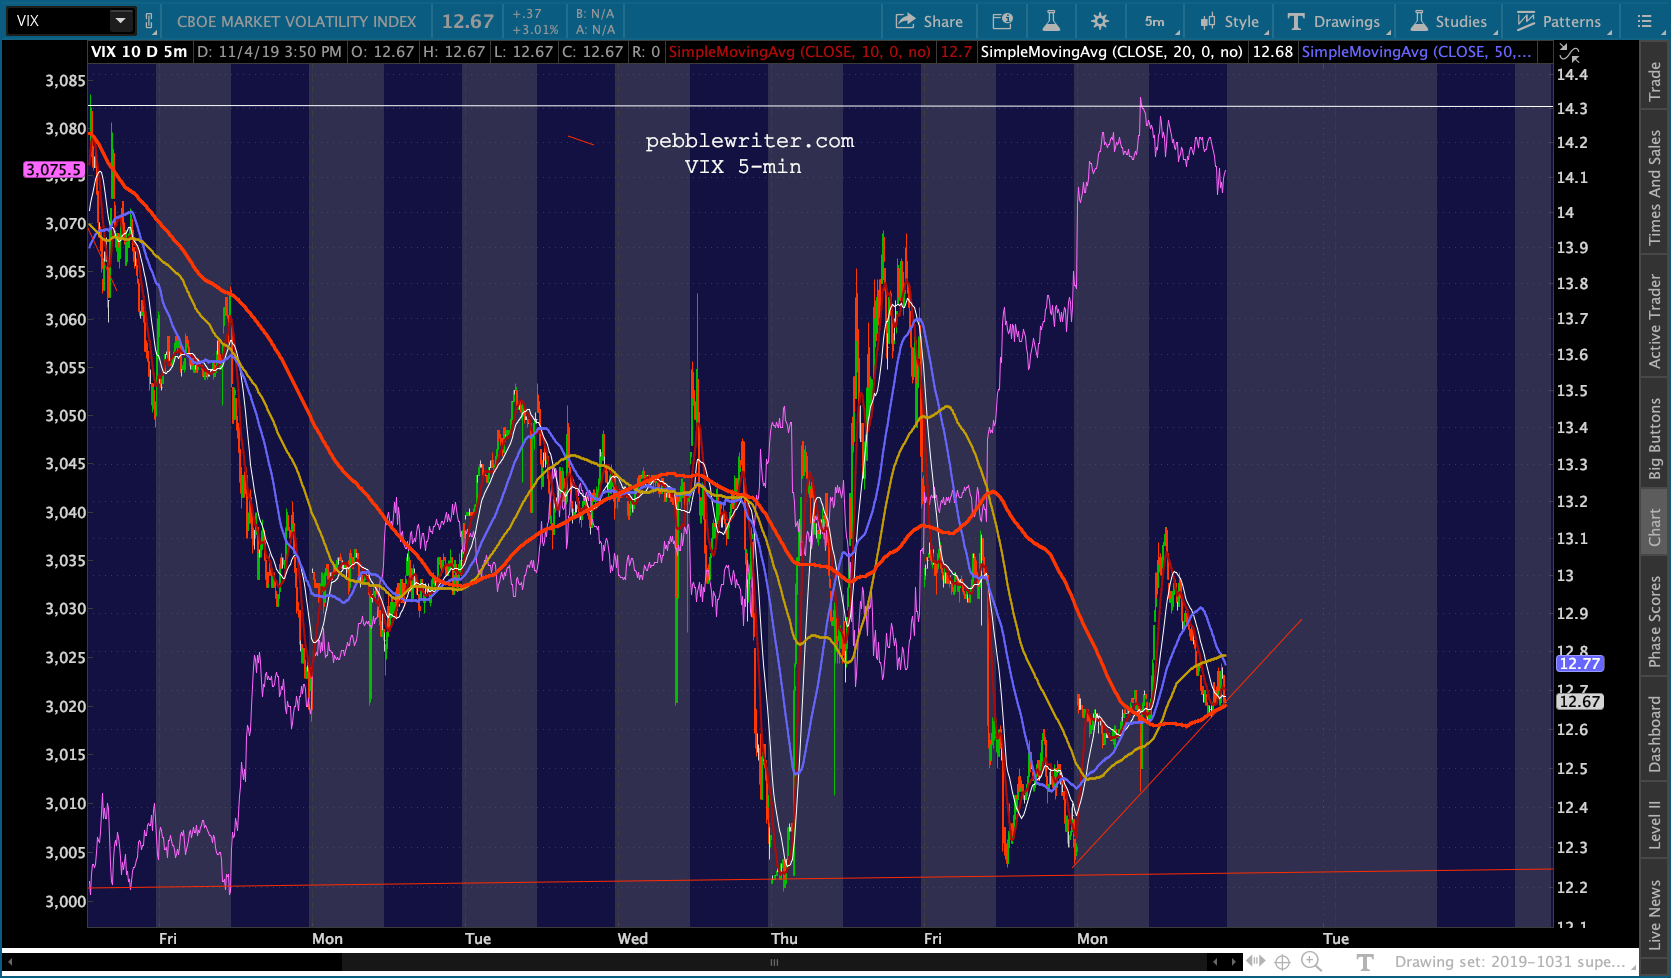 CL reversed at its SMA200 — definitely good news for bears.
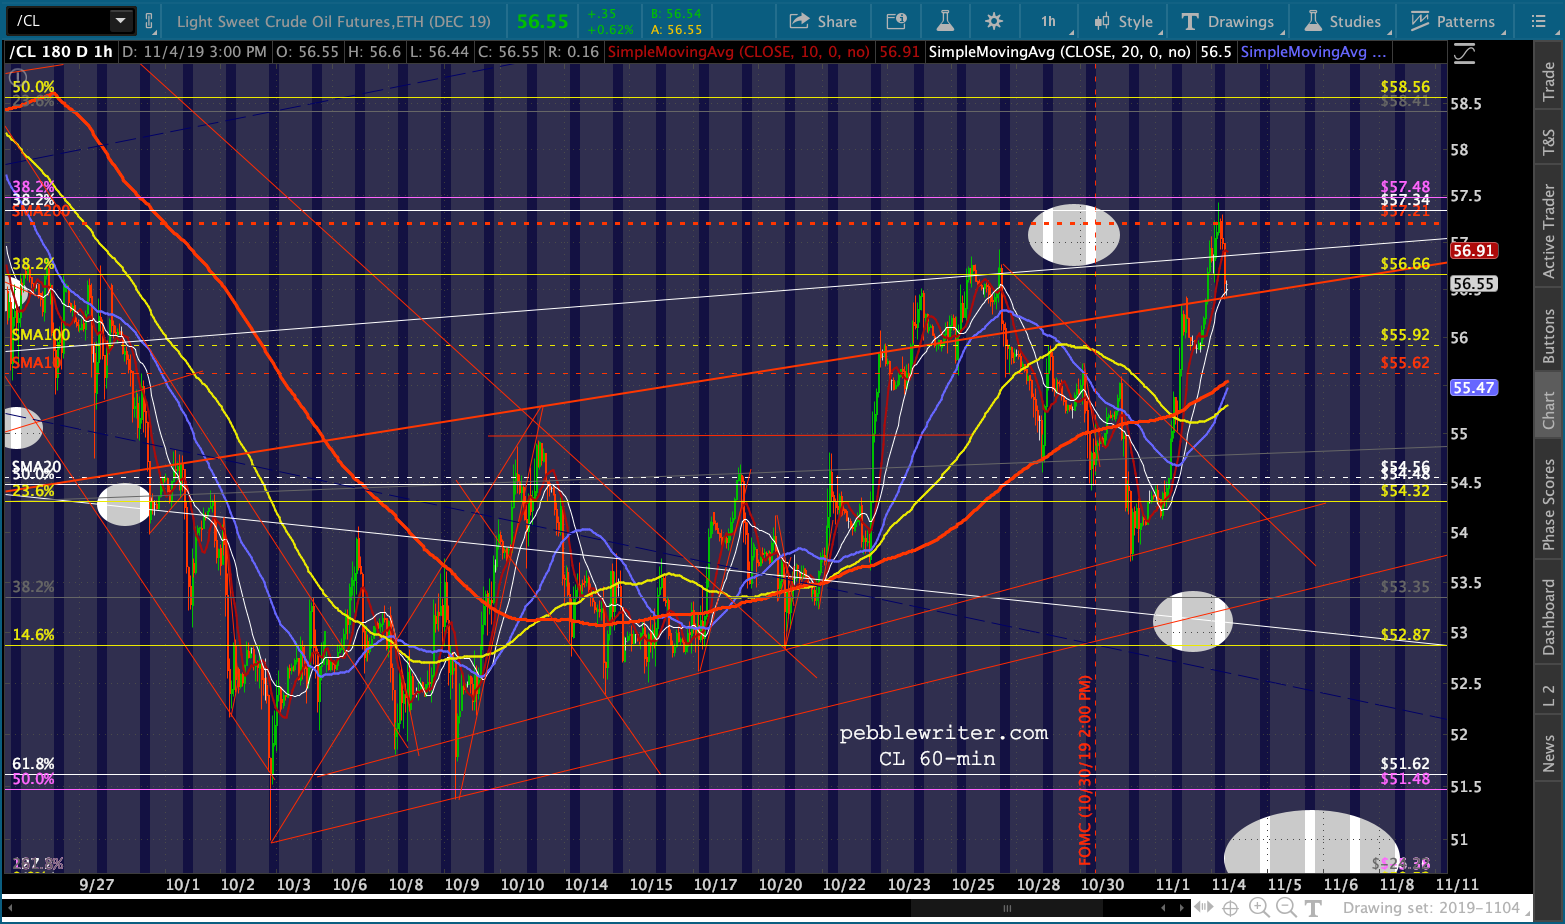 USDJPY is hanging just above its SMA10 — a threat.
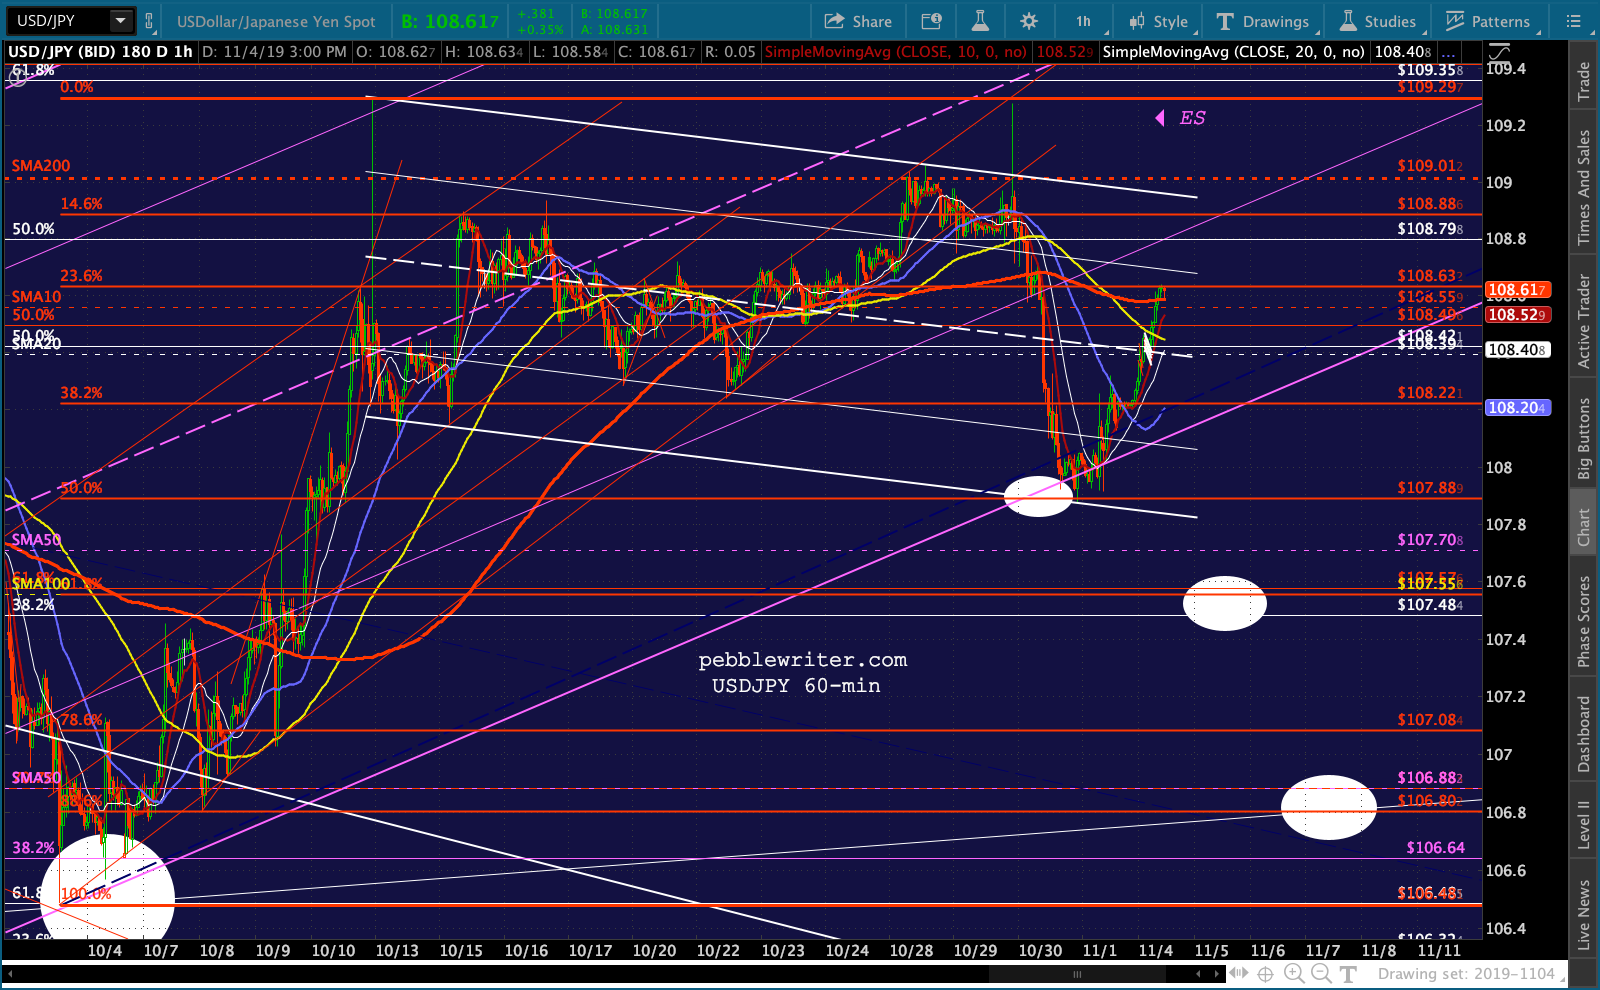 A close below 3076.93 is bearish — but, not absolutely necessary.
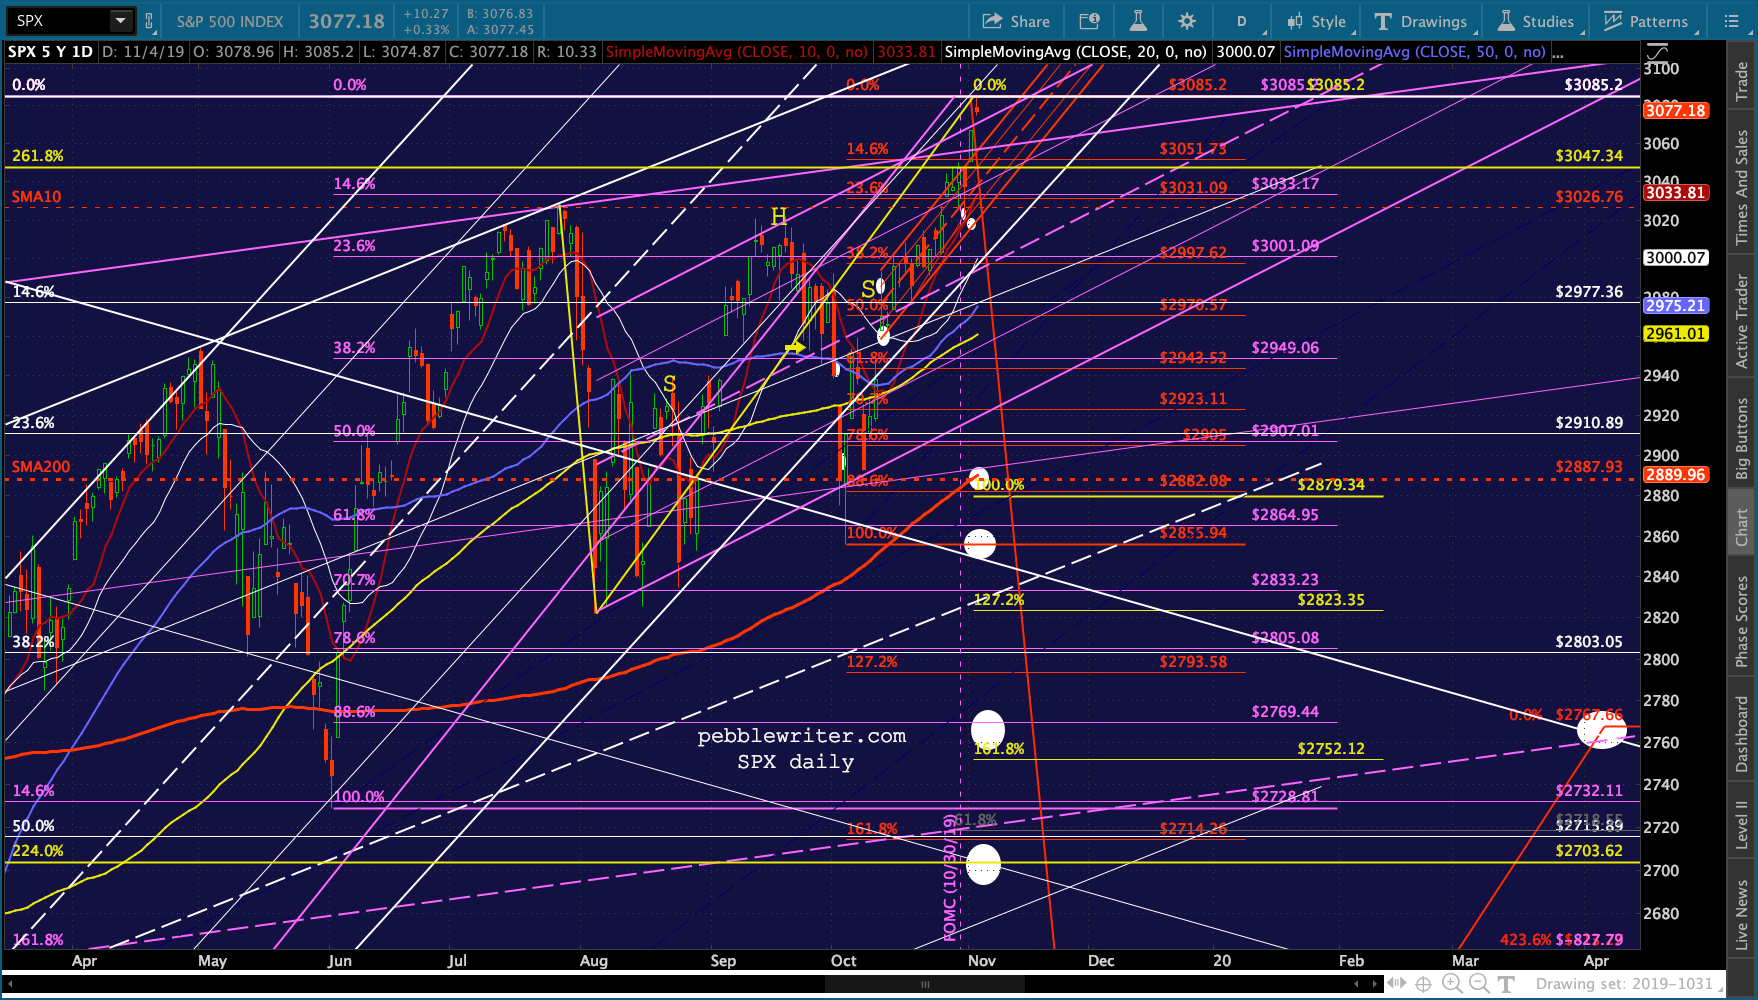
 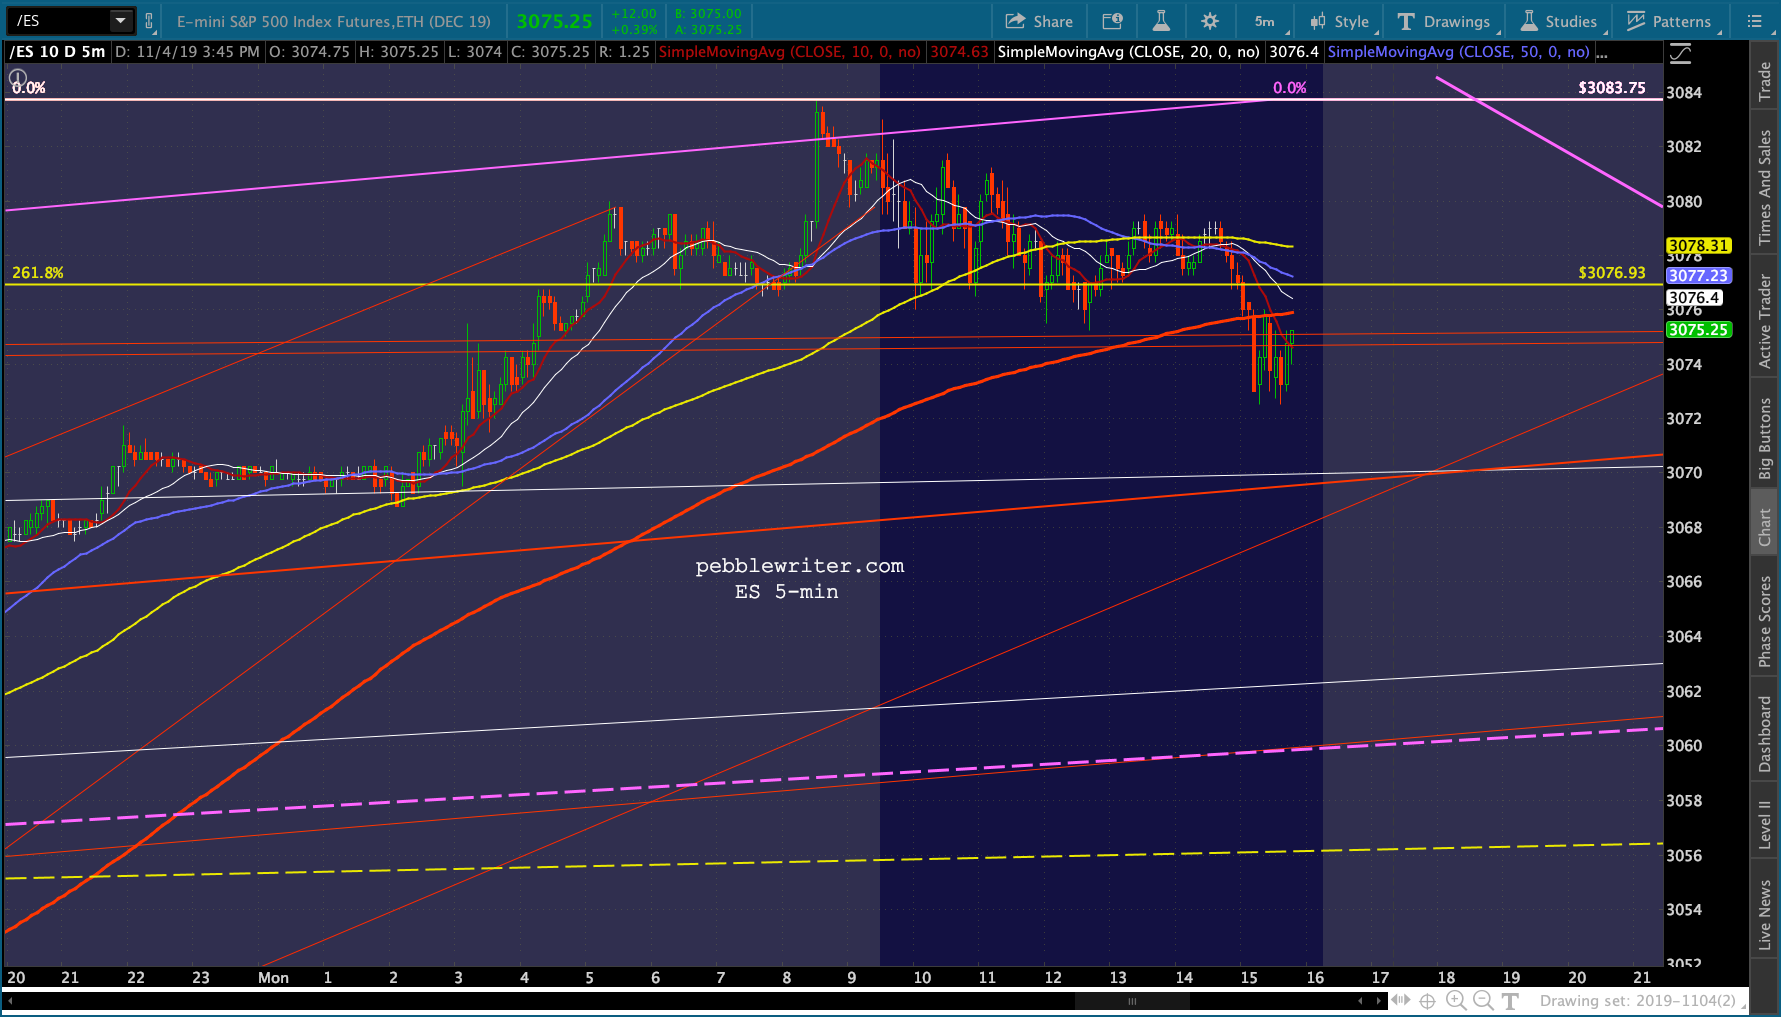 FWIW, SPX has put in a nice bearish-looking daily candle.